Looking for Path Lower to Still Begin in April
 By
Luke Miller
By
Luke Miller
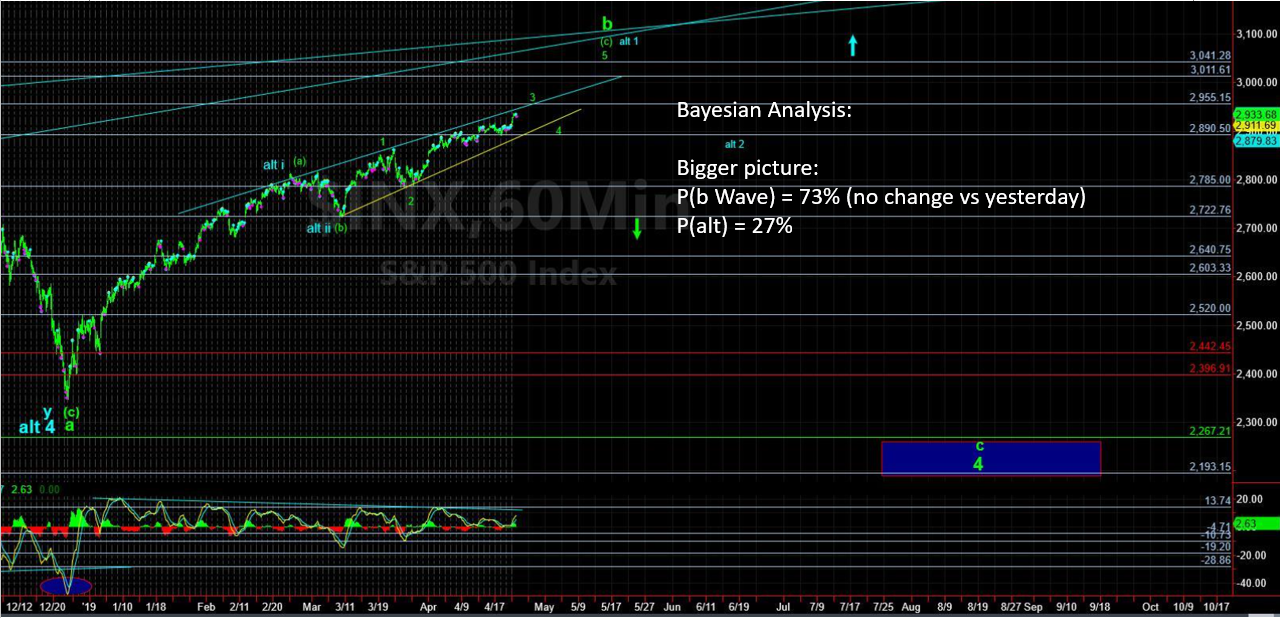
Our Bayesian Timing System still believes the path lower for U.S. indices will begin in April.
There's a Bayesian Probability (BP) of 67% that a b-wave top is seen below the resistance cluster of 292-294 in the SPDR S&P 500 (SPY), versus a 33% probability that a b-wave top is seen after a trading range for the remainder of April with one more spike high into early May (although this spike is becoming muted with highs in the 300s becoming less likely).
Continue to keep this in mind: From a macro timing perspective, consider the 6-month increments of the market over the last year – 12 months ago in early April 2018, there was a multi-month low put in; and then six-months after that April 2018 low there was an important multi-month high in early October 2018. Here we are six-months later in April 2019 (one year from the April 2018 lows) and the timing continues to support a multi-month top being put in now.
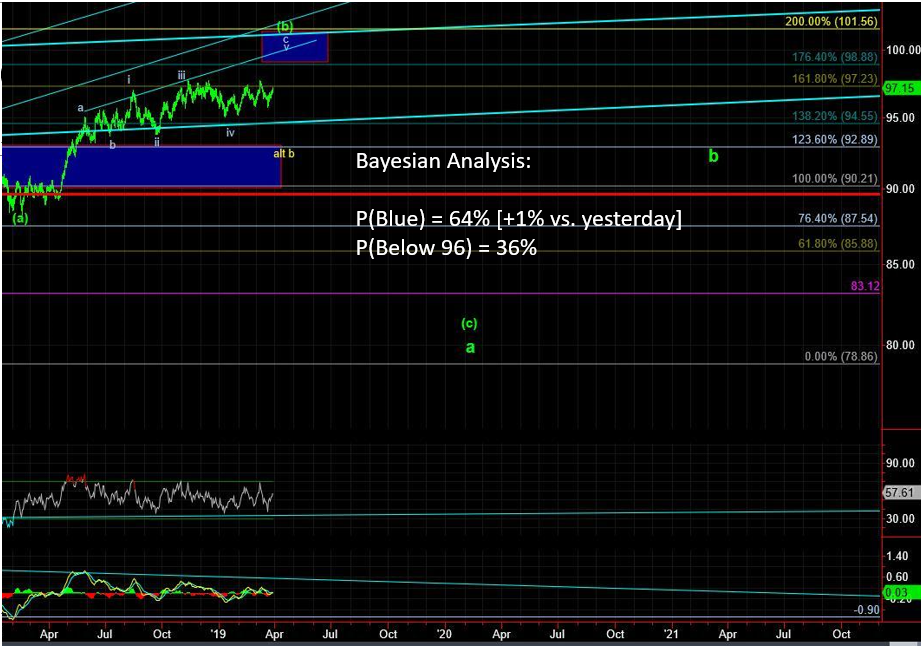
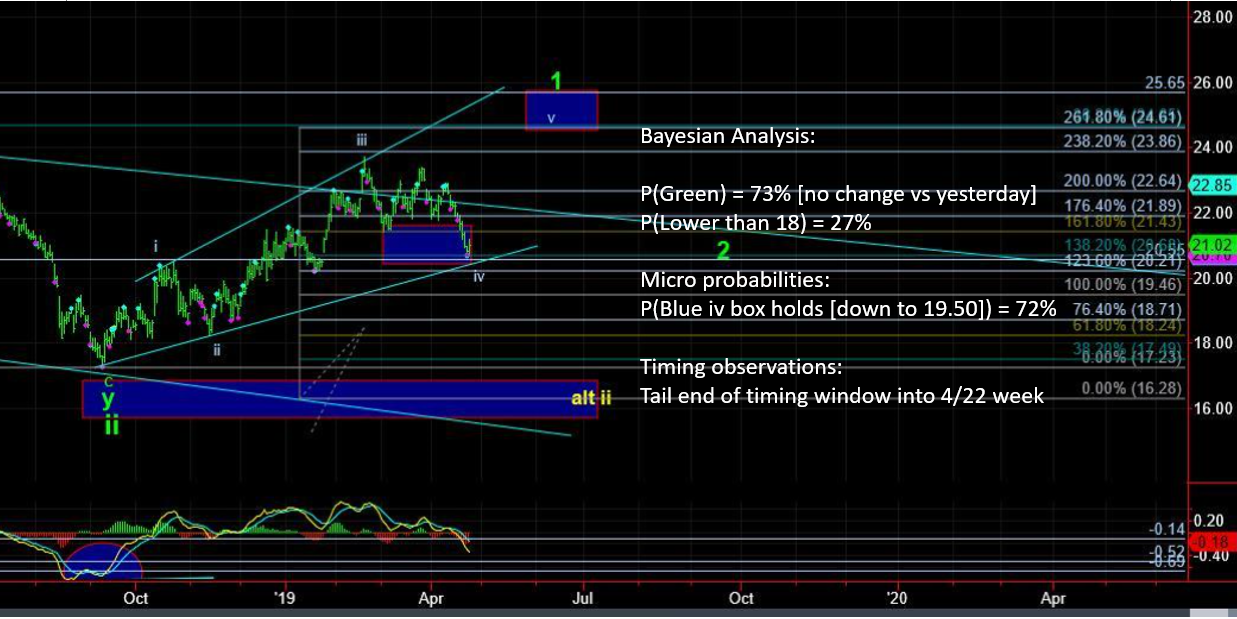
In Metals, a multi-week to multi-month bottom continues to be put in and targets at least 25 in the Gold Miners ETF (GDX) this summer into the fall. There are BTS support clusters at 21.50, which failed on April 18, and targets the key support region that has been identified above for months now (19.50-20.50) –- which were almost tested on April 24.
The most likely timing for a tradable low was last week into this week, from a timing probability perspective. A 118 handle on the SPDR Gold Shares (GLD) would be ideal, and remaining over the 118s does indicate more strength than timing indicates.
Regardless, remaining in cash has been the best play, and either a long triggers very soon or expect more choppy, un-tradable action. Below 116 in GLD and the BTS’s probabilities would indicate something else might be playing out.
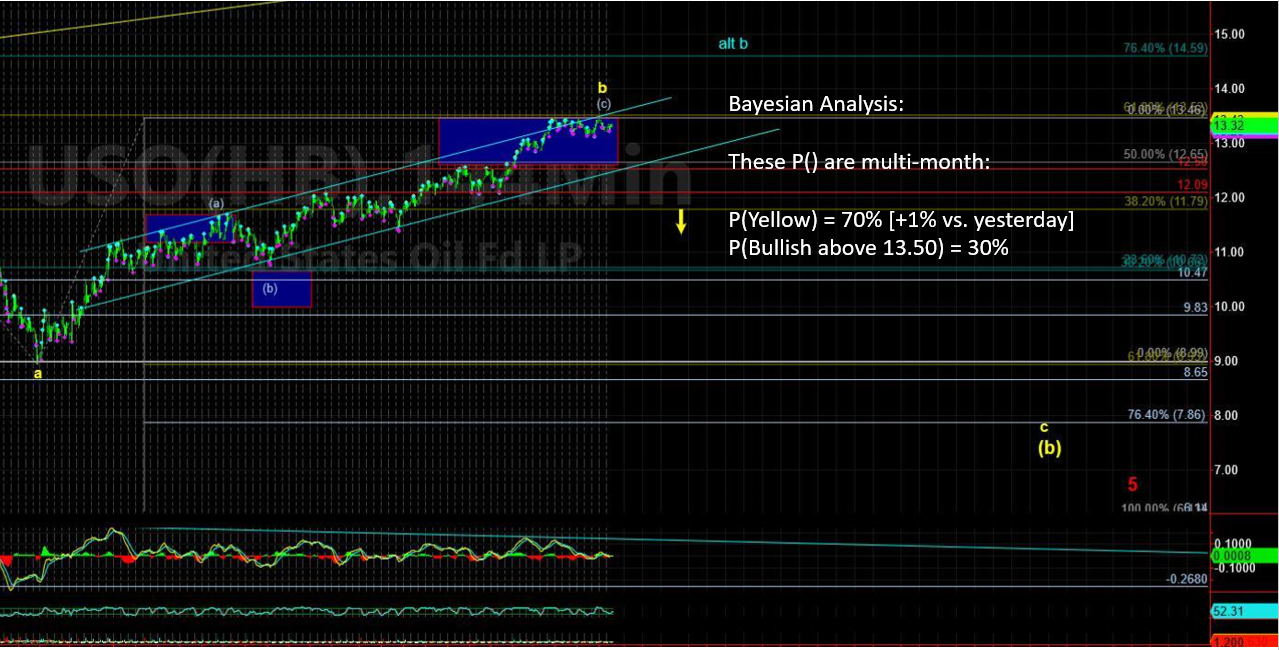
In oil, the triangle has broken higher for that most likely one more high before a strong reversal. Below 13.65 in the U.S. Oil Fund ETF (USO), which is intraday support from April 24, puts 13.35 in play; below 13.15 points to a top of some significance.
In the U.S. Dollar, represented by the Invesco DB US Dollar Index Bullish Fund (UUP), there is nothing new to add: “UUP met resistance in the 25.90-26.10 range, as the BTS expected and then turned down to the opposite end of the range near 25.55; and now back up to 26ish. The probabilities indicate a spike above 26.10 are increasing under the hood before a more sustained move lower is seen this summer.”