Looking Lower In Russell 2000
 By
By
The Russell 2000 (RUT) looks like it may have gotten a triangle as part of the wave b of 2 here. So as long as we hold under the 1557 level, I am still looking lower on this chart.
We do need a break back below the 1517 low to give us confirmation of this, but the triangle is certainly more suggestive of this being corrective wave action to the upside rather than the start of a new move higher.
The smaller timeframe price action fits with the base case on the RUT chart, which again is suggestive that we are topping in a wave b ready to begin a wave c of larger wave 2 down. Confirmation from a larger perspective remains at the 1484 level followed by a move through the 1455 fib below.
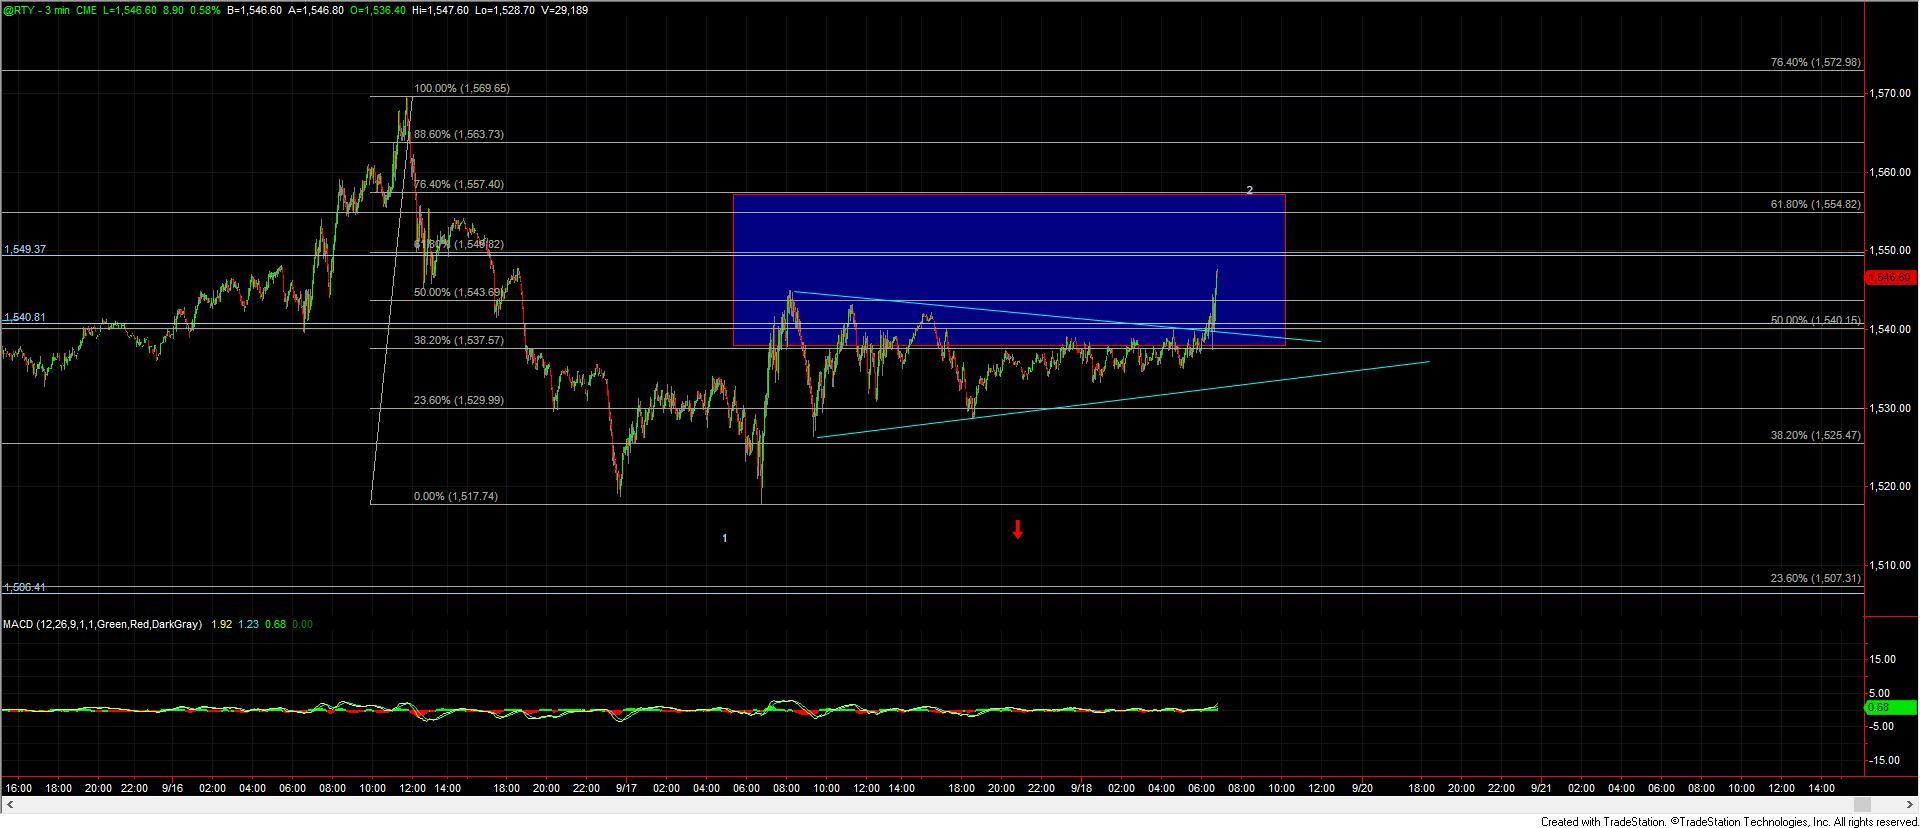
RTY 3m
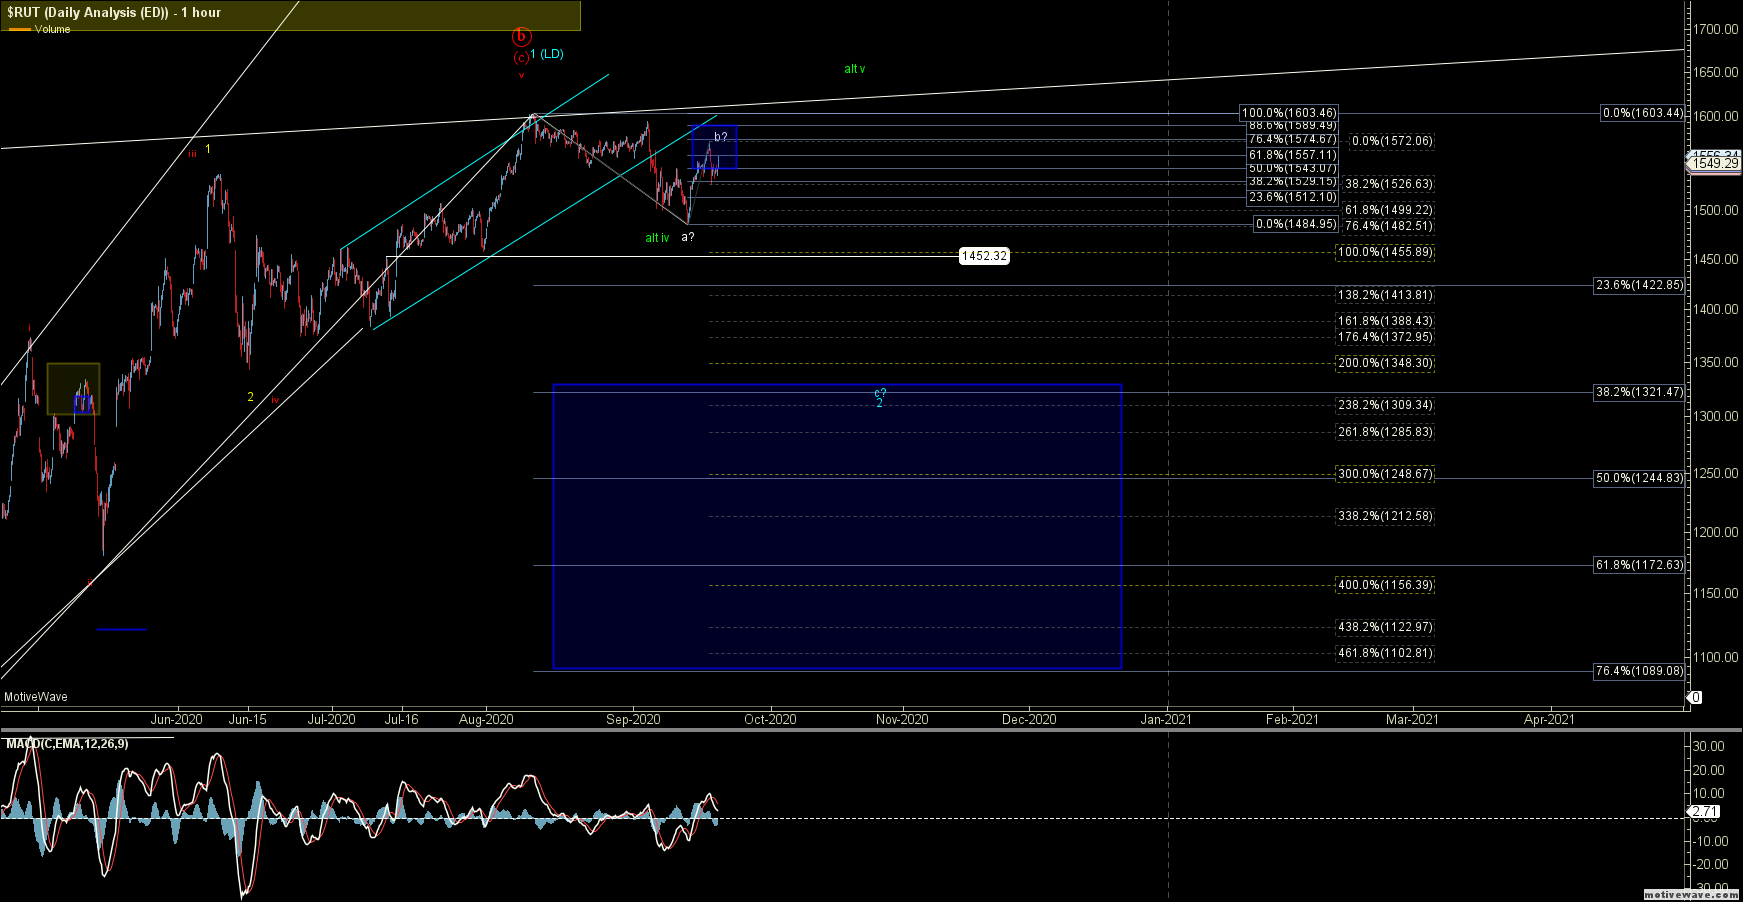
$RUT (1 hour)
