Looking Lower Before Nasdaq Bottom
 By
By
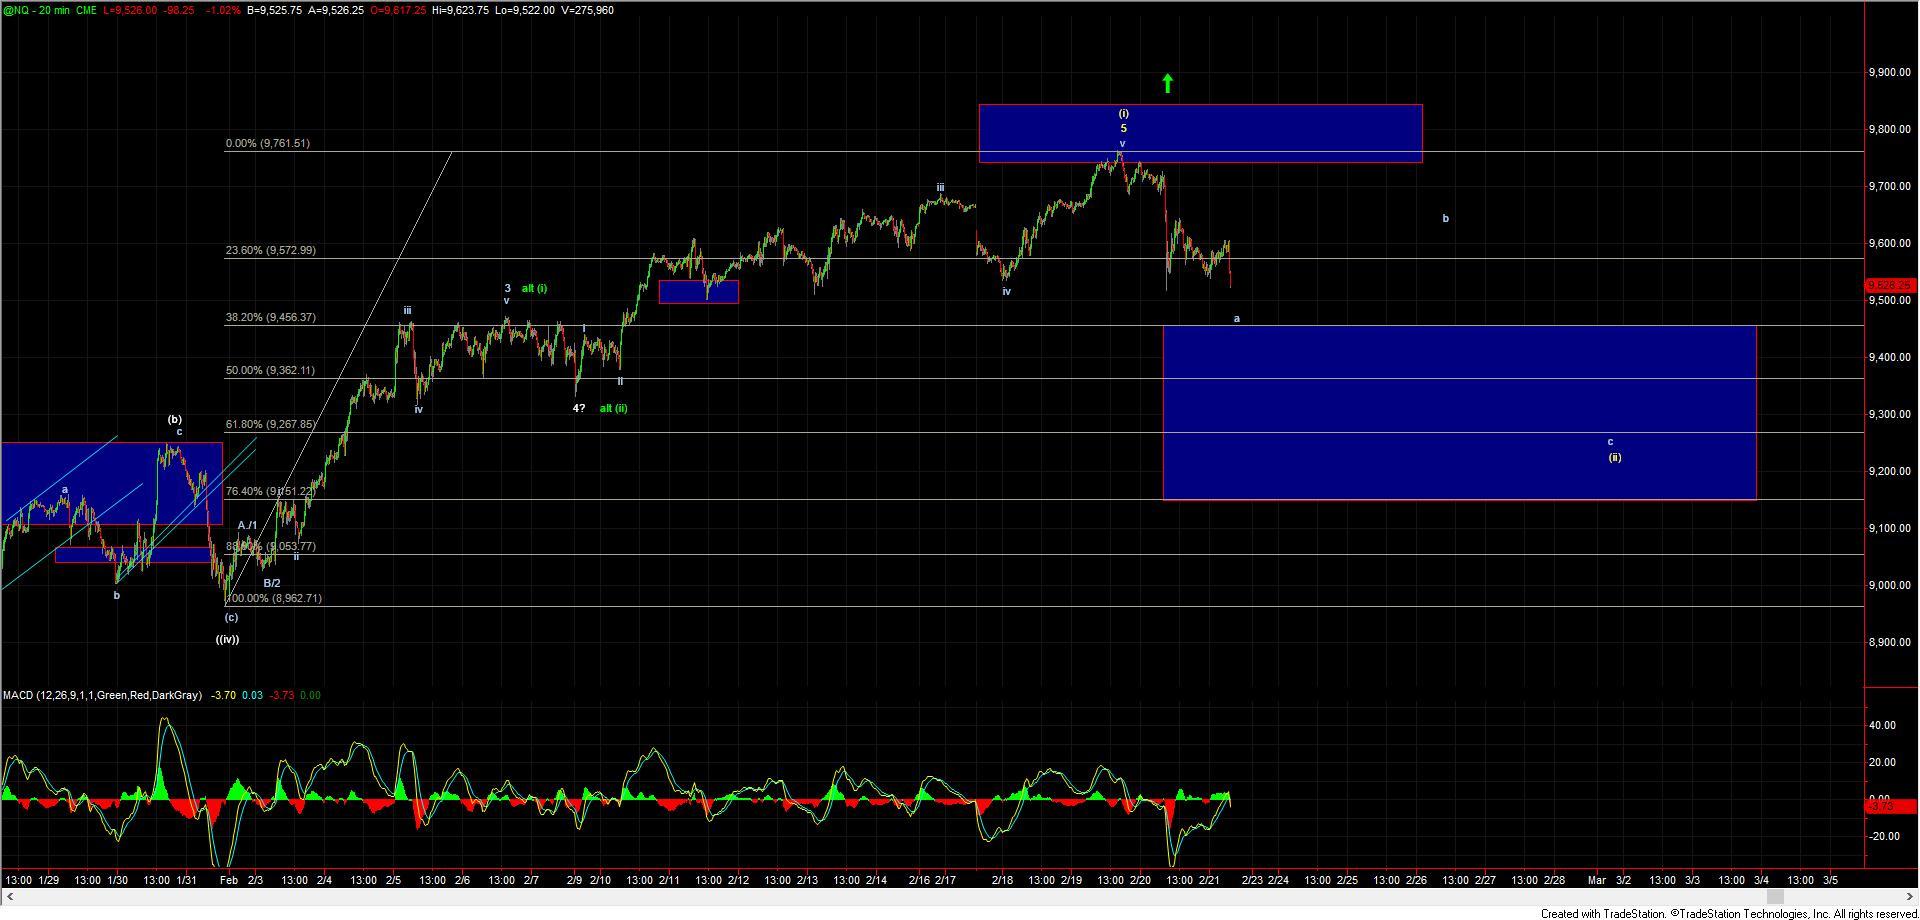
With the hold of resistance and break back lower, my base case is that we are in the wave (ii) per the yellow path that I have been discussing for several days on the Nasdaq 100 (NDX) and Nasdaq Futures (NQ).
While it is still a bit unclear how this corrective move will subdivide lower as we are not quite in the ideal support zone for wave (ii), I do still prefer to see this move a bit lower prior to forming a bottom. That said, should we see a full five up off of the lows, it would give us an initial signal that a bottom has been formed, but we still would need confirmation with a break back over the previous high at the 9761 level.
Current support for wave (ii) comes in at the 9456-9151 zone on the NQ. Assuming we can hold that zone, then I expect to see the wave (iii) under this case take us higher over the course of the next several months.
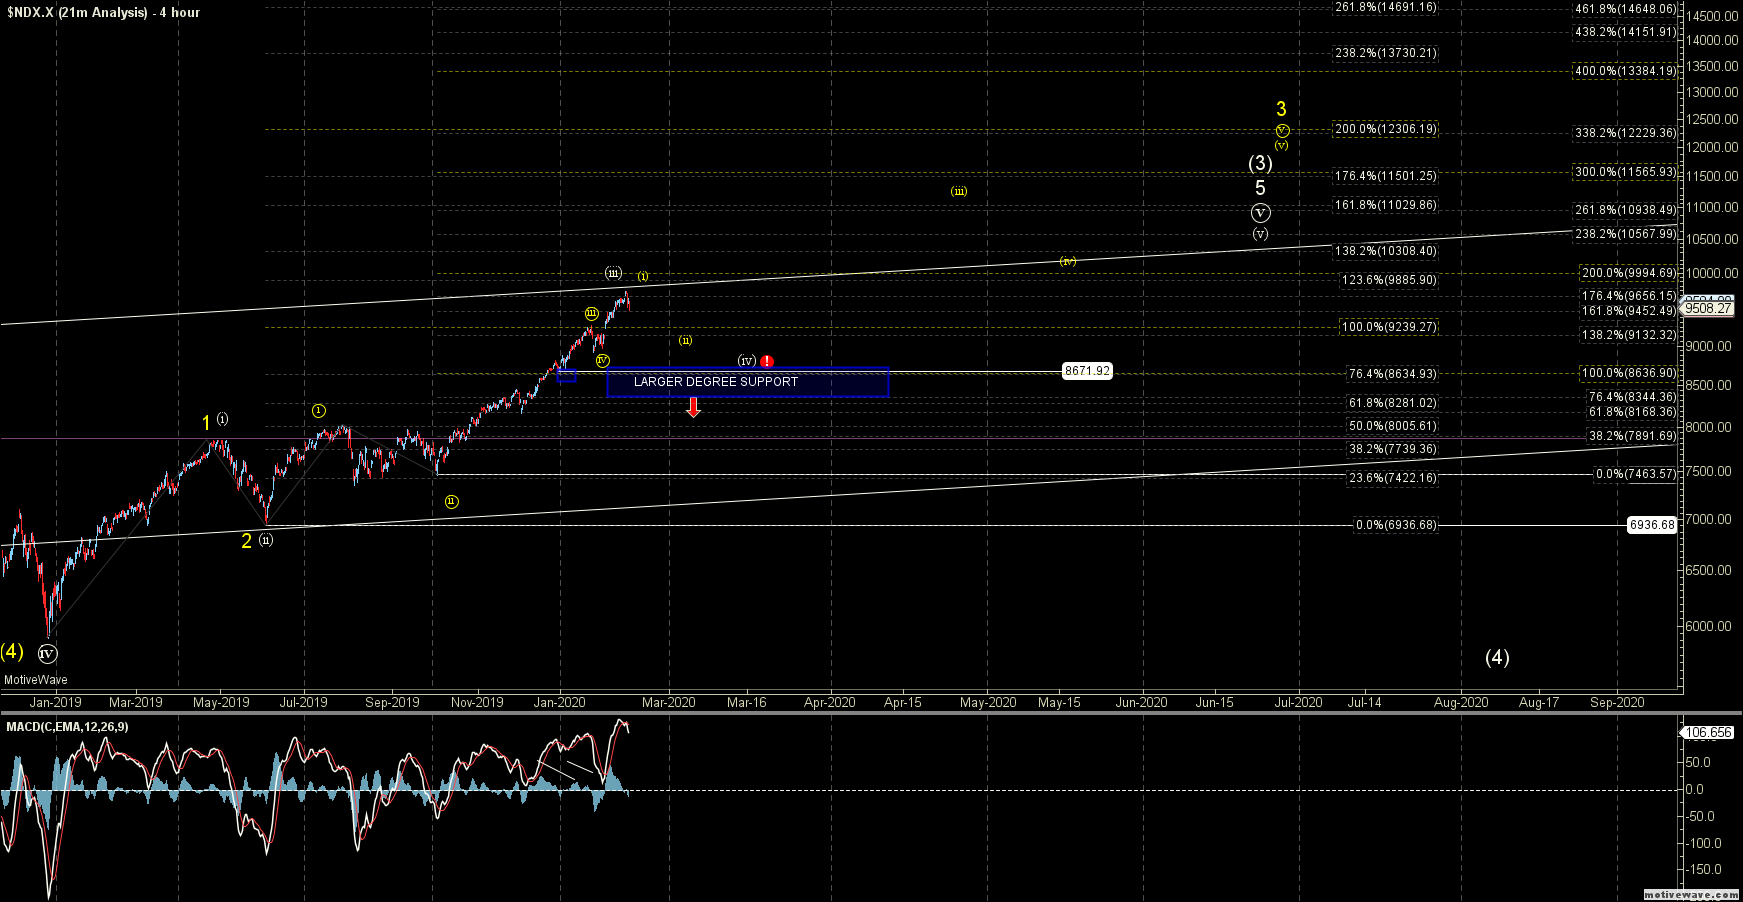
Zooming out a bit and assuming we do follow that impulsive path higher for wave (iii), it should target up towards the 10,567-10,938 zone depending on where wave (ii) bottoms. Alternatively, if we break that support zone for wave (ii), then it would open the door to this revisiting the lows that were struck in late January prior to turning higher once again.
Now even under that case, the overall pattern does remain quite bullish as long as we can hold the larger degree support at the 8636-8344 zone on the NDX. Moving below that zone would open the door to the larger Ending Diagonal count which is shown in white on the NDX chart. Over that zone, however, and there is nothing to suggest of any kind of an imminent significant top.