Long-Term Bitcoin (Weekly Charts)
 By
Ryan Wilday
By
Ryan Wilday
As we’re deep into this cyclical bull market, we do have to take a step back from all the quick money we’re making to look at the long term. It’s easy to forget that with every cyclical bull there is a cyclical bear lurking around the corner. So I wanted to take this opportunity to update the weekly long-term Bitcoin chart. I will, in due time, long before this bull market ends, get to Ether and GBTC.
Note that these three (BTC,ETH, and GBTC) are the only charts we have with reliable long term projections beyond the current bull market. So, I am not going to produce unusable weekly charts on your favorite altcoin. That’s a natural question that arises after such reports. Significant damage was done to the long term counts I held for other majors during the 2018 bear market and many of our coins are in reset.
The Warning
Also, I want to serve up my typical warning on moon counts. It’s tempting to think one can just HODL and not think with such counts. But HODLers quickly learn that is a mistake as a secular bear takes hold. That feeling intensifies when the moon count they relied on to make their wildest dreams come true is invalidated in a bear market. A count is only as good as its support continuing to hold. When we enter the next cyclical bear we’ll have a refined view of support but most HODLers would do well to preserve any profits they consider precious. For they may otherwise not see them again.
Criteria
The first time I wrote up an extensive ‘article’ on the long term Bitcoin count, I first wrote a preamble article breaking down what I look for in a count. I’m going to save you some reading, and this time simplify it into three criteria:
Visually ‘proper’. By this I mean it looks like an impulsive structure and is proportionally extended where it should be, in the third wave, (or fifth if metals).
A propensity to hit or closely hit standard extensions according to Avi’s Fibonacci Pinball method. And, as much as possible, the sub-waves of the primary count do as well.
Expresses its Elliott Wave tendencies throughout the fractal. For example, Ether has tended to deep 4ths. That behavior should show on multiple fractals within a count- both the long term and the short term.
I can honestly say that all my counts do not wholly meet these ideals. Rather, my counts came about from a ‘fib-first’ approach. This is to say I leaned on criteria 2, and manipulated 1, and 3, for my alternates.
I can also create long term counts until I am ‘blue in the face’, leaving us all with many options. One of my jobs is to cull what is in my head to the most probable.
Unique Challenge
Crypto suffers from imperfect data and that is compounded in Bitcoin. Bitcoin started life as play money between programmers. Eventually, it made its way onto half-ask exchanges before the masses started to trade it. The lowest price for Bitcoin that shows up in my data sets is $0.03, and most datasets start there as well. However, Bitcoin officially once traded at $0.003. While that is not a big difference in absolutes, it is demonstrable in log. In fact, when I use that price, I get far more direct fib hits, and a lot of the larger peaks and troughs make more sense. This is Alternate 2.
This data issue also causes questions as to what peak and trough are the primary 1-2. This is critical to a good count. And, I had to play with options in these counts.
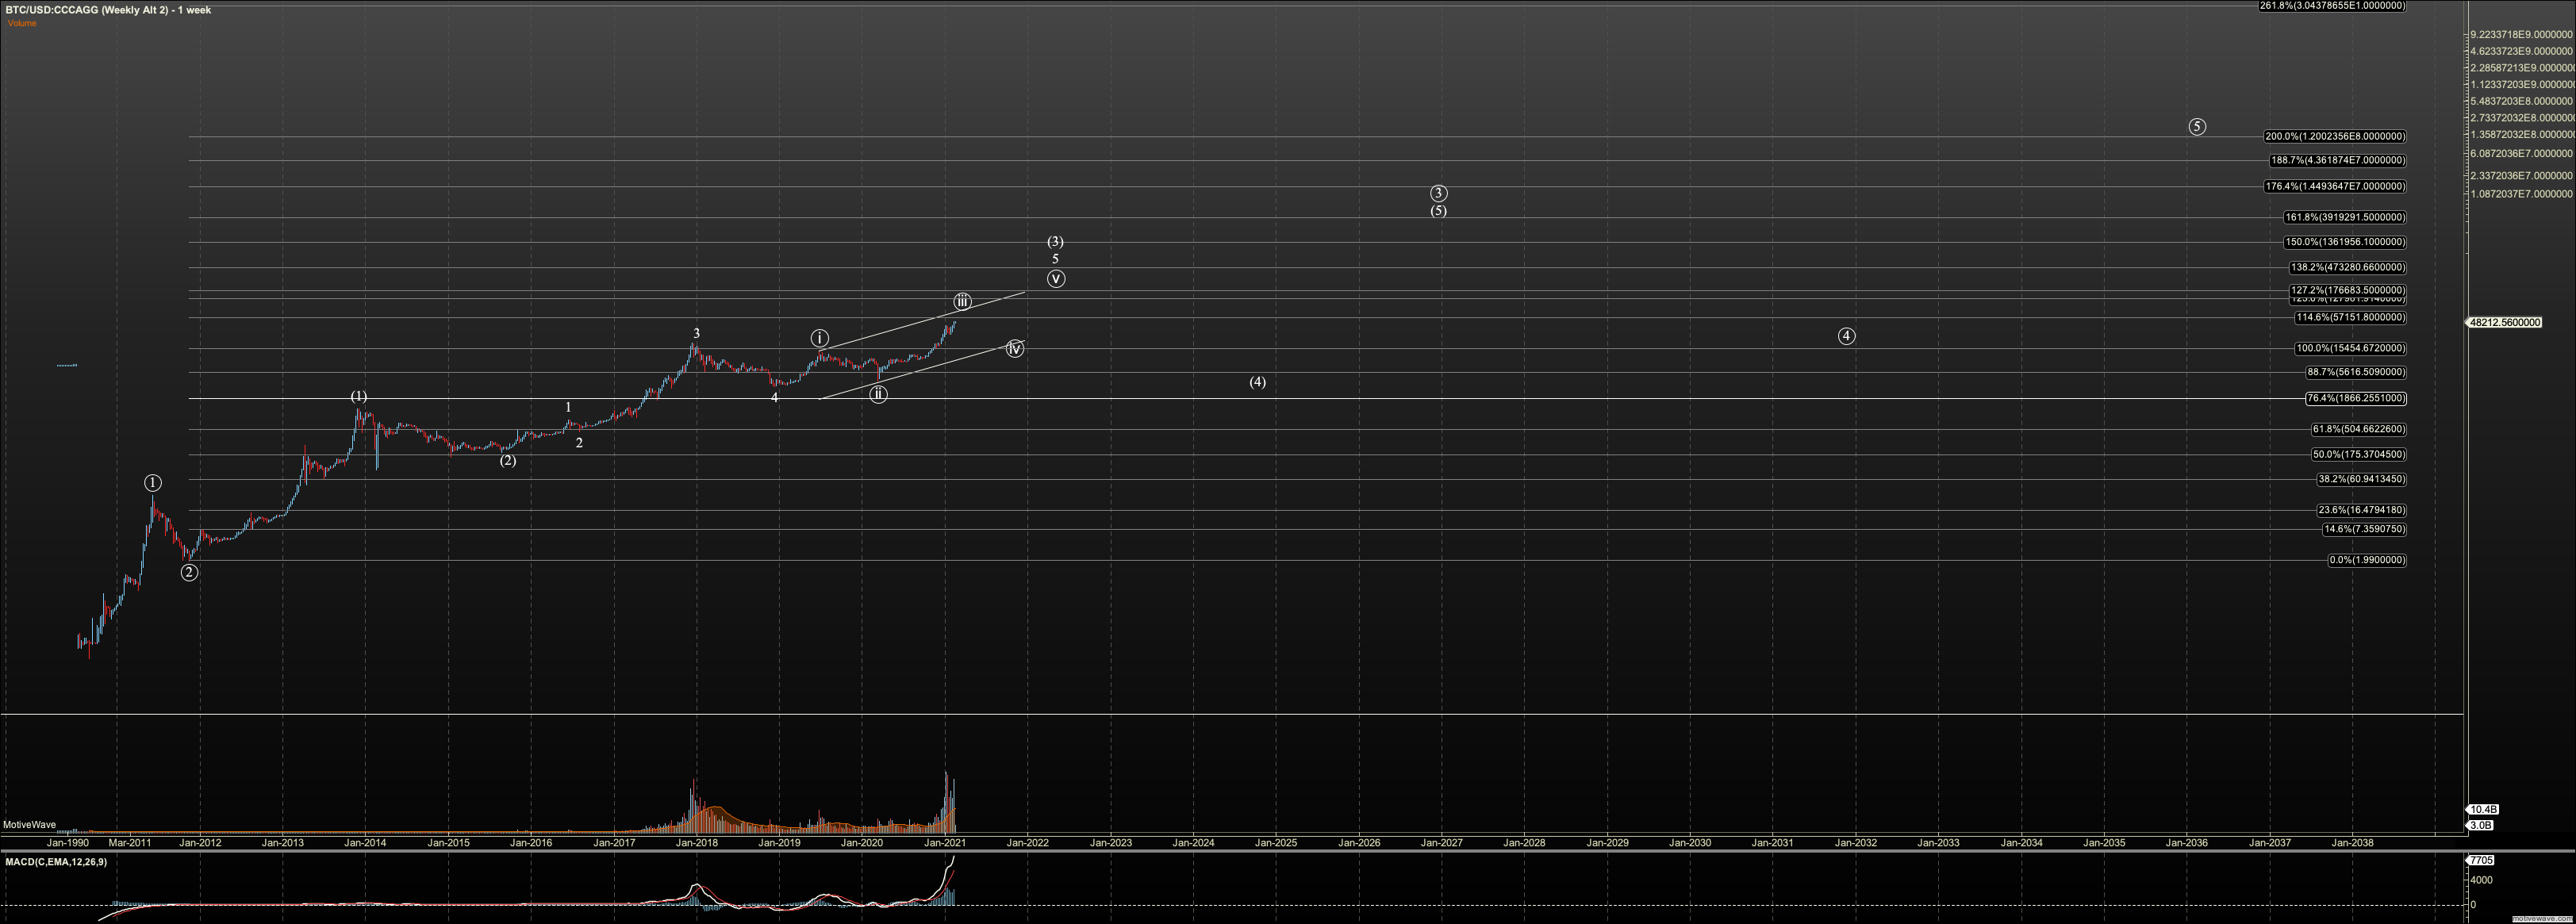
Alternate 1
The first alternate is what I show on the Sunday night reports. This count has also been my primary since 2017 with a few changes. In 2018 I considered $3000 an important level to hold in the 2018 bear and we held it by $100. This hold of support was a corroborating data point.
Looking forward, I count the rally off the 2018 low as the (5) of the primary third, and ideally, it reaches $150K to $175K. I view that region as a ‘magnet’ based on large degree fibs. However, it appears we’ll need to see several extensions in our current rally to get there. We may not know what level is likely until the middle of this year.
After $150K, a fresh bear market will ensue in Primary wave 4. Support for that wave, based on where I have primary wave 2 is $320. However, there is a tendency for the primary 4th not to go lower than the 4th of the third. That would mean it should hold $3000 and above.
I have previously shown the primary 5th hit $500K but honestly, if we hit $150K, I expect a larger rally. $500K was based on the $70K in 2021. I can make the argument for $3M plus. But we’ll need the daily chart to corroborate with a large 1-2 setup when we get there.
The negative in this count is visual, coupled with imperfect fib hits. Further, the 5th of third wave is improbably long. Honestly, those two weaknesses have me waiting for this count to invalidate, but so far it has helped us navigate the last four years of this market well.
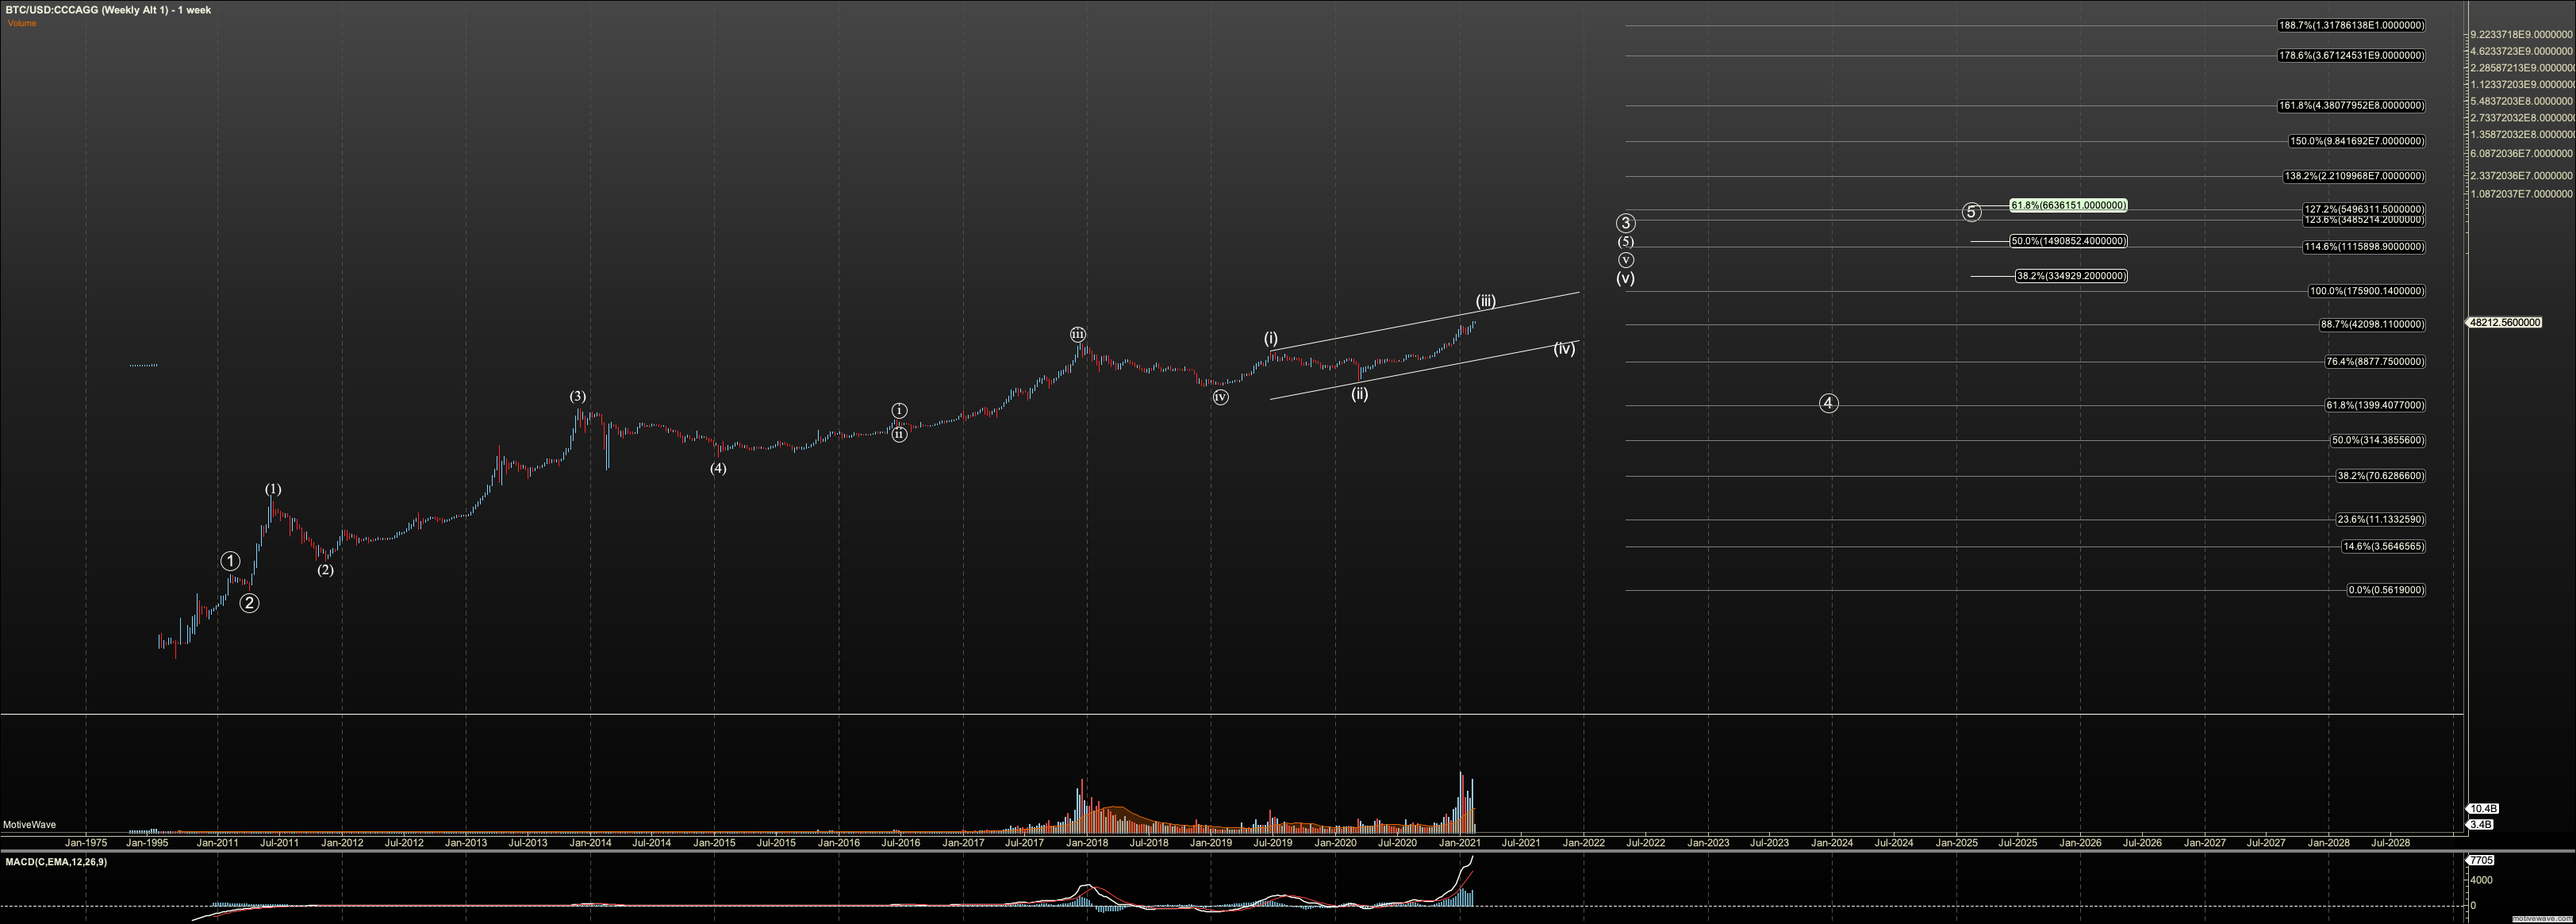
Alternate 2
Where Alternate 1 uses a starting price of $0.03, Alternate 2 uses the lowest published price of $0.003 and I change the location of the primary 1-2 to a peak later in 2011 vs. that of Alternate 1. This price and choice of 1-2. makes a big difference in fib hits, and I find very normal fib hits, according to Fibonacci Pinball standards. That is compelling.
In this count, we are working on finishing the third of the primary third, and the primary third itself would push to the $3M region. But note that I still expect a bear market after $150K. However, in this count, it is only the wave (4) of the primary third. Eventually, this count culminates in the fifth wave at $1,2B.
And, so there is the biggest issue with this count: The ultimate price is too far fetched. That said, if we were to see a monetary crisis in the US, where the US dollar starts to fail, perhaps this is possible? And, since the price growth rate of Bitcoin is slowing with each year, I doubt none of us are alive to see that price. Also, this count projects the potential of a large, perhaps decade long bear market in primary 4th. Does factoring in time and crisis make this count any more favorable? I am not sure. I’m just a sucker for nice fib hits.
In some regard this count is similar to Aternates 1 and 3 but with another bull and bear cycle 'tacked on' vs. Falling into a large wave 2 after all primary waves complete.
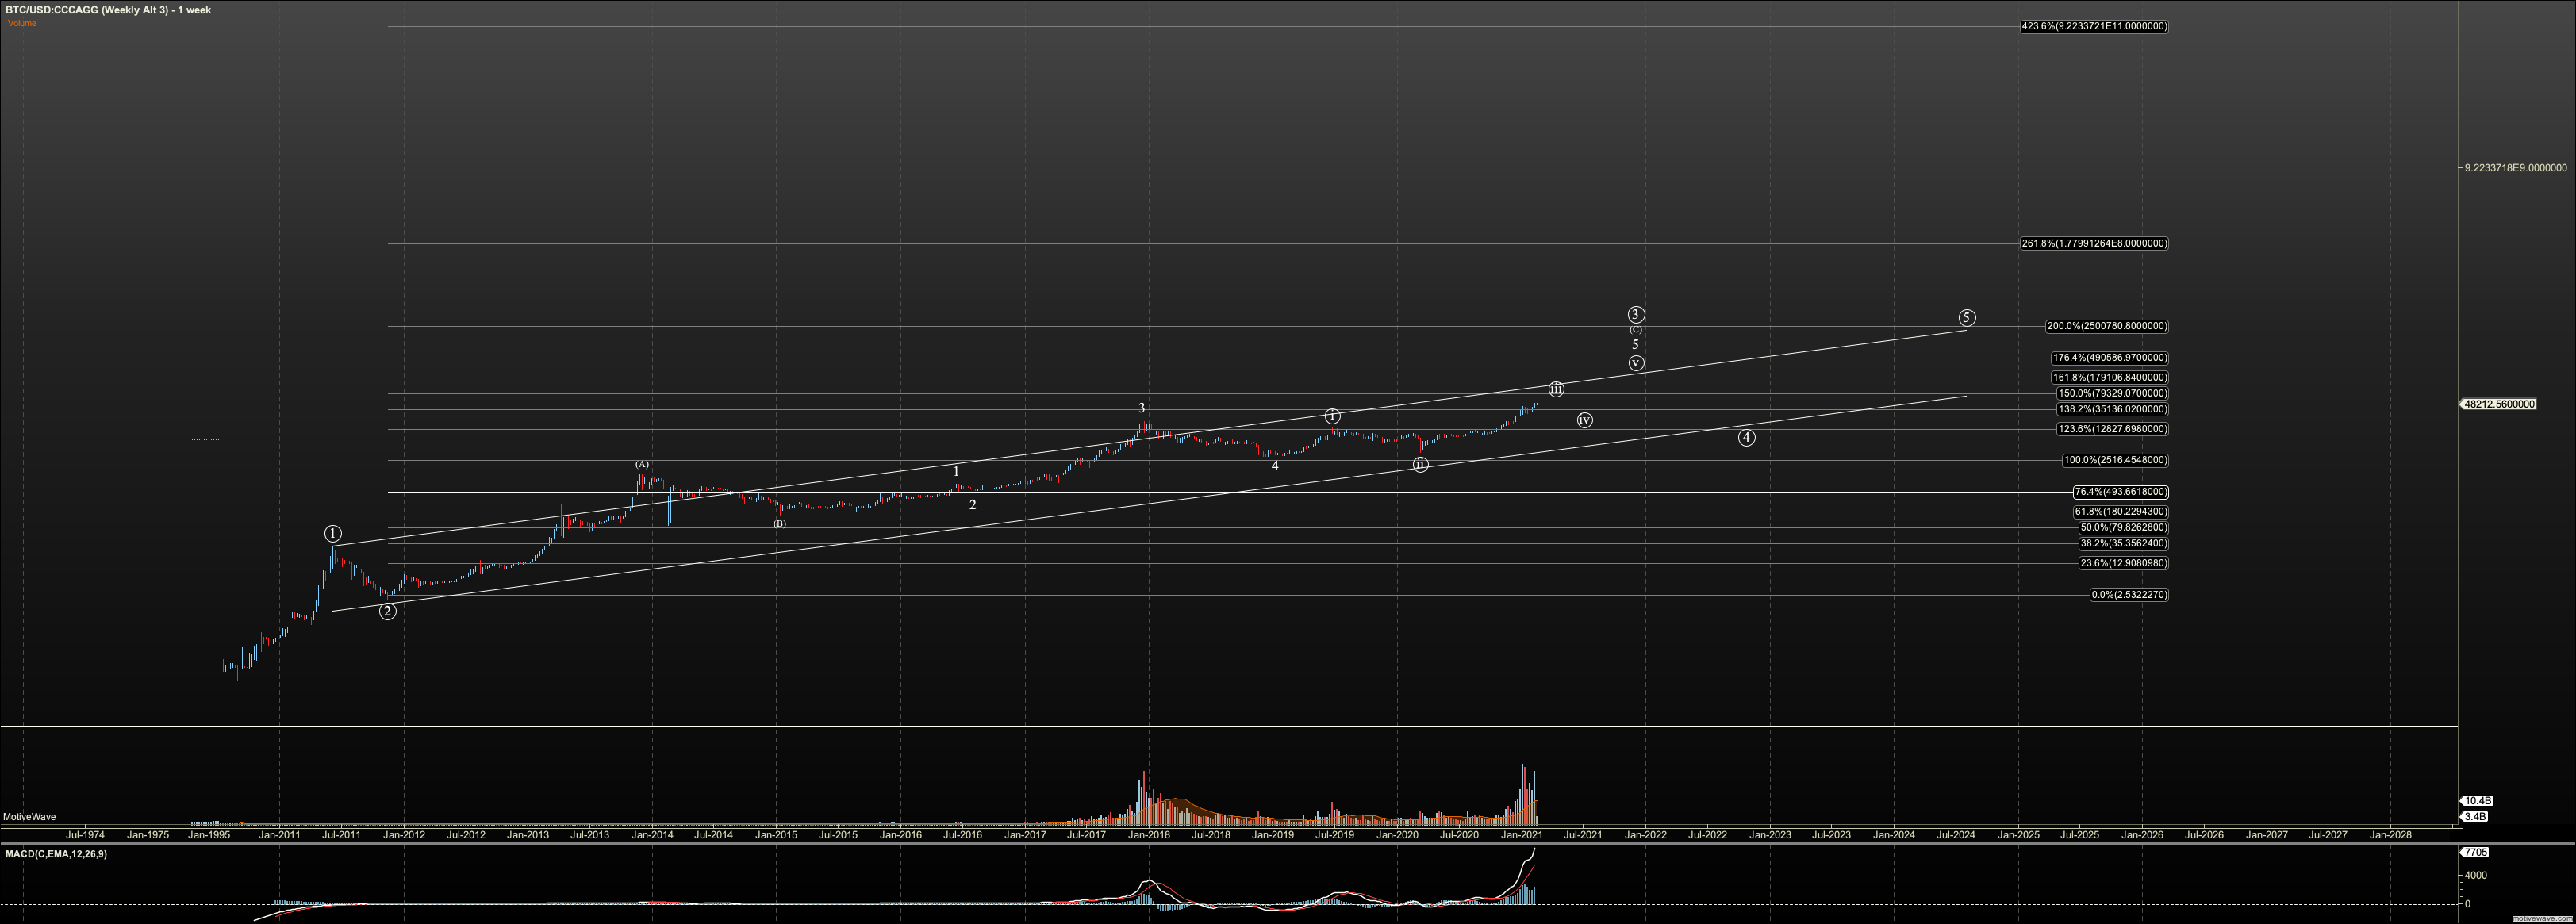
Alternate 3
In this count, I use $0.03 as the starting price, but the primary 1-2 of Alternate 2. However, due to the imperfect Fibonacci hits, this count expresses Bitcoin as a large diagonal vs. an impulse. From that standpoint, the Fibonacci hits are more in line. This count makes the fib structure and visual problems of Alternate 1 make sense.
In this count, we are in the last leg of the C of the third wave. The target does not change. The next key fib region is between $80K and $175K, and I assume we’ll push closer to the latter in this bull market.
And like all counts, there is a large bear market after $150-175K, this one in primary wave 4, like Alternate 1. Support for this one is the channel that should reside near $10-14K after the current bull market peaks. After primary wave 4, the primary fifth should come in a range between $500K and $2.5M.