Long Set Up Developing
With the market finally providing to us a sizeable pullback, we are now at the support region for both gold and silver. So, let’s start with silver.
As we can see on the 144-minute chart, price has come down to the top of the support box, and the MACD has now dropped down to the oversold region from which prior rallies have begun. So, this is a general buying signal.
The only question is whether the low for this c-wave of wave 4 is in place yet. But, with the decline yesterday really only counting best as a 3-wave drop, I cannot say with a high degree of confidence that it has completed. But, it is still a good point at which to begin layering into a long position if you so desire.
In the smaller degree structure presented on the 8-minute chart, as long as the high for today holds, we can see a lower low to complete a 5-wave c-wave and all of wave 4. However, if we continue higher without a lower low, then I am going to have to consider a b-wave triangle, as outlined in purple, which would push out the end of wave for into next week.
But, in either case, this looks to be a buying opportunity for the next rally which is pointing to at least the 84 region.
With that being said, PLEASE again review my update from last Friday and consider how much risk you want to take this late into the cycle. Moreover, please also listen to the live video I did today in which I discussed the potential for a double top of sorts in both gold and silver on the next rally.
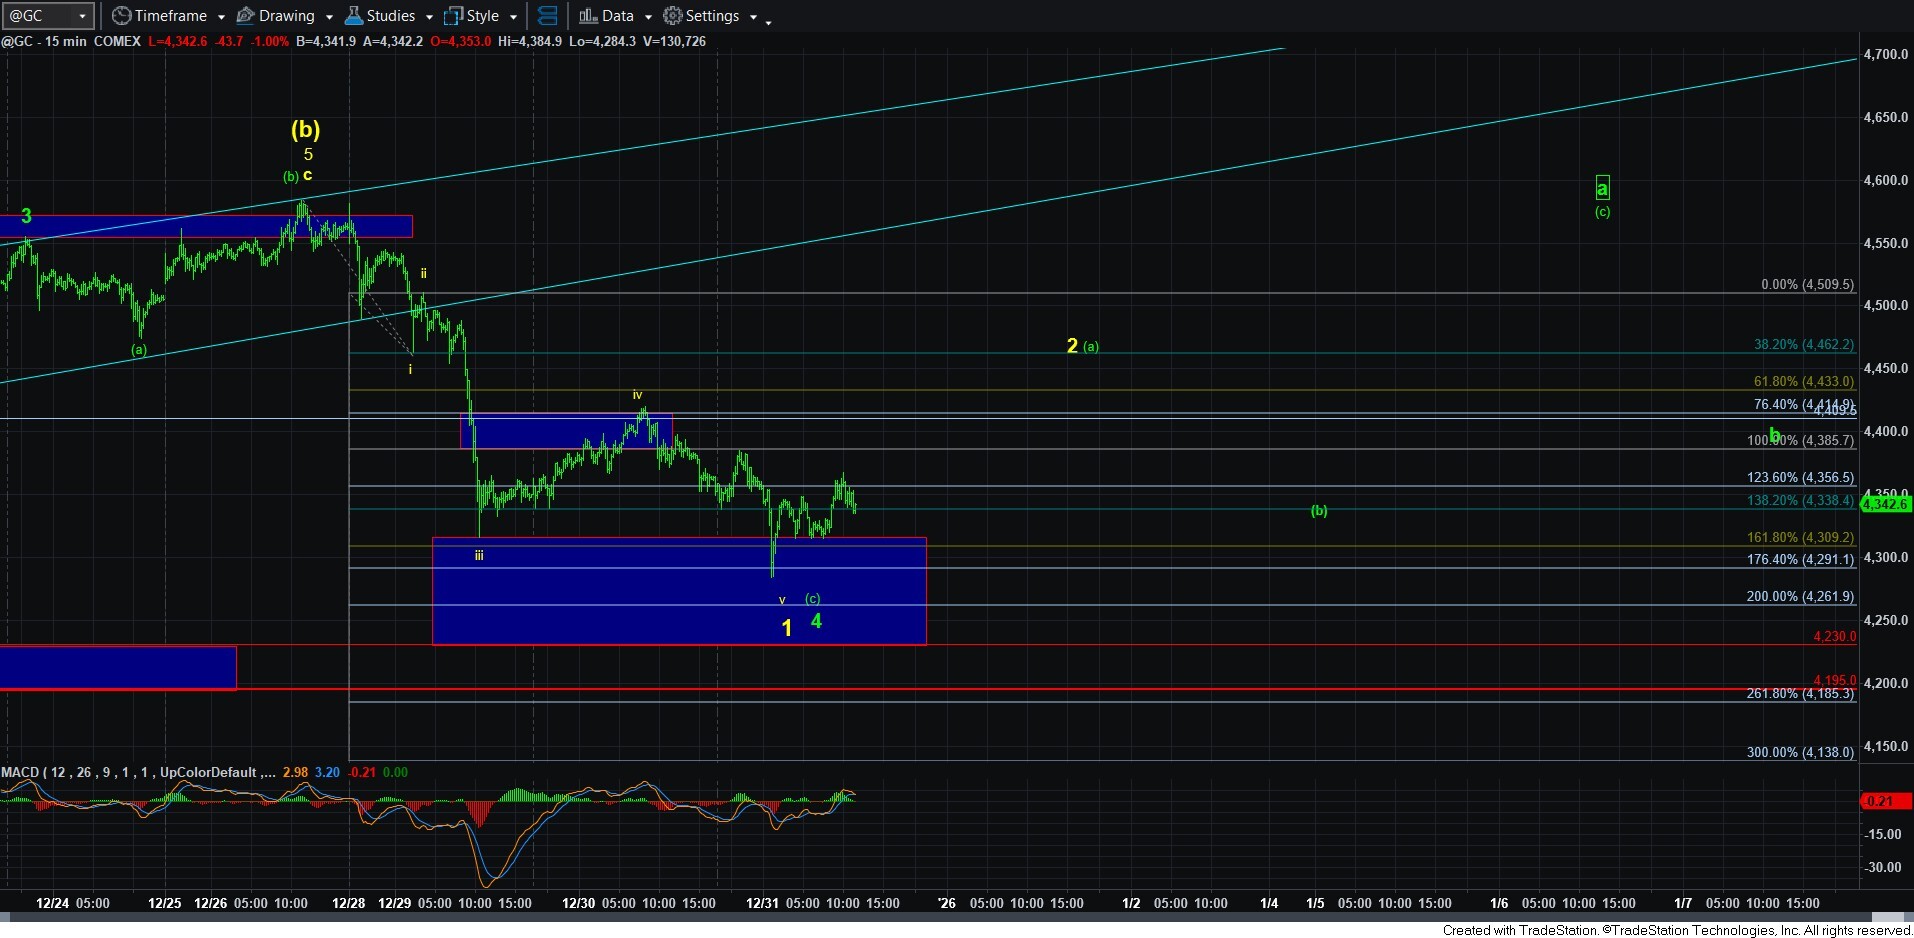
As far as gold is concerned, this still looks like a 4th wave in gold, as my primary count. Please take note of the adjusted wave count in green on the 15-minute chart to see how this would apply to the current 5-wave decline. Yet, with this 5-wave decline, it does add a new wrinkle to the gold chart, as there is a higher probability now that we could get that (c) wave decline towards the 3800-4000 region.
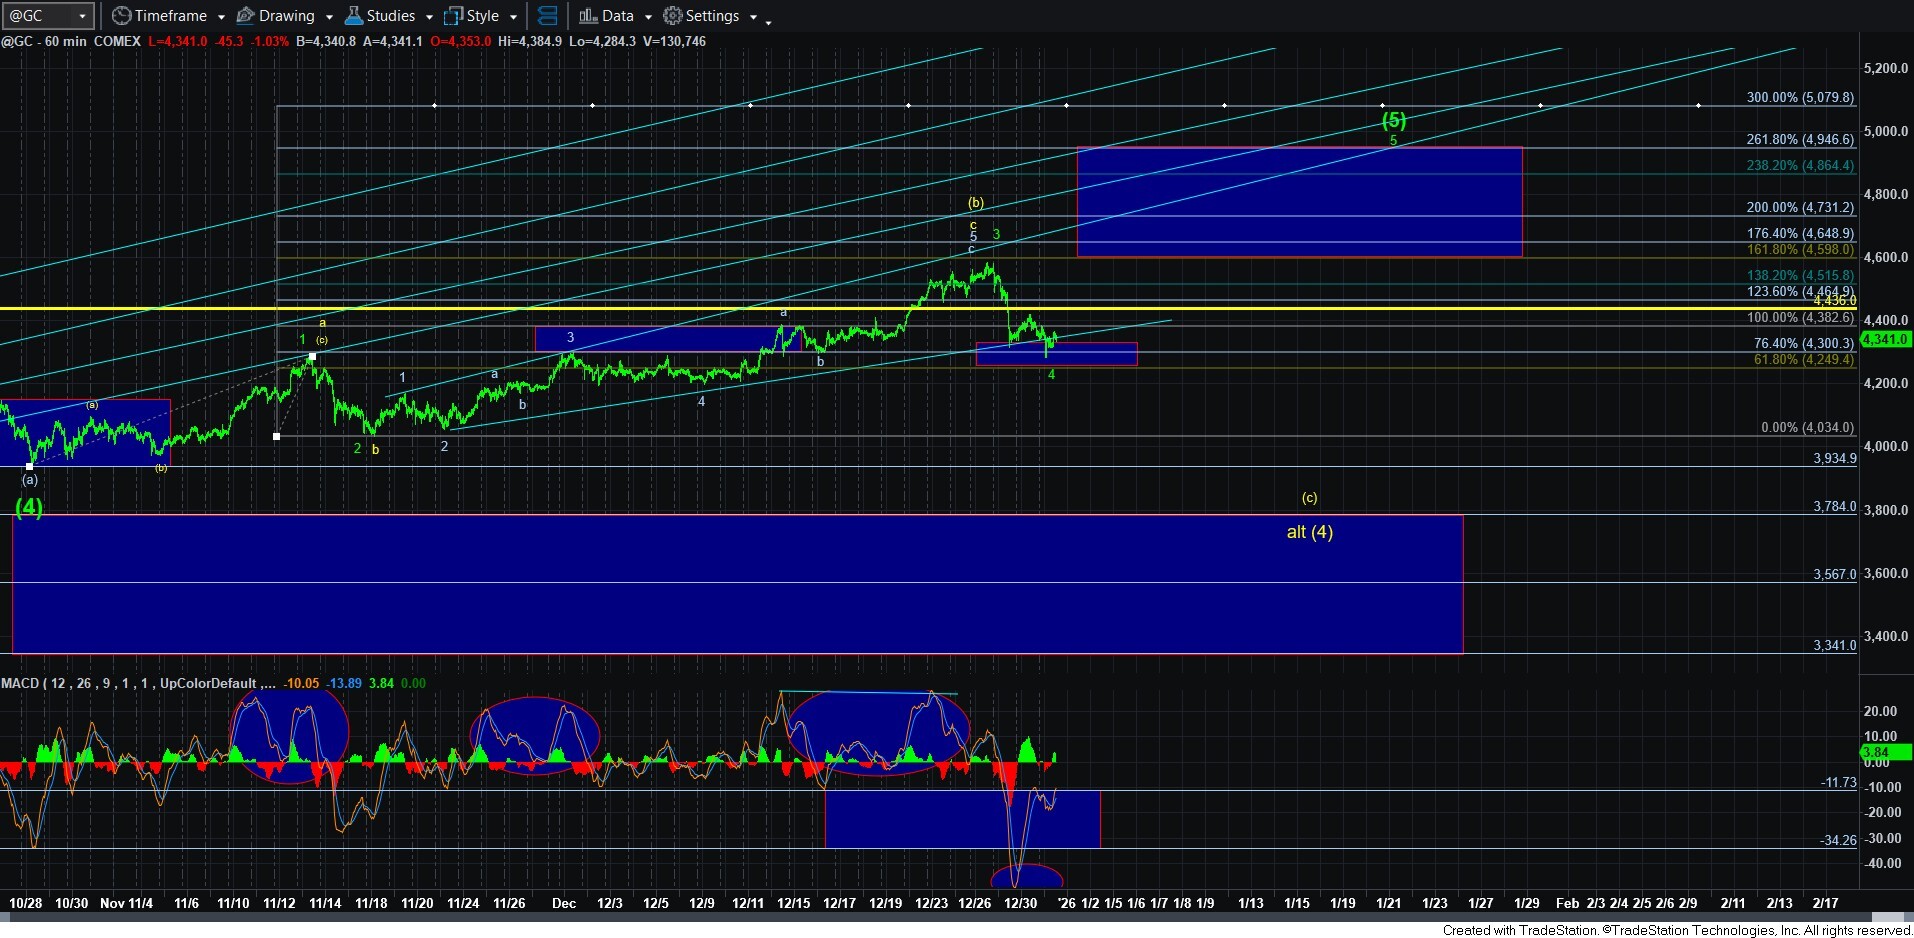
As I also explained in depth in the live video today, the nature of the next bounce in gold will likely be the same for the (a) wave in green as the wave 2 in yellow, since 2nd waves are corrective a-b-c structures, and a-waves are also most commonly a-b-c structures. Therefore, the only way to distinguish between the two will be the nature of the decline after the a-b-c rally completes. Is that decline is impulsive, and we then take out the low we create in this decline, then the yellow count will likely be applicable and pointing us towards the 3800-4000 region. And, of course, if the decline is corrective, then it likely points us towards the box overhead on the 60-minute GC chart.
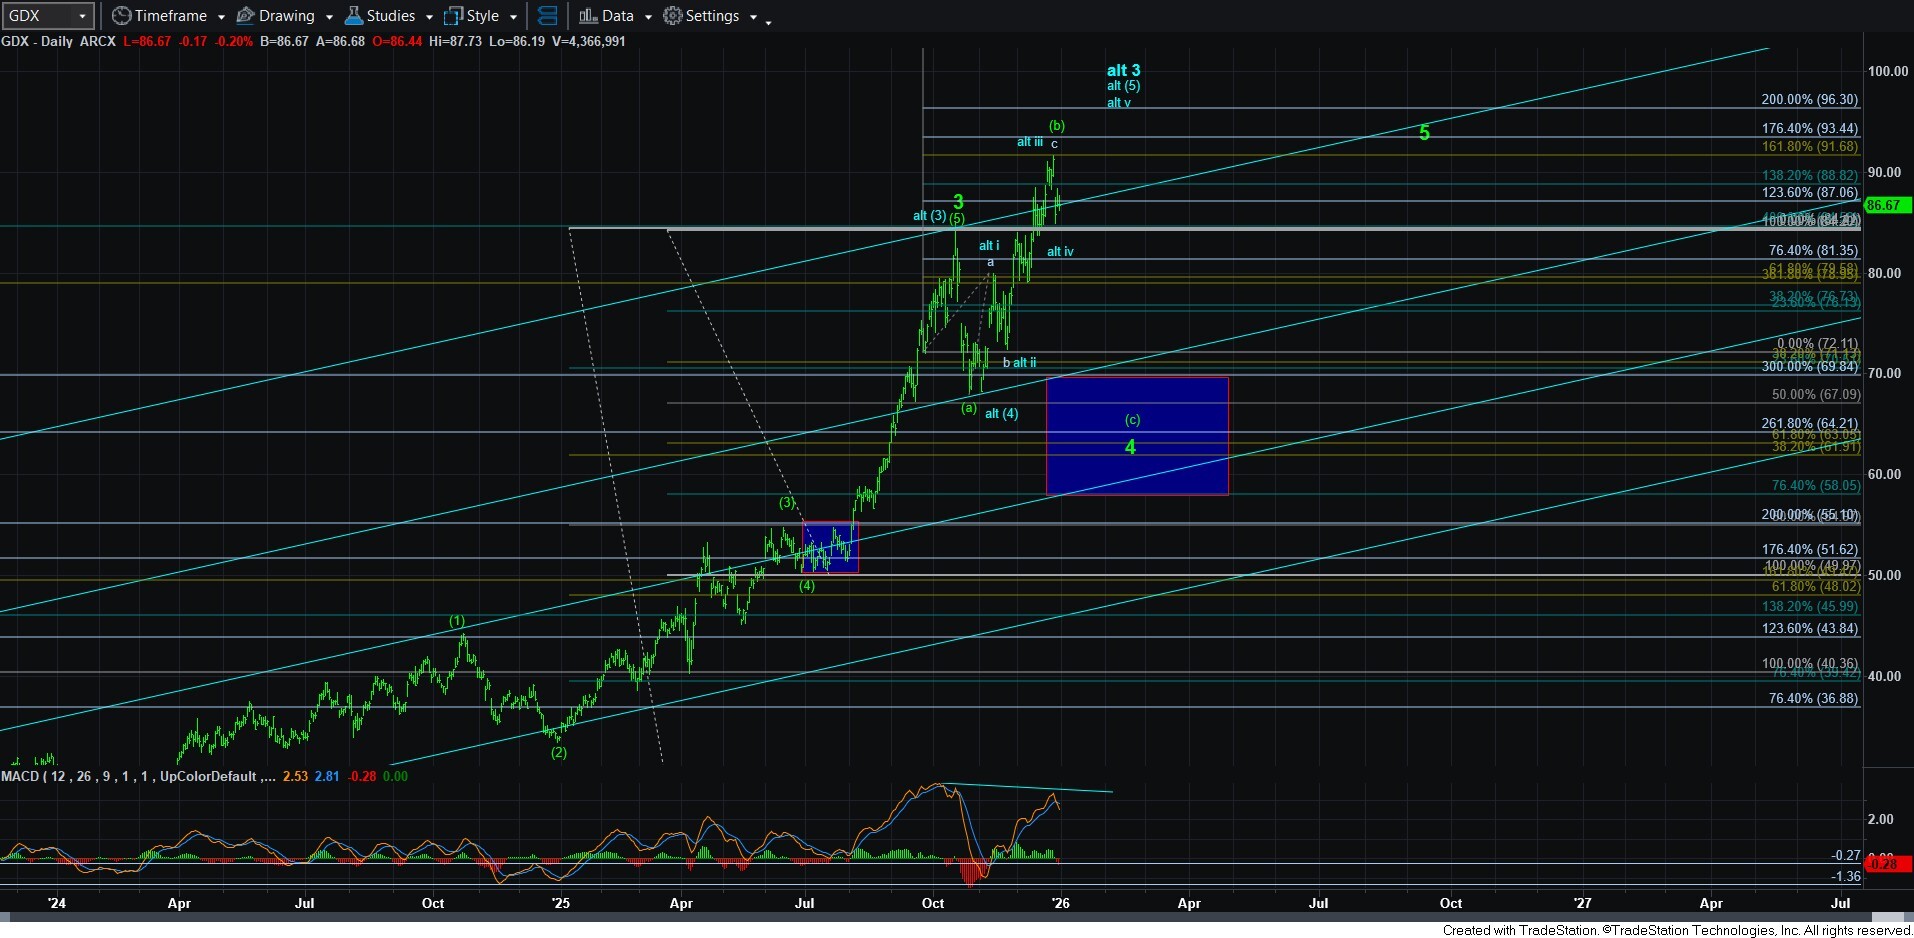
GDX is still a bigger issue to me. If it takes the same path as the yellow count in gold then we get our bigger c-wave down and a huge buying opportunity. However, if we continue higher in the coming weeks in a more direct fashion, then the ending diagonal in blue will be applicable and I will then be adding an alternative count representing the TOP to the GDX. And, that is why I noted I will likely sell most if not all my mining stocks holding should we go more directly higher.
I want to again take this opportunity to offer my wish to you and your families for a very happy, healthy and prosperous new year.