Light At the End of the Tunnel?
 By
Ryan Wilday
By
Ryan Wilday
Important Message for Long Term Traders: Now that we are in our potential intermediate bottom zone, for a potential run to 6 figures, and most likely at least $25K in the alt count on Bitcoin, you'll want to pay attention to short term action, if not start to tranche in for the run. Barring further surprise breakdowns, the train should be leaving the station very soon. Note that risk to reward will not be at its tightest until we see a solid five wave impulse through resistance which will be noted in the numbers for short term perspective.
Note as well, I have added the 'Tracking Pivots' I posted on the main board today so you are aware of how I am navigating the alt red count in Bitcoin. Once we have the bottom in, this material will be the bulk of the 'Intermediate Term' writeup below:
Short Term
We have long awaited this zone, have we not? We certainly saw signs of capitulation in this market with high volume selling, and deep cuts in technical readings. But this area was fully expected, and so if we played our cards right are ready to buy.
1. Repeat from last night, and still important:
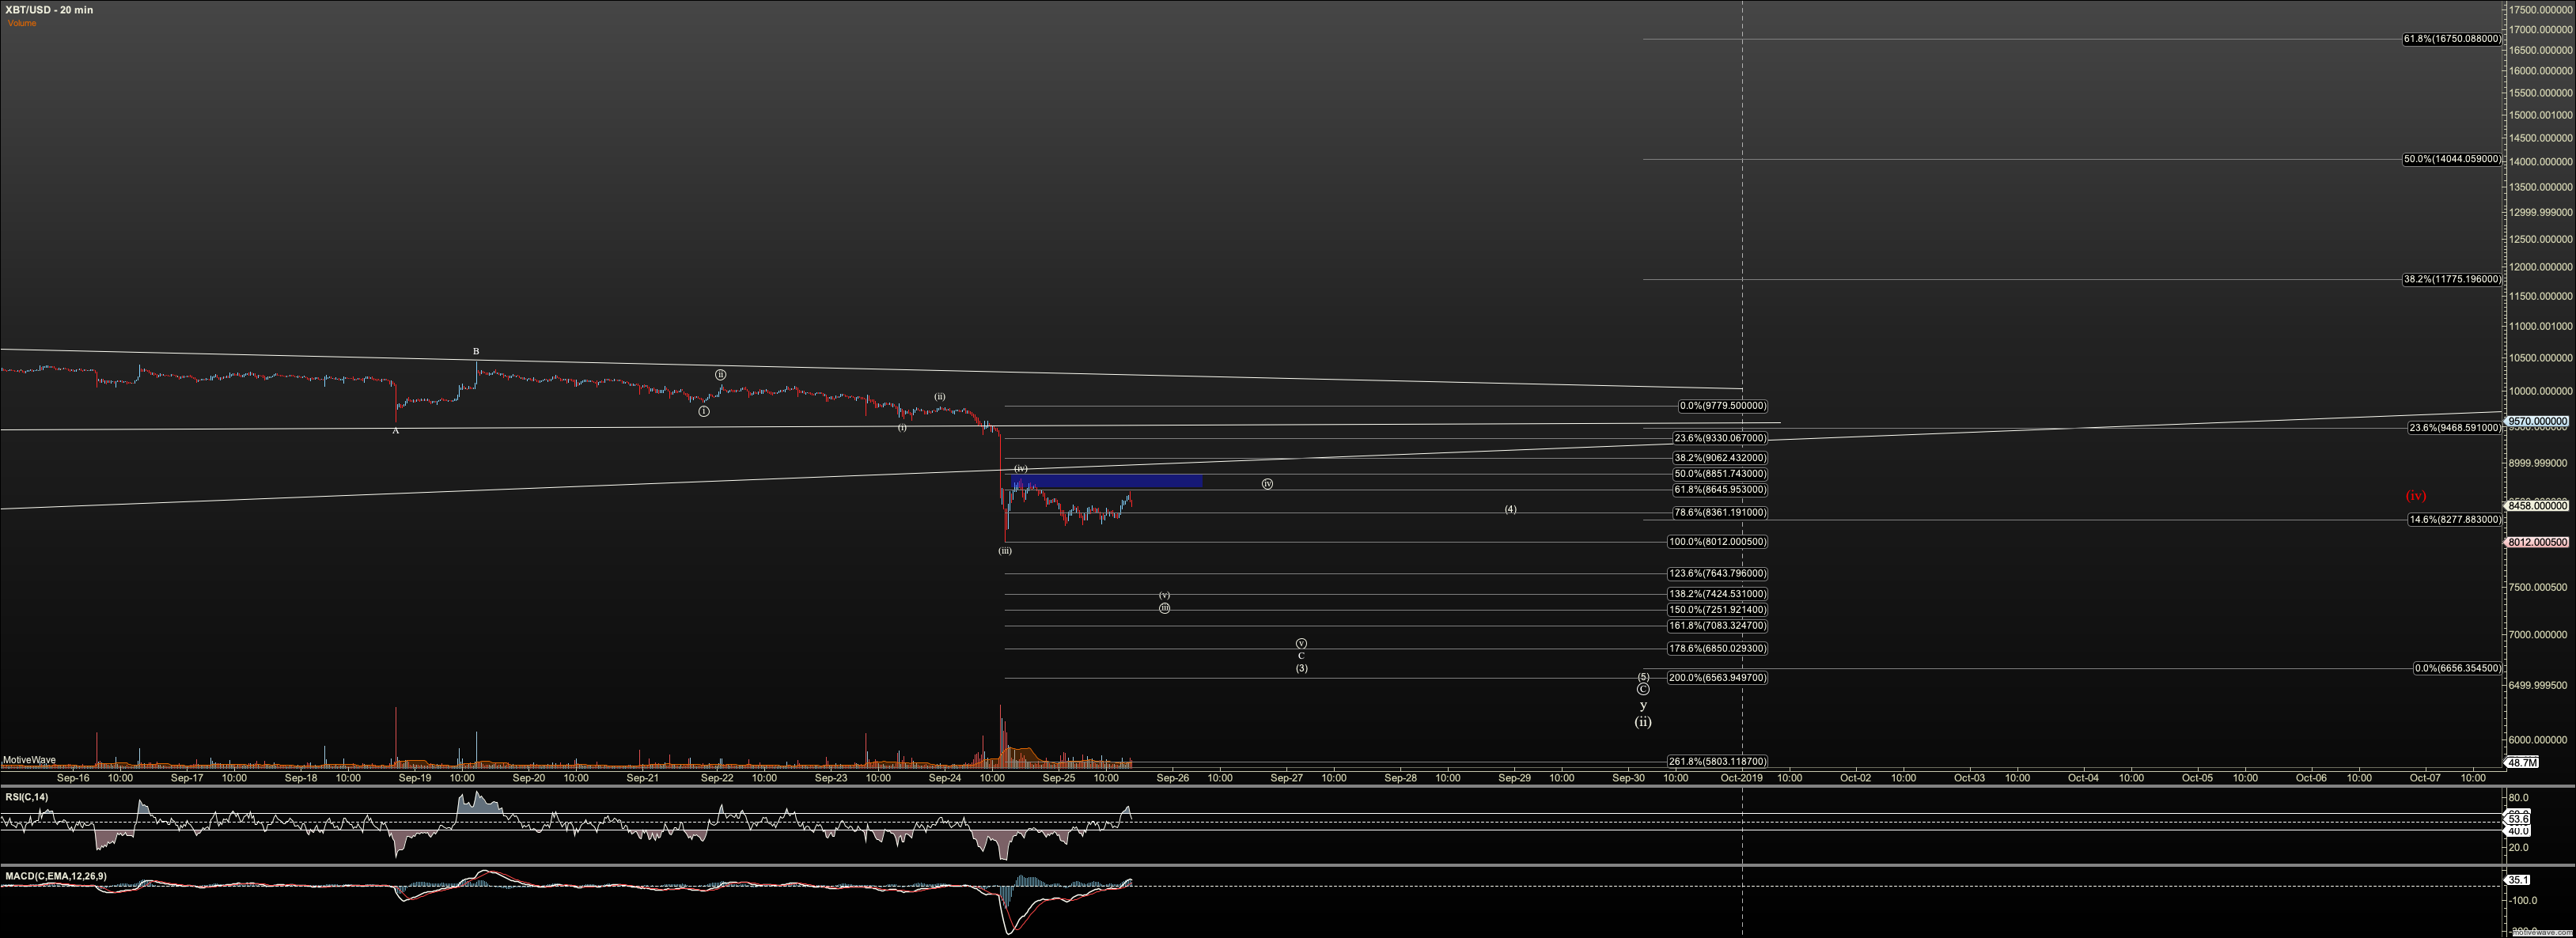
Note for the Bitcoin chart, we started this move down in very messy fashion. I can count sever 1-2's. Because every 2, needs a wave 4, I then have several 4's still to bottom. That said, we have a very heavy flush, and sometimes, we just need one more nominal low to finish it off which is likely what we'll see in the Ether chart, as its move down is more simple. So, let's keep Bitcoin simple. An impulse over $9000 suggests a bottom is in. Below that, pressure is down. I'll move that resistance level with the market if we head lower.
I like $7800 for a bottom at the moment.
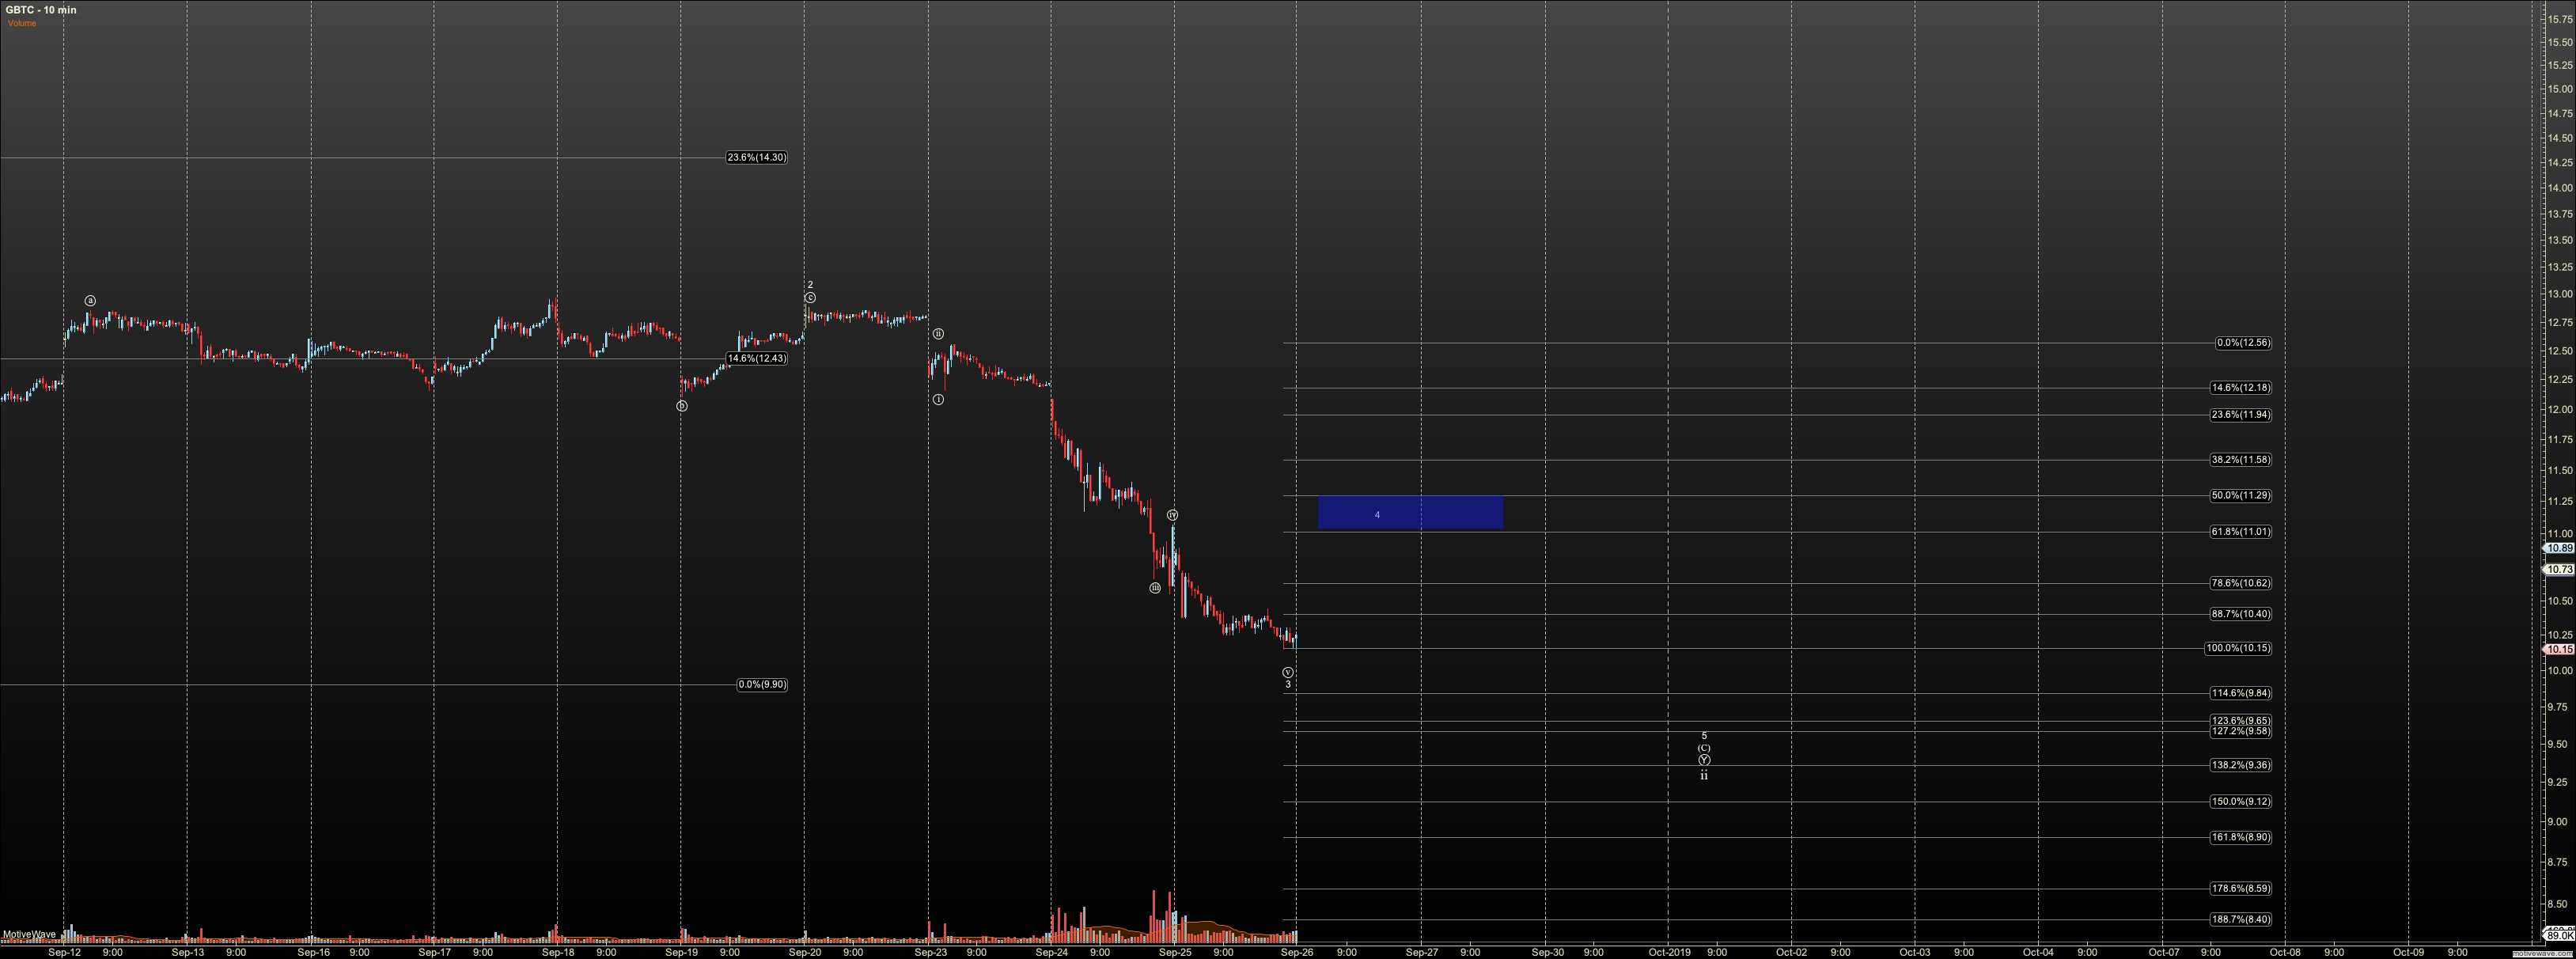
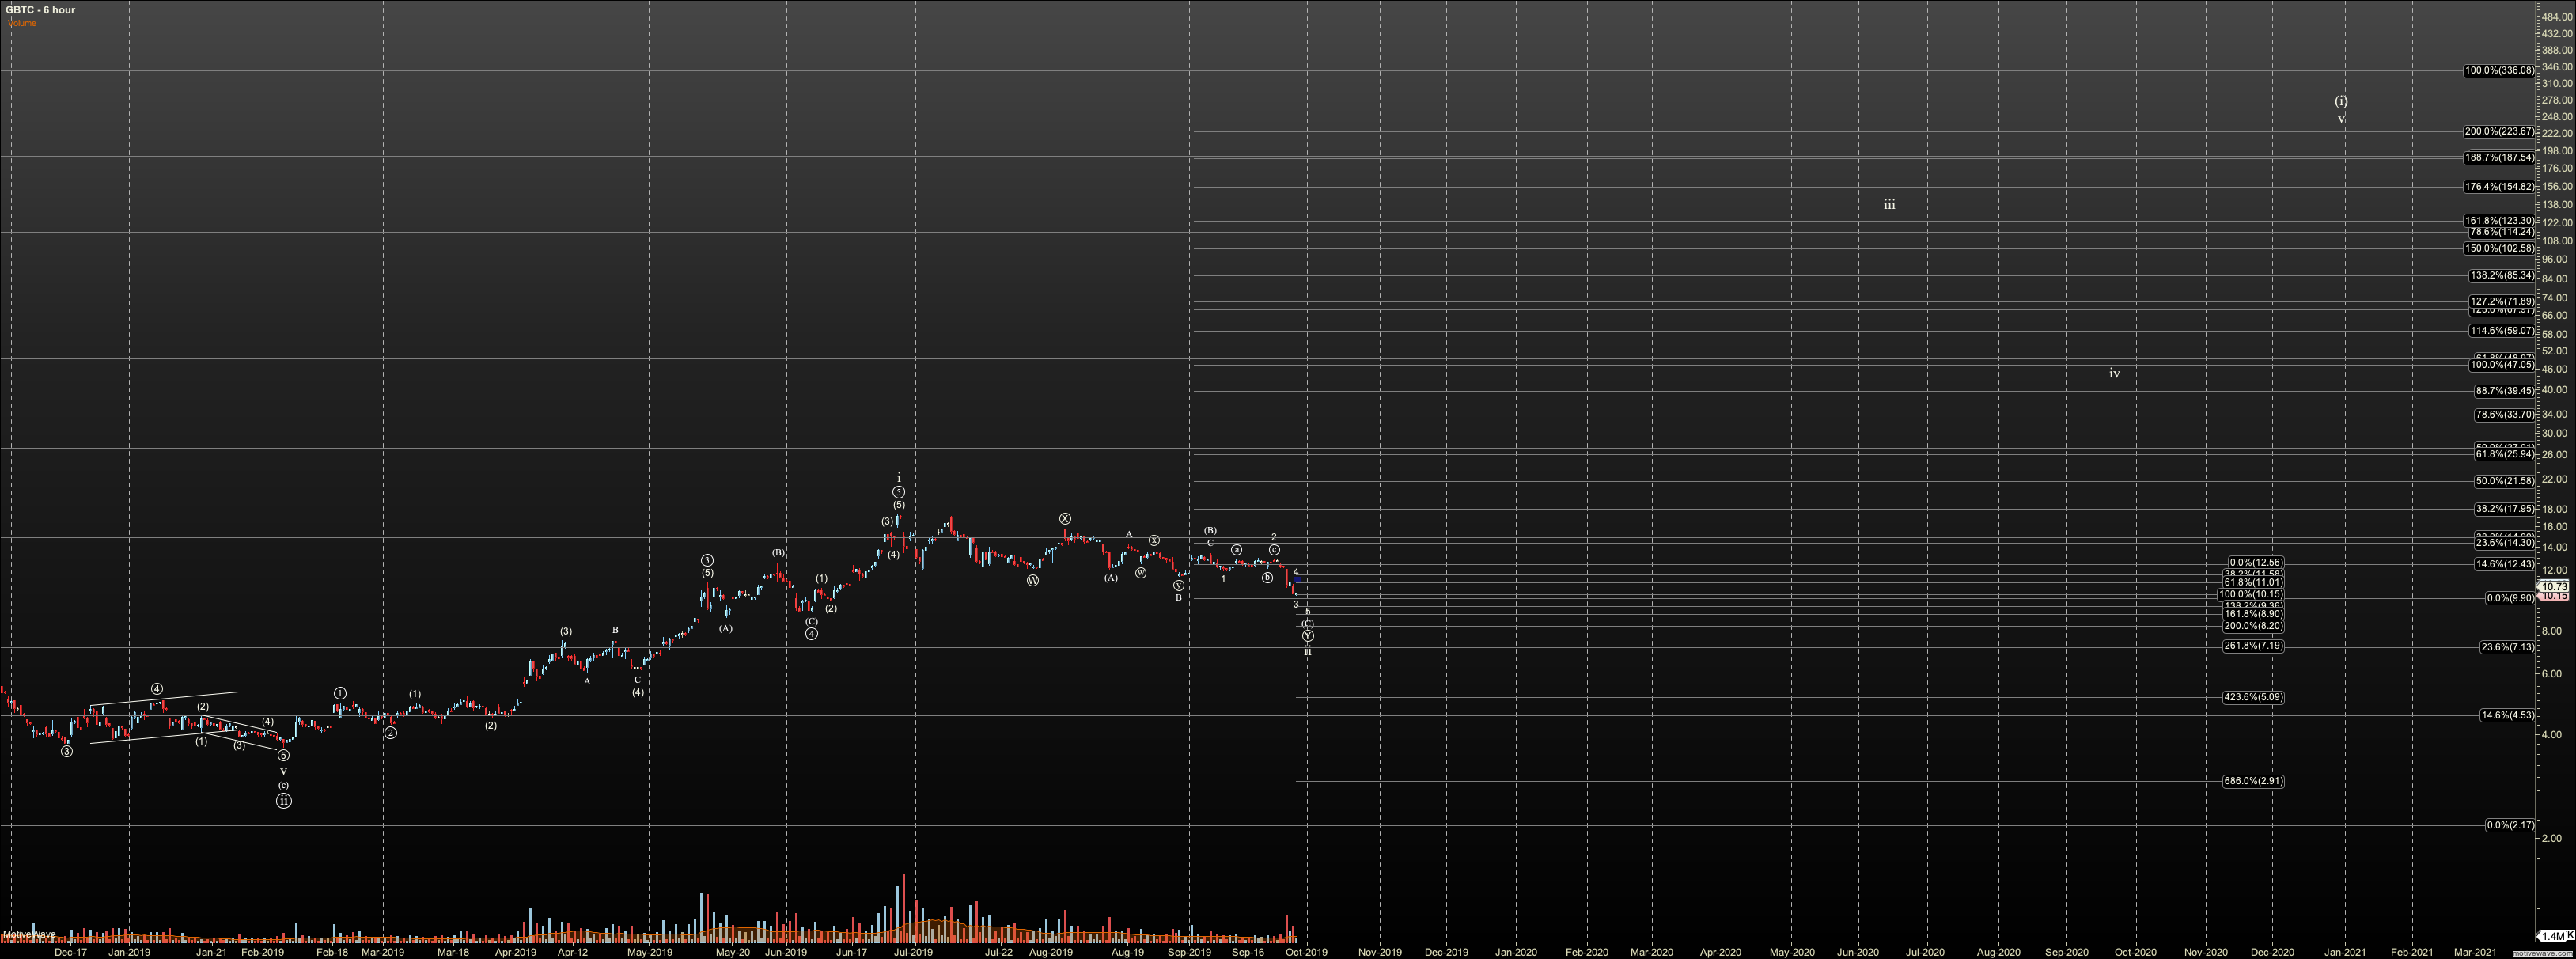
2. GBTC is in the vicinity where the third should be complete, but we need to see that wave iv bounce. $11.29 now suggests a bottom is in if impulsive, and I now see a bottom closer to the $9.90-$9.63 region after the drift lower today.
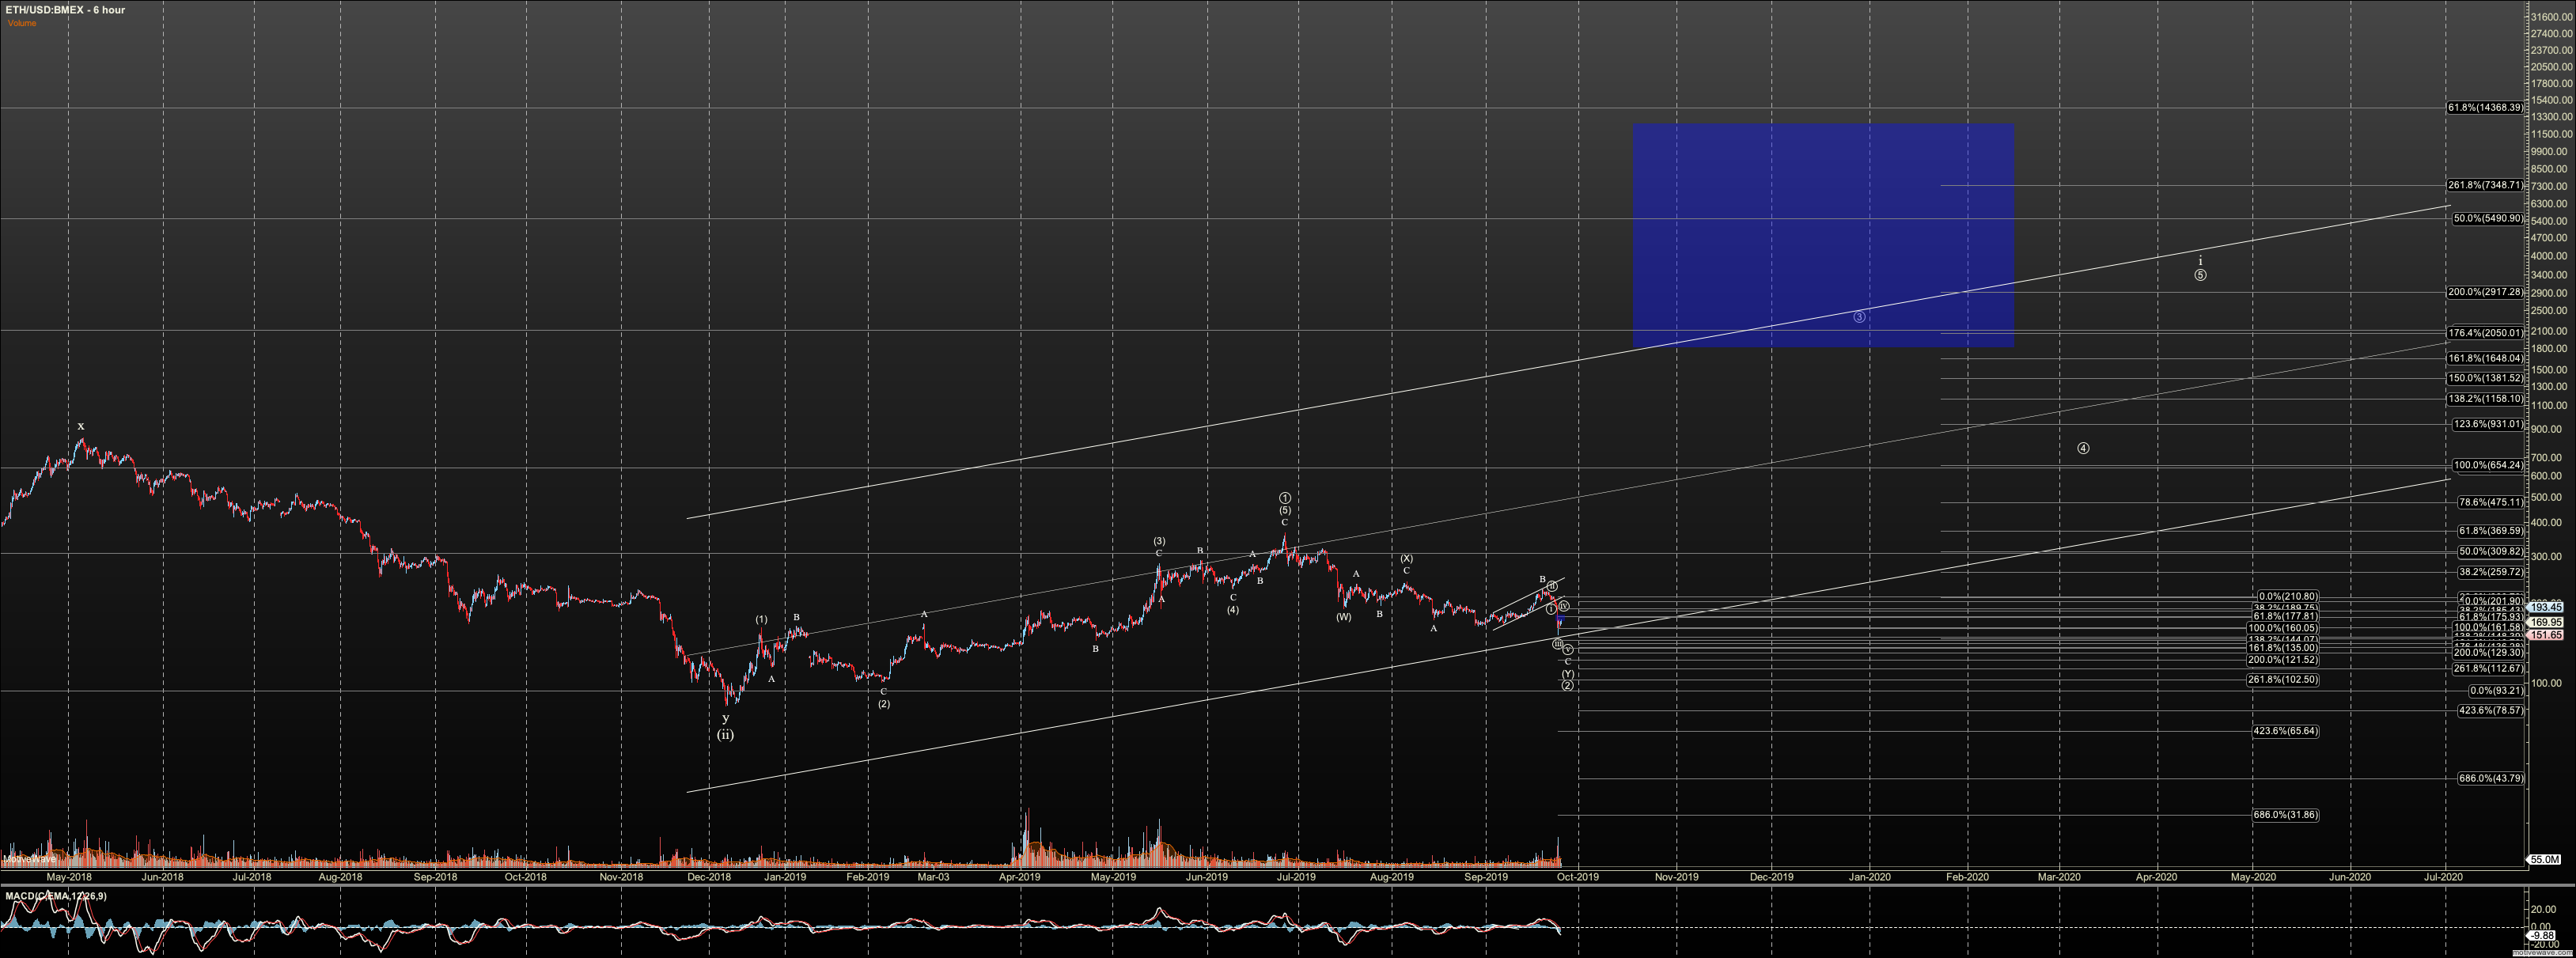
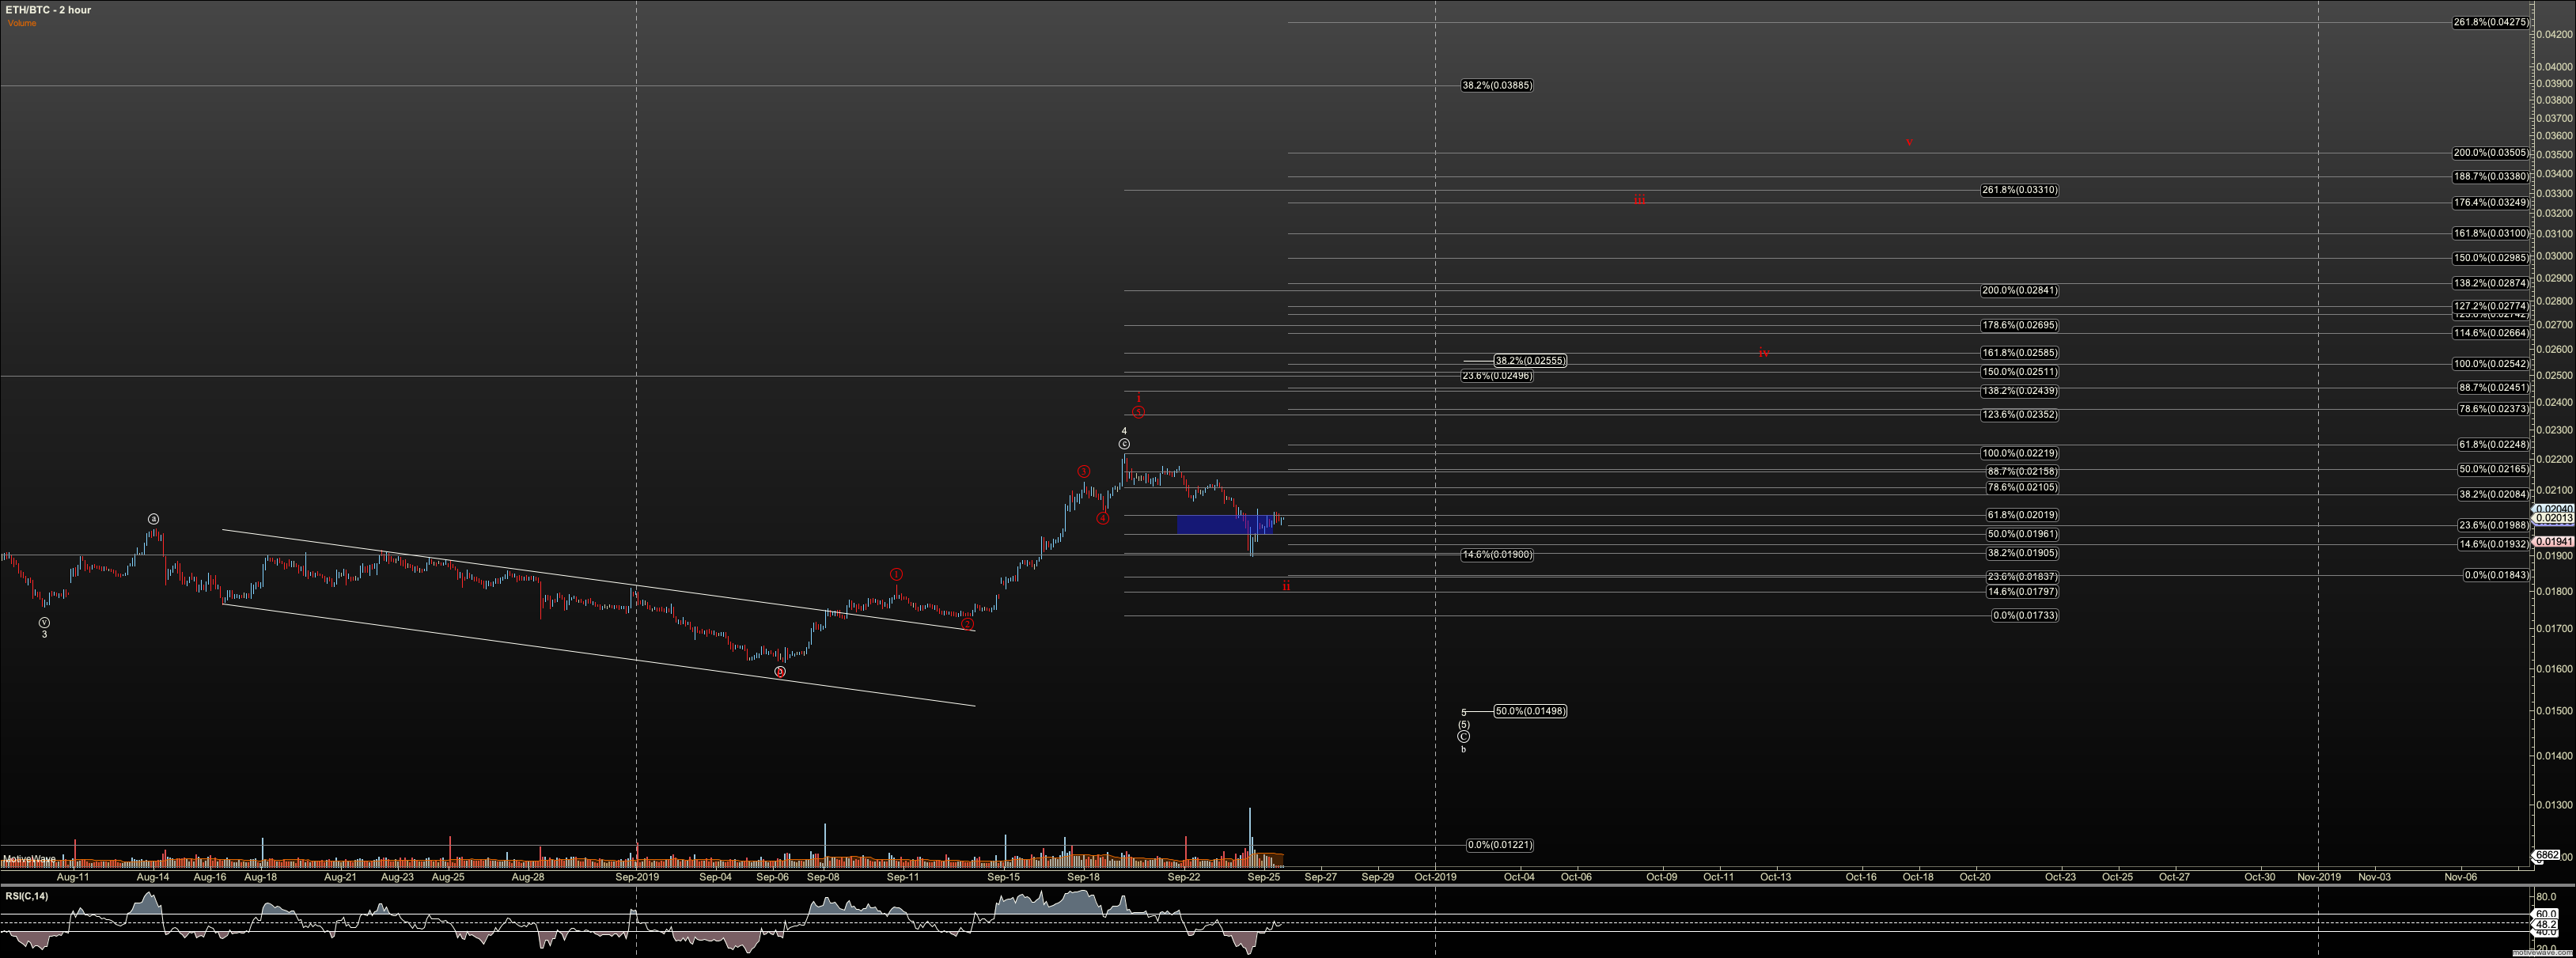
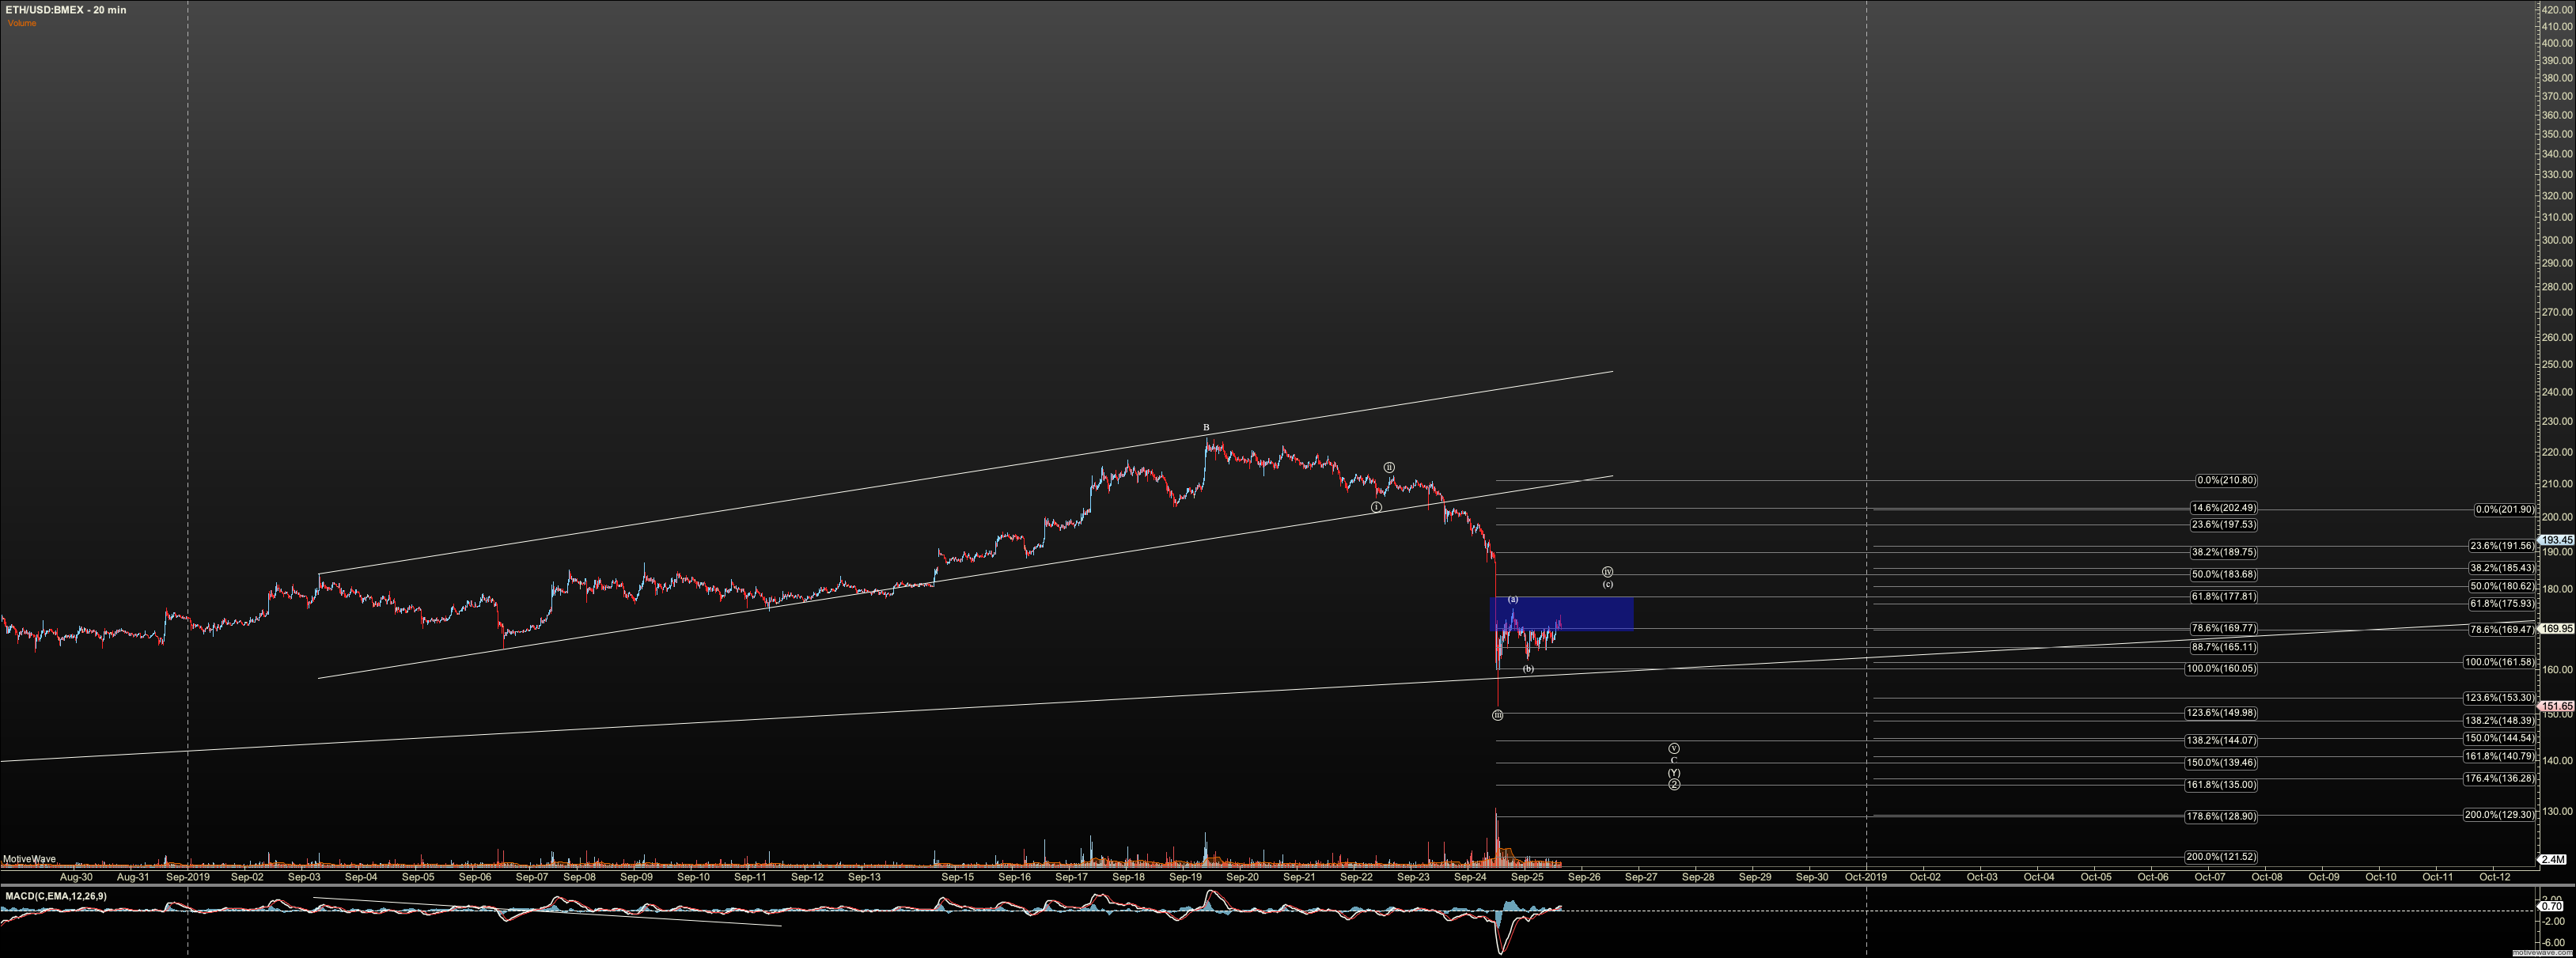
3. Ether should see one more low, and an impulse over $177 suggests a bottom is in. We have no real change here after today's action.
I like $145 for a bottom.
4. ETHBTC: I added the alt red count. I say alt but this one has a real chance. It's only issue is that it is based on an impulse with a very tiny wave 4, and a truncated 5th. That makes it less likely, but the extension suggests it is possible.
NOW..please note that I do not ring the bell at the bottom. My process is simple. Once we have an impulse, I move from tracking resistance to support. Support is our 'risk against' level for a tight stop. This makes consternation over whether a bottom is in not needed. It makes the market an exercise in math, boring ol' math. Follow the math and emotion is not needed. If you need me to revisit this, please ask, but this is covered in 'Using Elliott Wave' on my Youtube channel. Now is a good time to refresh if feeling rusty.
Bitcoin Intermediate Term (No Change Today)
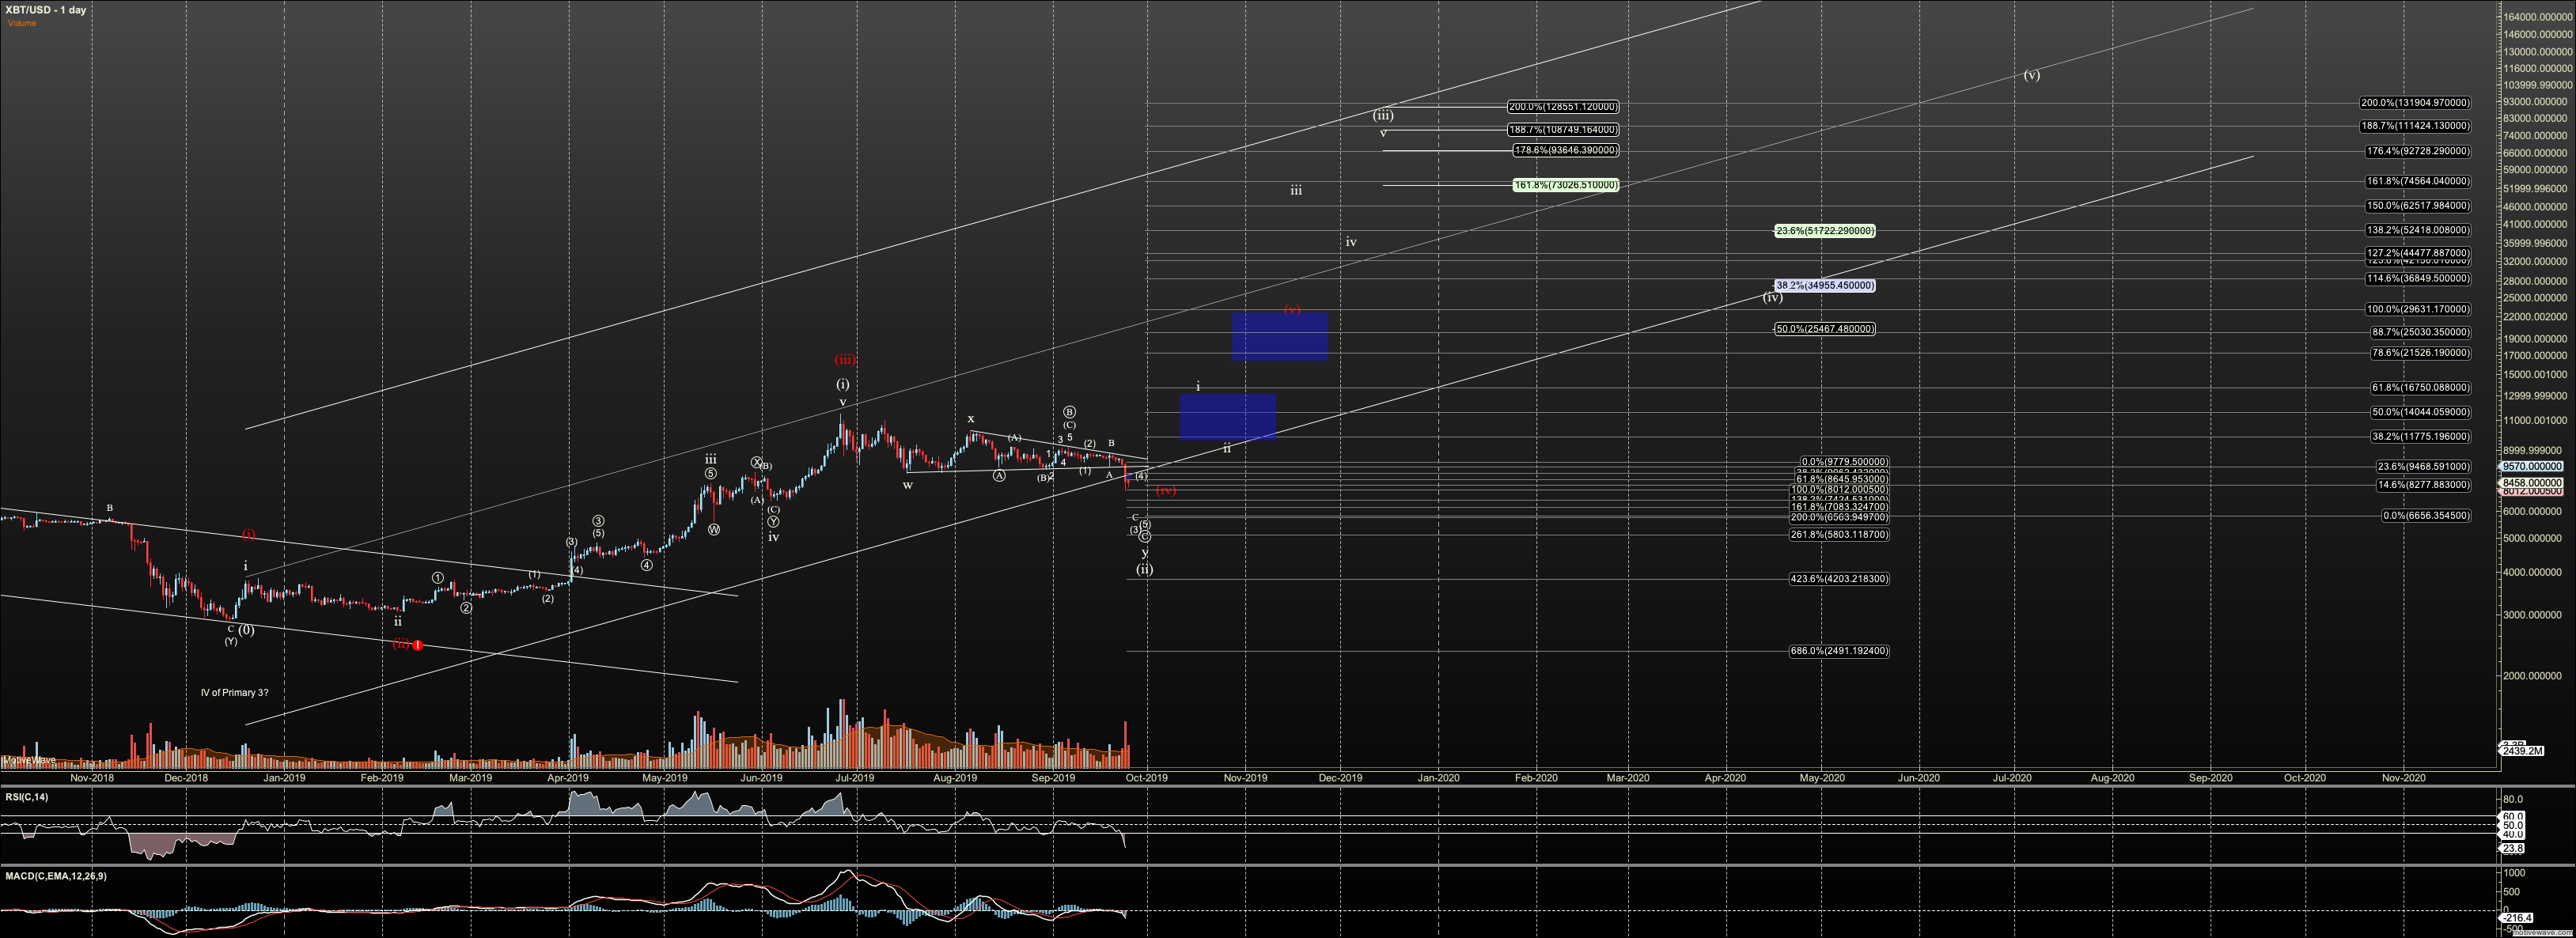
Regarding intermediate term, Bitcoin put in a strong bottom at $3120 which aligns with the long term support for my primary count, at $3000. Holding there suggests good probability that we see a run to $65,000 - $225,000. The current correction we find ourselves, is primarily viewed as a wave two correction, which has support at $4300. We may never see that low, and the current leg of this correction targets $8,400 to $7,800. If we see an impulsive rally in that zone, though this is considered a shallow wave two, I will look forward to a completing a larger degree pattern potentially to between $129,000 and $160,000. By this we see how the smaller pattern refines targets for larger pattern.
The alternate intermediate view is that this is merely a wave four. In that view, the next wave, to the $20K’s may terminate the 2019 bull with a nominal new. Although, it is remotely possible we hold for a higher degree which will be discussed when important.
ADDENDUM to Bitcoin based on 'Tracking Pivots' Post
The first question on this chart is whether we have red wave 4, or white wave 2. White indicates primary but I am not going to stop watching red until invalid.
The first question is where this correction lands. Red 4 is not invalid until $6800 is taken out here, however it declines in probability if we break $8080 here. However, I'll still track red 4 if we see the latter come to play, until certainty shows.
The next question is where our fractal moves. If we are in red wave 5, and bottom near where we expect, we should see a five wave rally to between $20-27K, with the lower end more typical.
If we have white count, I expect a five wave rally to be limited to $16K in the first wave of three. So not completing fives under $16K is the first warning of red count. Next in white the bull back in the second wave of three, should setup and blow through $27K very quickly as the third of the third is typically the 'fast FOMO' wave. We should move from $16K to $60K fairly quickly.
Note that timeframes is not a given. I am putting labels in a very aggressive timeframe but that may not be what we see. What is important is these price pivots and how price interacts with them.
Ethereum Intermediate Term (No Change Today)
Ethereum did not hold my ideal long term perspective by $10 in the 2018 bear as it fell below $81, suggesting that the low was a wave 2, and not the wave 4 which was primary. This creates some questions about its future as well. Further, it opens the door to a much deeper wave 2 to $40.
For the 2019 rally, there is some question whether we have a five wave move. If so, it is a diagonal. $113 is the litmus test. Below $113 and risk is on that we see $40 . Currently the local correction which, if wave two of the larger wave 1 of our third wave, targets the $145 region. If we bottom there, the fifth wave suggests we hit the $3000 region before a higher degree correction.
GBTC Intermediate Term (No Change Today)
Note there is discordance between the long term GBTC count and that of Bitcoin, because of its release to the public does not match BTC genesis. And, so the question in my mind is whether GBTC will see a large ABC, or a full impulse in the longer term. If I am strict to the impulsive view, GBTC can bottom in the $9 to $10 region, corresponding to the $8,400 to $7,800 bottom in Bitcoin. And, the rally in Bitcoin to $129K+ can correlate to a move to $220 target in GBTC. If we only see a C wave, we should not see GBTC rally higher than $85. Knowing which from this vantage point is not possible and we’ll need to see the market progress.