Leading Diagonal To Downside
 By
By
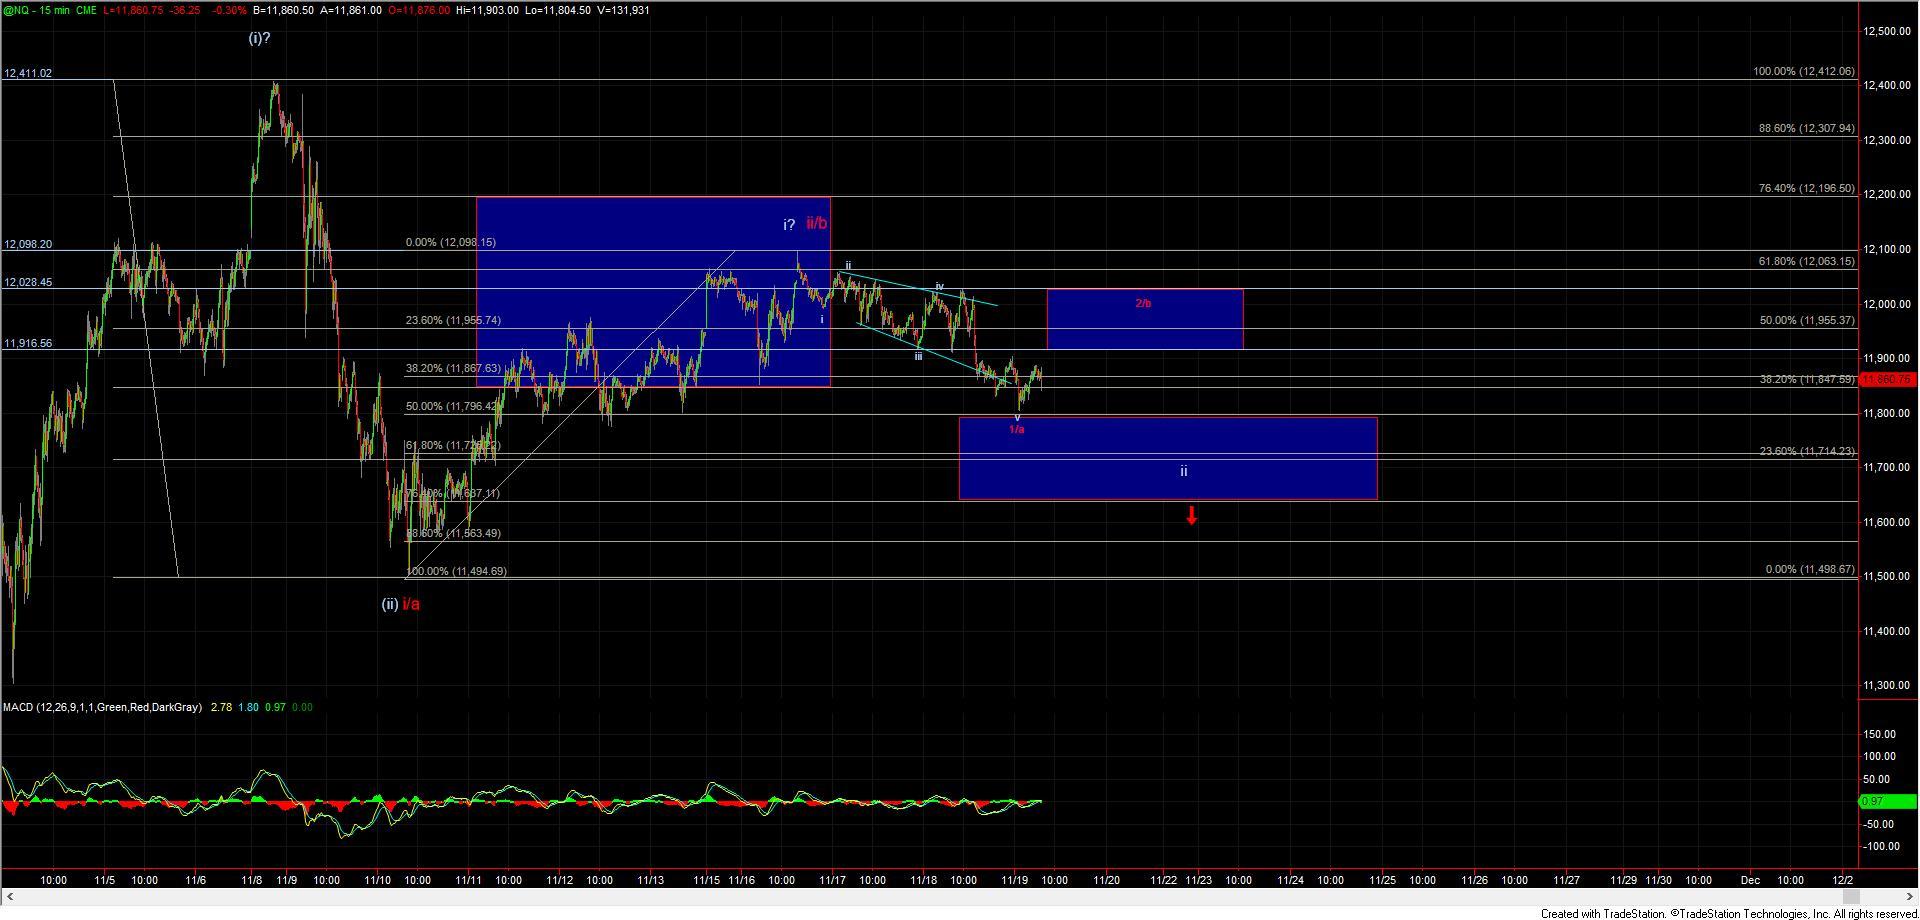
After holding the 61.8 retrace yesterday the Nasdaq 100 Futures (NQ) moved lower in what, like the ES, can count as a leading diagonal to the downside opening the door to this having put in a top for the wave ii/b at the 12,098 level.
Leading diagonals are not the most reliable of patterns, so I still would want to see a corrective retrace higher followed by a break back under the overnight low to confirm that we did indeed see a leading diagonal to the downside. Overhead resistance for the micro wave 2/b under this red path now comes in at the 11,916-12,028 zone, and as long as we can hold this zone then we can see another lower low before breaking higher again. If we do make that lower low, we still would need to get under the 11,796-11,687 zone below to make the white more immediately bullish count less probable and give further confirmation that we are indeed following the red path lower.
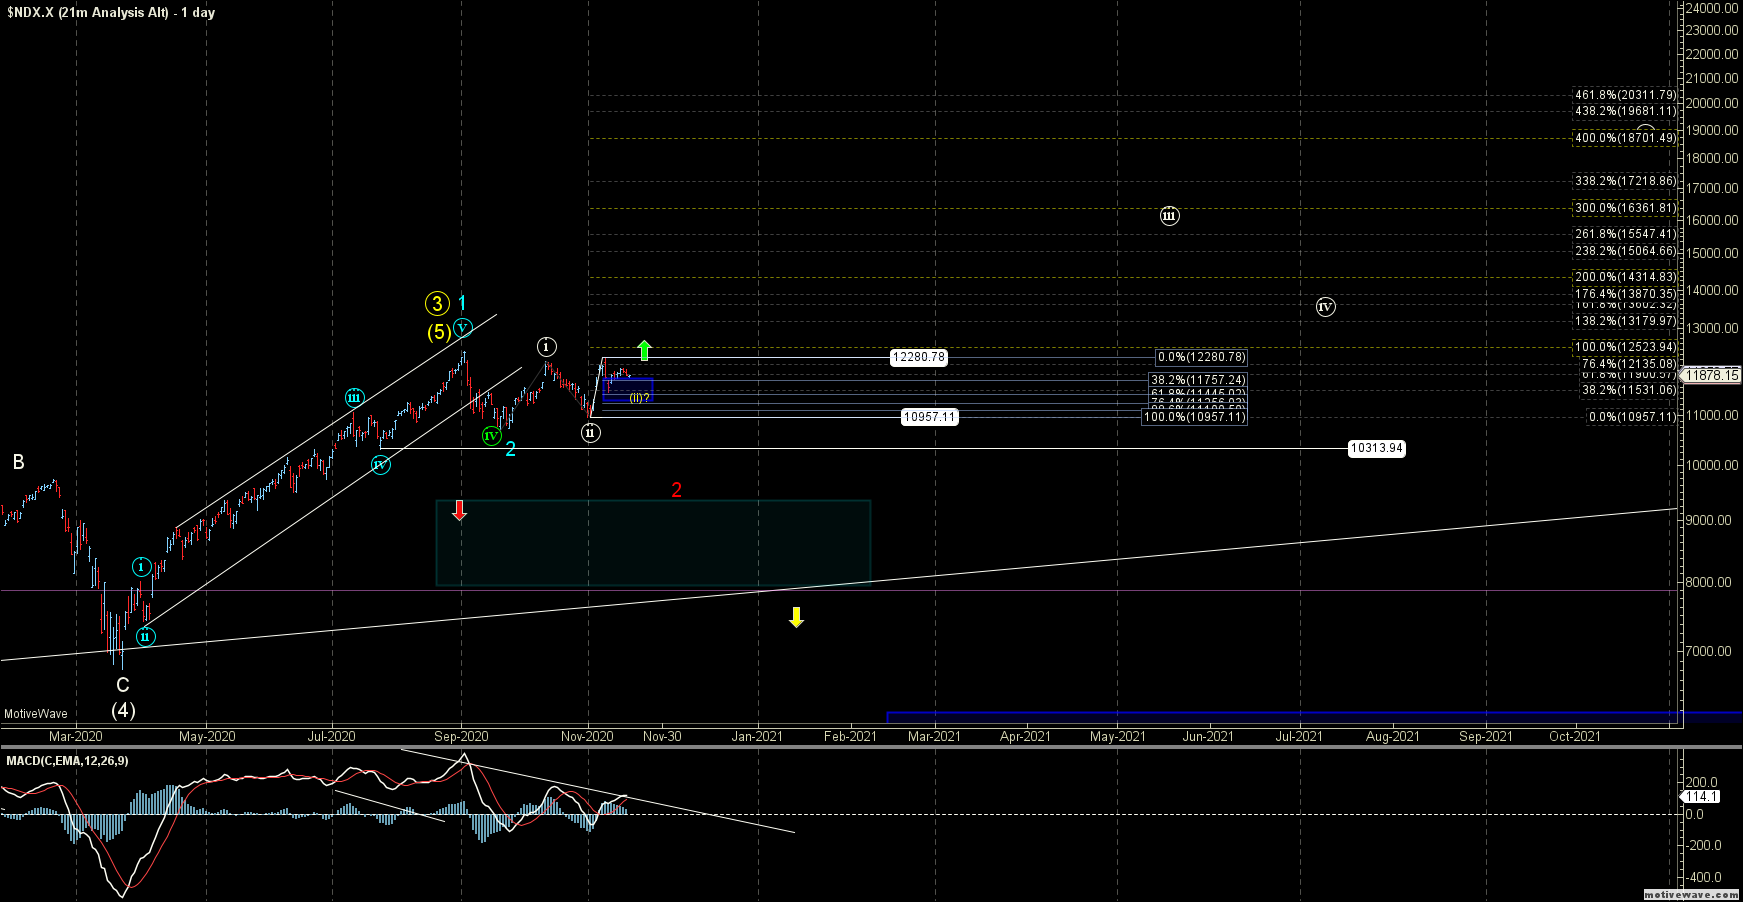
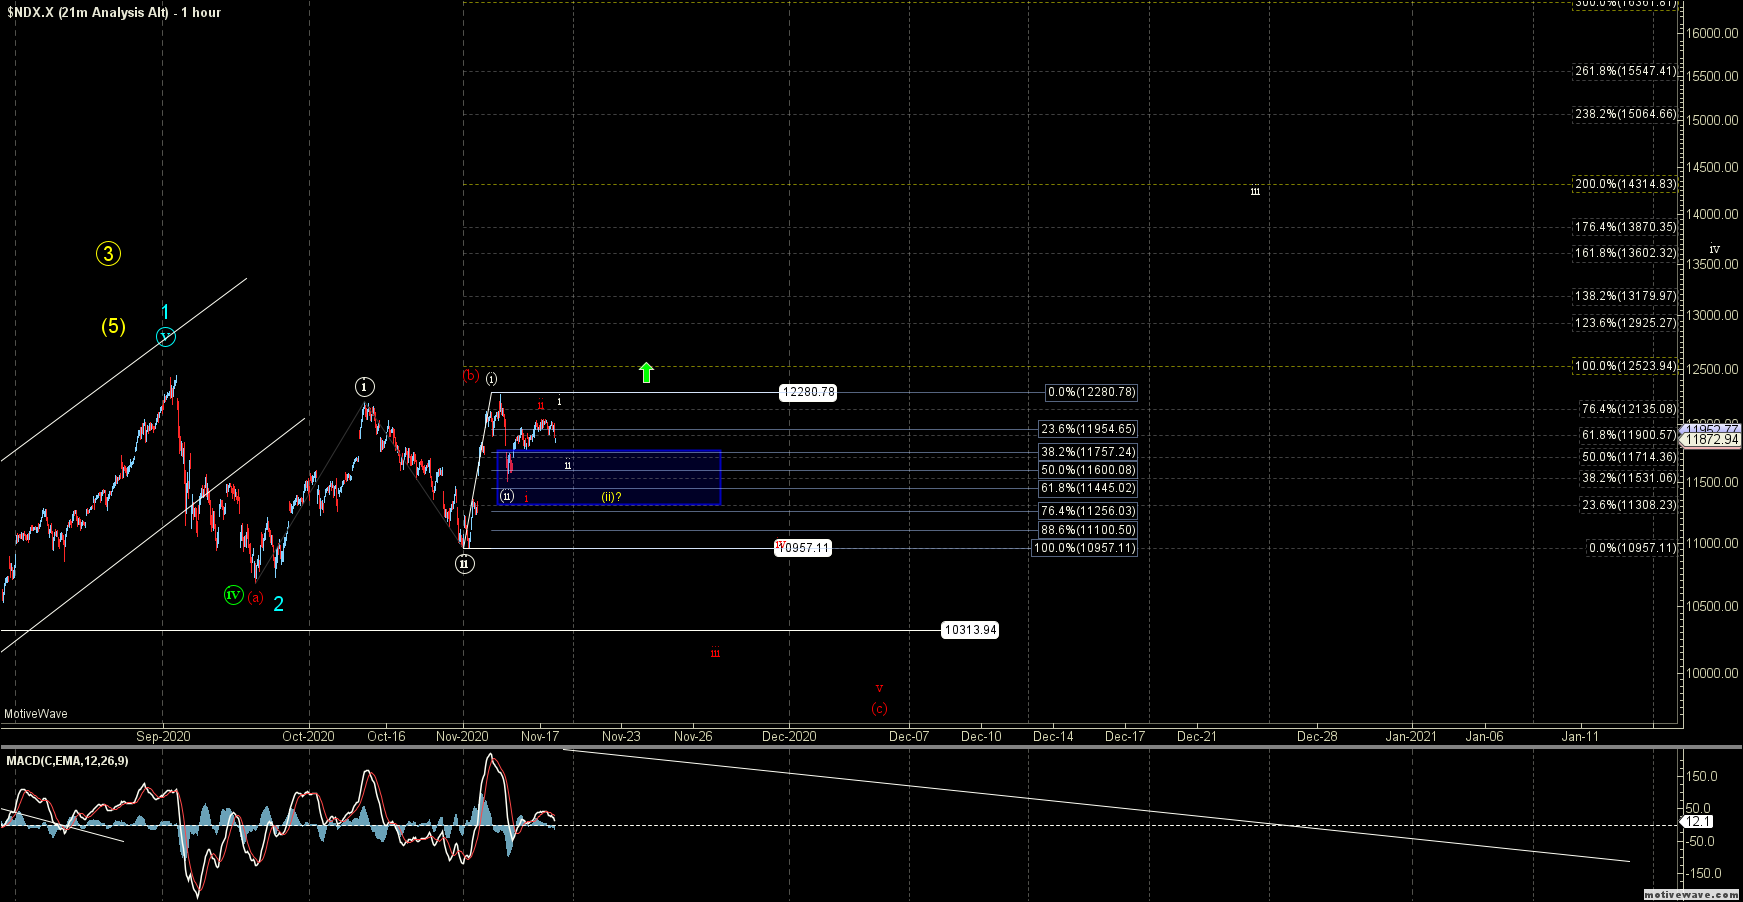
In terms of the Nasdaq 100 (NDX), as we have moved very little, the bigger picture charts remain very similar to what I noted yesterday. Current support for the white count remains in the 11,757-11,256 NDX zone -- lower than the levels noted above on the micro as we still can see another lower low on the NDX and still hold the overall immediately bullish path (I am showing this in yellow on the NDX chart). Holding this zone (whether we get another lower low under the 11/10 low or not) and breaking back up over the 12,268 high followed by a move through the 12,527 level would open the door for this to have already bottomed in all of wave (ii) under that white count and be on the way directly towards the 13,606-14,319 zone as part of a minor third wave off the September lows.
Should we fail to see a direct break higher and then break back under the 11,253 level and then below the 10,957 low on the NDX, then it makes it more likely that we will see that deeper retrace as part of the wave (c) of 2 shown in red, back below the 10,313 low before breaking higher once again.