Key Week For The Market
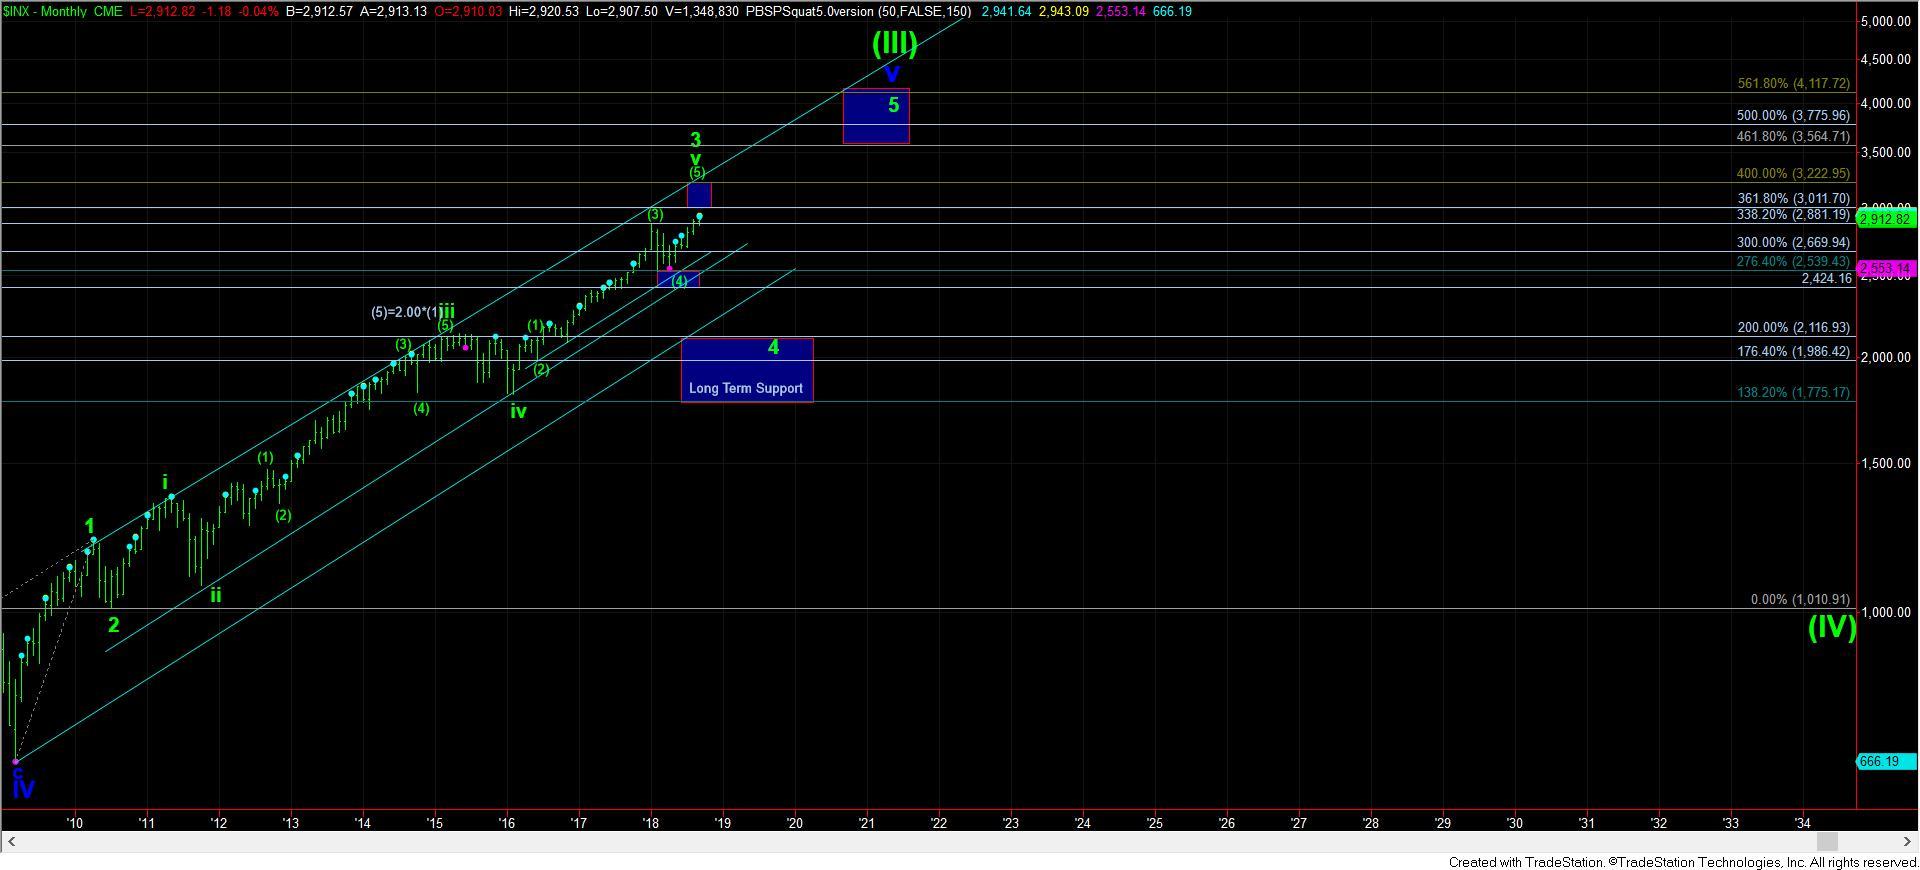
For those that have been following our work for years, you would know our perspective that we are in the final throes of the bullish structure we have been tracking off the 2009 lows.
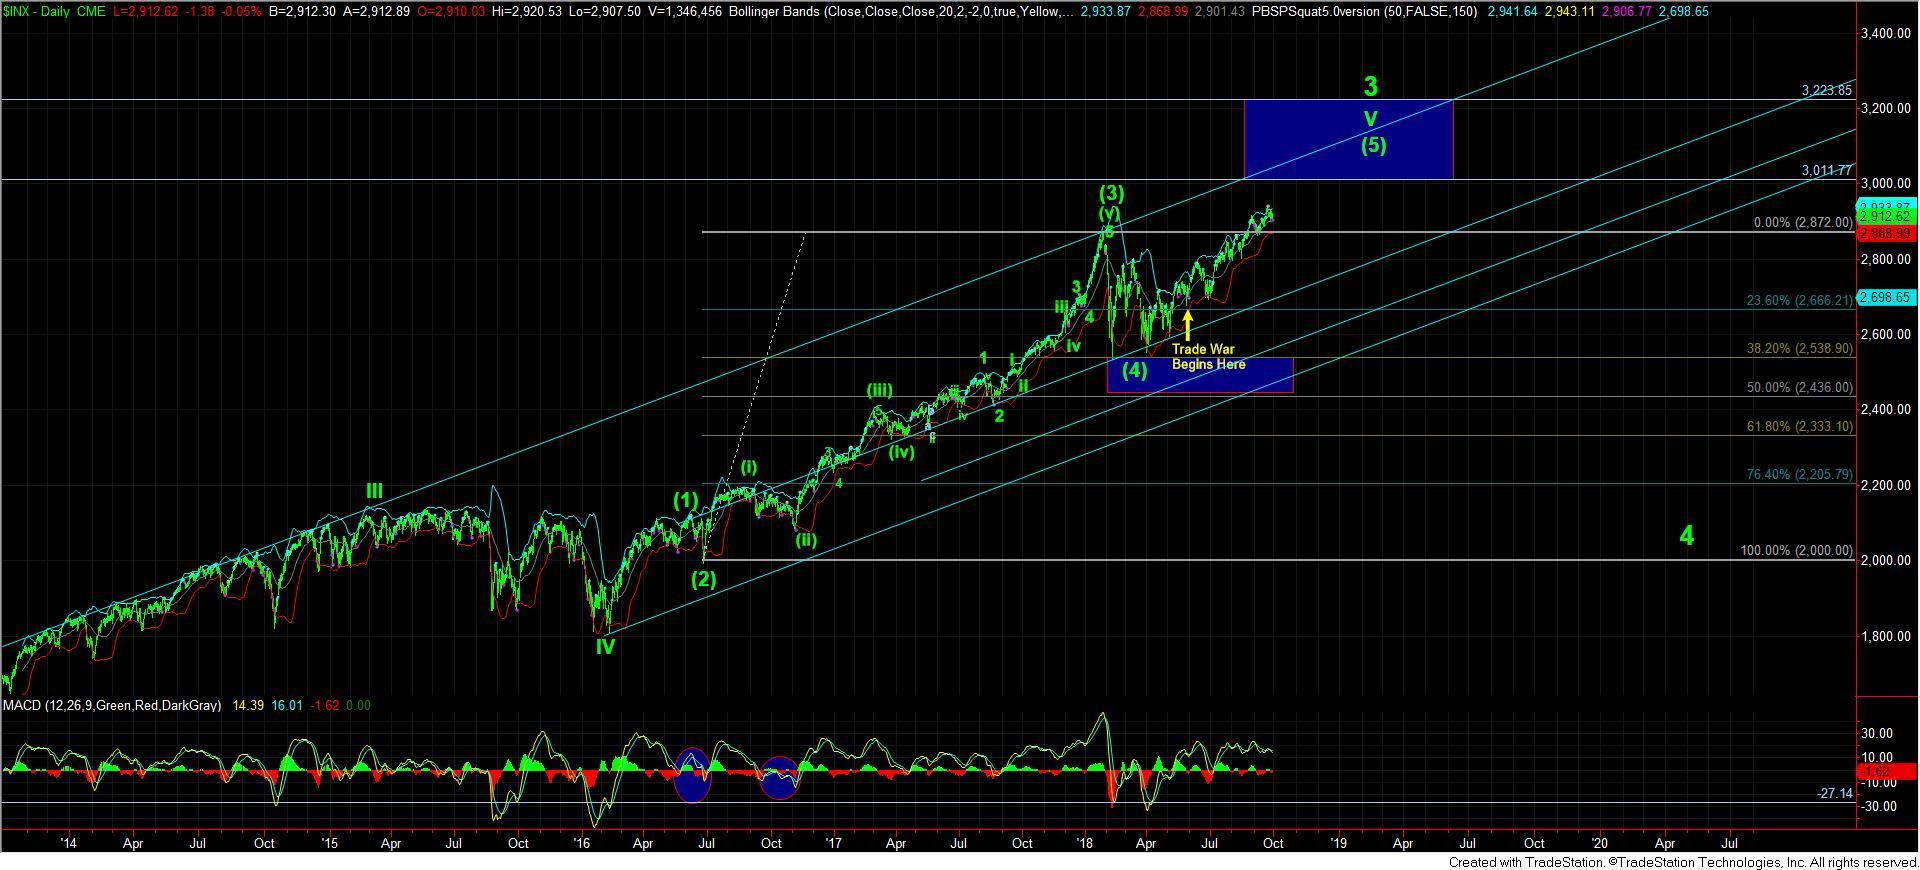
Most specifically, as the S&P 500 (SPX) rally came to our target in the 2100 region at the end of 2015, we were looking for a pullback towards the 1800 region to set up the rally to 2600+ to complete the 3rd wave off the 2009 lows. And, as the rally developed through 2016 and 2017, we set our targets to complete wave 3 at a minimum of 3011 on the SPX, but with a more ideal target of 3225. In the coming weeks, the market will decide if this 3rd wave will be completing over 3200, or if the 3000 region will put a cap to this rally.
Since we began the rally in 2018 that we had expected to new highs, the market has been hiding its true intention regarding where it would complete this 3rd wave off the 2009 lows. Due to the lack of a clearly completed wave (4) along with an overlapping start to wave (5) (as shown on the attached daily chart), the market has amazingly left us with two potential bullish counts for wave (5) for almost half of 2018. But, both time and room have run out for the market, and a decision is going to be made in the very near term.
I will attempt to explain my perspective on the market topping in a step by step approach, with support levels being the key to this analysis.
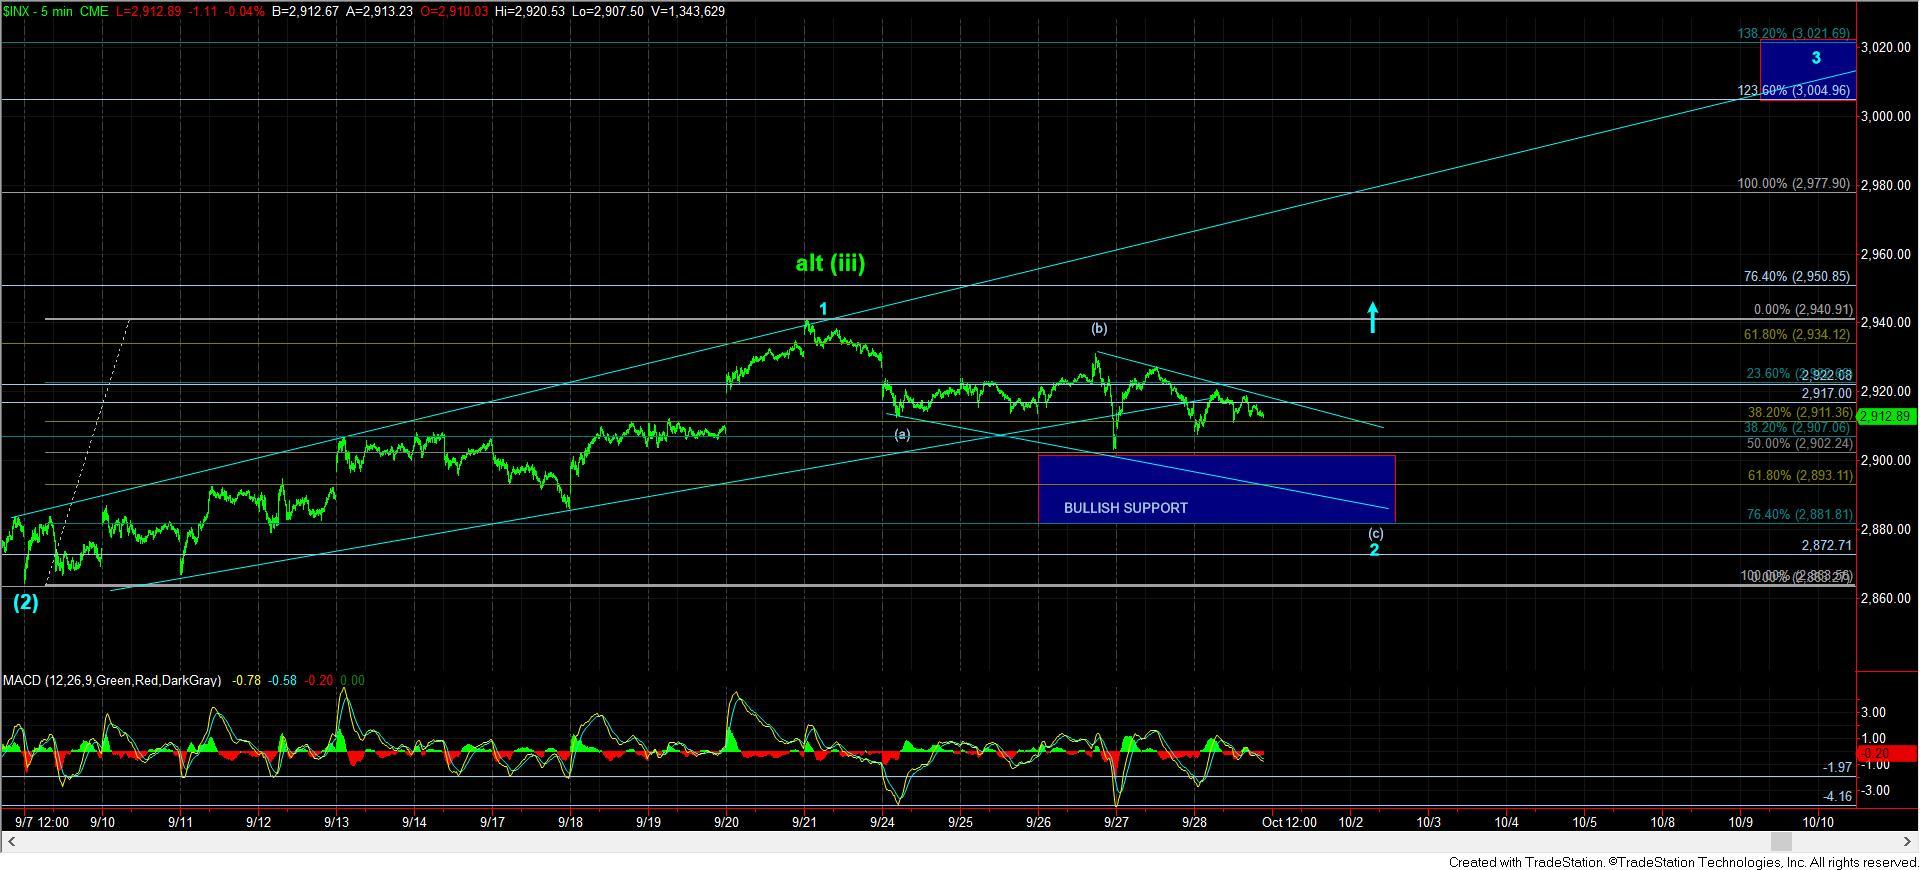
As long as the market remains over the 2880 region on the SPX early in the coming week, we still retain our potential to rally to 3225 into 2019. Our first target will be the 3005 region, which can be struck quite quickly in this set up. But, as I noted to our subscribers during the past week, the market is going to have to thread this needle very carefully. Any slip up in the current structure, and it would signal that the market will take years until we are able to strike levels over 3200 rather than months, and we will likely top out much lower and much sooner before the 20-30% correction we are expecting.
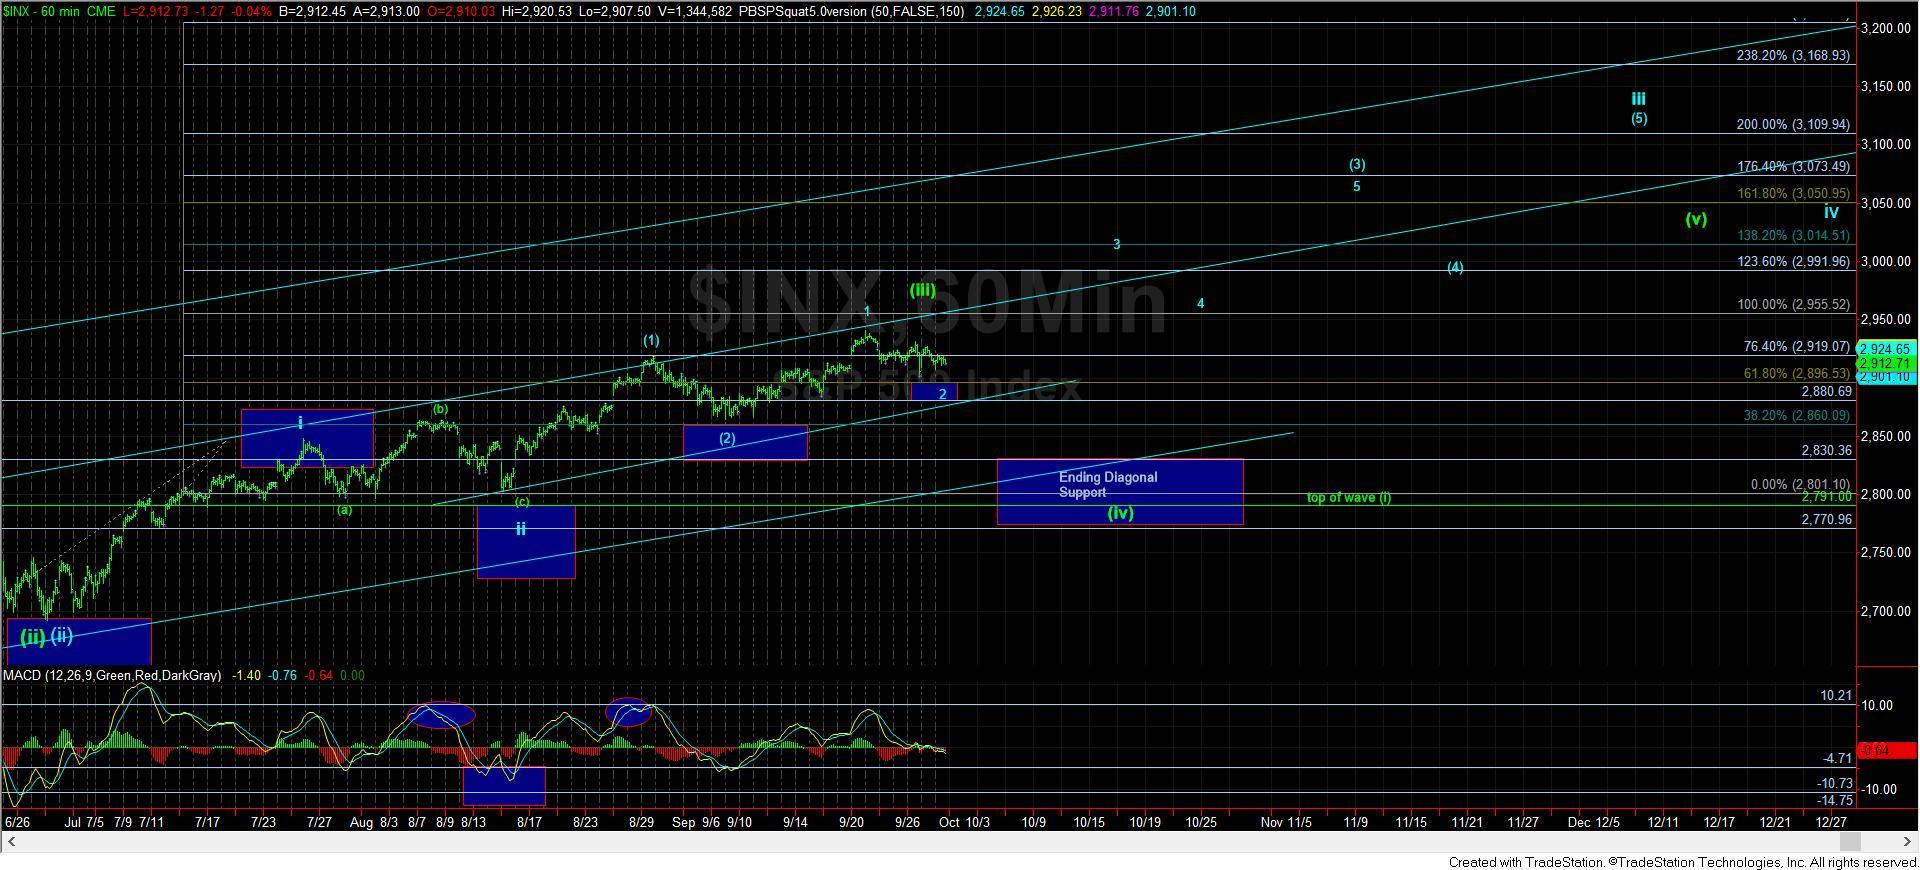
Most specifically, an immediate break down below 2880 will suggest that we completed wave (iii) in green on the 60-minute chart within the ending diagonal pattern we have been tracking. That would have me looking to our lower wave (iv) support zone on the 60-minute chart as a target where we would find support for one final rally to the 3011 region before we complete this wave 3 off the 2009 lows.
Yet, if we can continue higher to our next minor target in the 2956 region, then we will move our support up from the 2880 level to the 2920-30 region. If we were to fall back below 2820/30 support after exceeding 2950, that would suggest wave (iii) in green has completed, and we will again be looking to find support below in the wave (iv) target box.
So, as I noted, the market is going to have to thread this needle very carefully in the coming two weeks if we are indeed going to maintain the pattern pointing us up to 3005 at first, on our way to 3225 as we look ahead into 2019.
Lastly, I want to reiterate the warning I have provided to longer term investors over the last month. As we move higher to the longer-term targets we set years ago, the risk certainly rises that we will start the 20-30% correction we ideally expect to begin in 2019. The manner in which the market reacts in the coming week or two will make it much more clear as to whether we can finally move to the 3200+ region before we top out in wave 3 off the 2009 lows, or if we will only target the minimum level we expected at 3011. Either way, the risks have certainly risen, especially when you consider our ideal target for the expected correction in the SPX is in the 2100 region.