Keep It Simple Stupid – 8 Sessions of Consolidation, CPI Timing Catalyst
 By
Ricky Wen
By
Ricky Wen
Context Section:
- This year’s trend has been bearish since mid-Jan 2022 breakdown below Emini S&P 500 (ES) 4650s.
- Price has not stayed above daily 20EMA for more than 40 sessions this year.
- Since mid July, short-term price action has behaved differently as it’s been trending above daily 20EMA.
- By the end of July, the market retraced most to all of June losses with a banger month (ES +9%. NQ +12.5%).
- In addition, intermediate trend is now back to neutral as price action broke above the multi-week consolidation range of 3950s-3720s and now hovering around 4100s+, which is above the weekly 20EMA.
- To summarize: short-term bullish, intermediate neutral and this year’s trend remains bearish until price proves otherwise.
- Overall, if you recall, July played out accordingly to our expectations and historical bullish stats. You can read additional context from our July 4th report to learn more.
- For our month of August expectations, stay tuned and read the latter section of this report.
Current Parameters:
- Daily 20EMA = 4050s
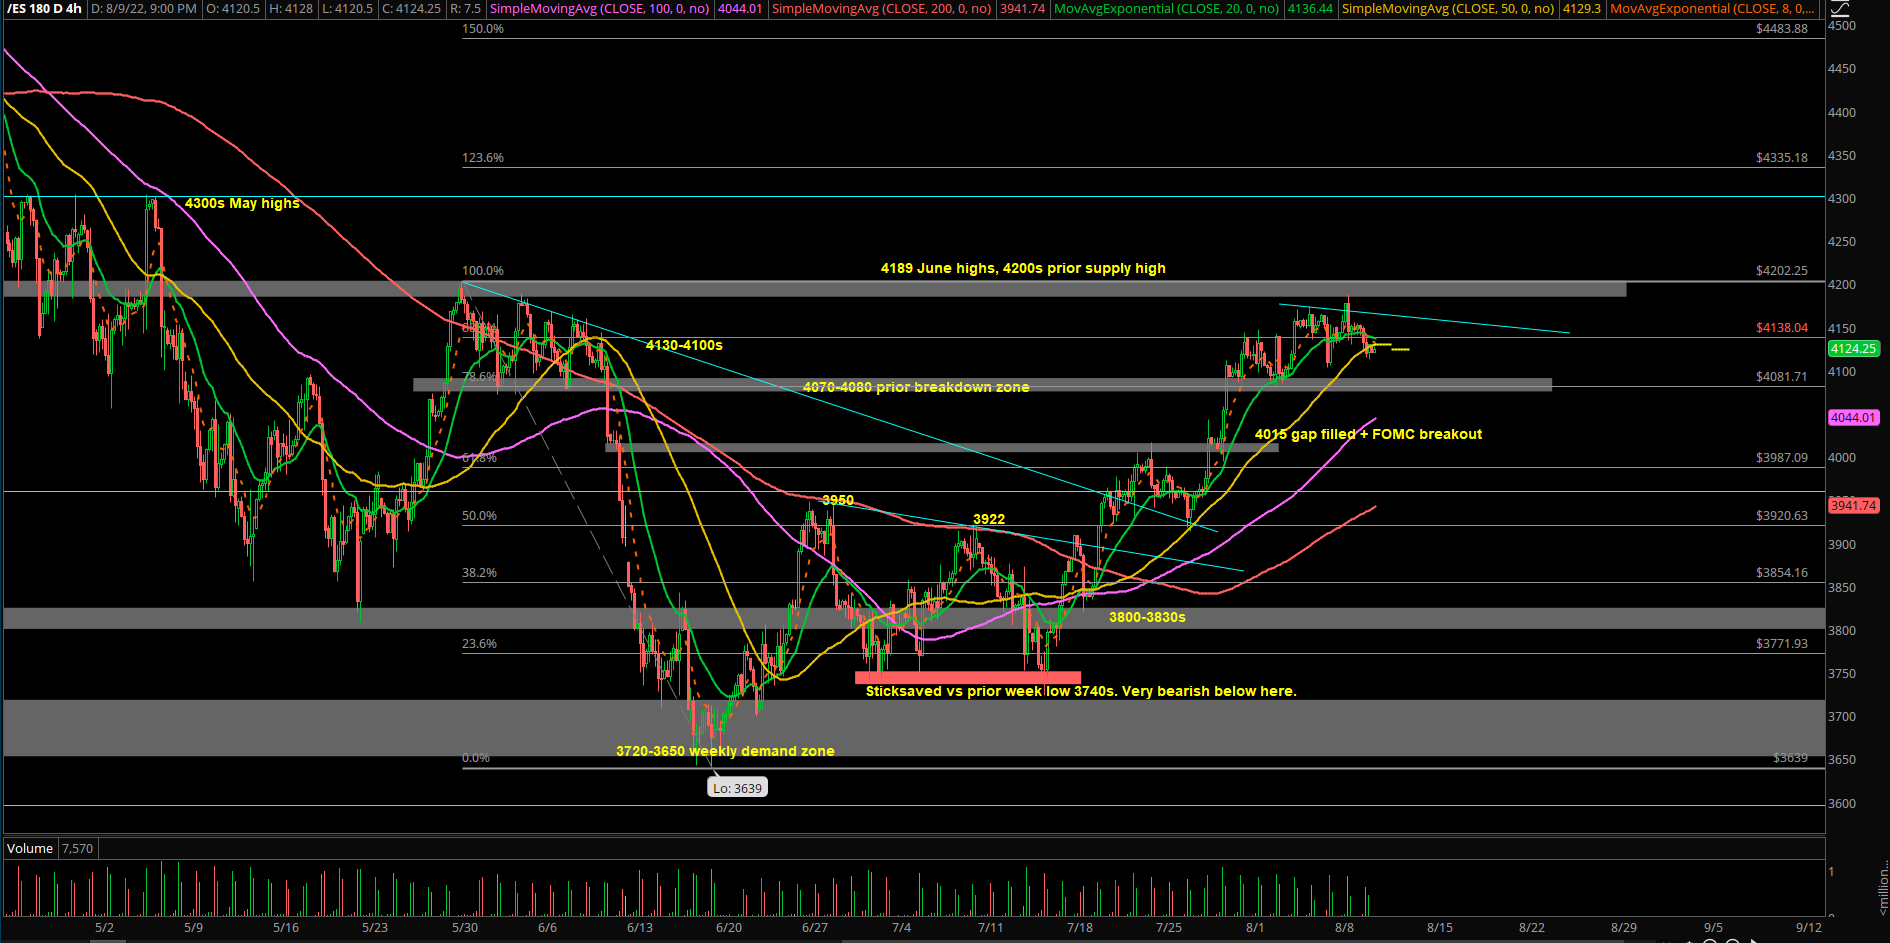
- 4hr 20EMA = 4130s
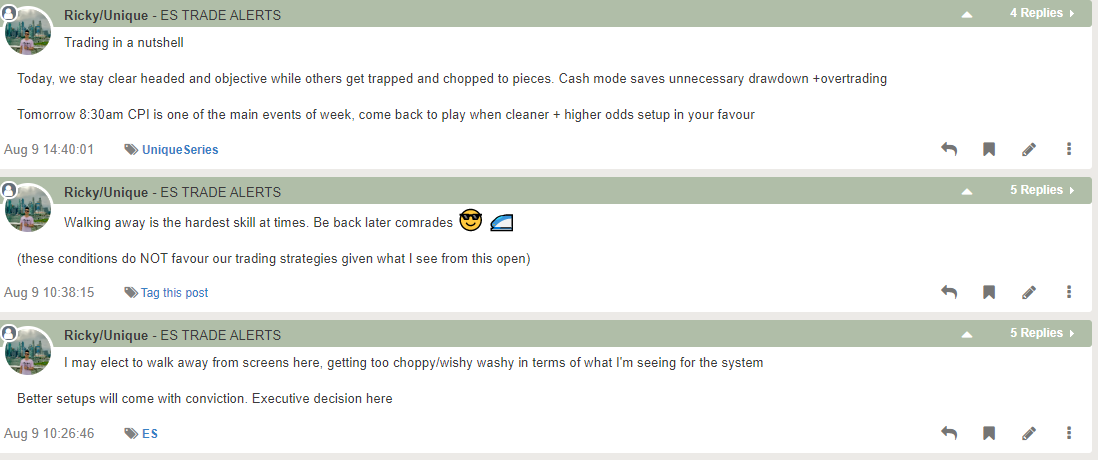
Tuesday played out as a relatively tight range day. Half of the move came from overnight 4155 highs grinding down into RTH open. Rest of the RTH session consisted of only 26 points range 4139-4113. Majority of time was spent churning between 4120-4130. Overall, it was a fairly trappy session to trade so we mostly stayed in cash and wait for cleaner setups as we head into tomorrow’s CPI event.
As demonstrated in our ES Trade Alerts service, we called the chop ahead of time as train riders avoided unnecessary drawdown:
Key Ideas for Aug 10:
- Last week was a consolidation week so we need to be mindful of fast and furious range expansion if we get daily closes below 4080 or above 4170s (first big clues of breakout).
- Short-term trend bullish, intermediate neutral and longer term remains bearish.
- There’s enough trapped participants from both sides now given the market has stayed in this overall 4080-4188 range for the past 8 days. Be aware of violent move.
- CPI = 8:30am ET, one hour before RTH open.
- Intraday wise, need to wait and see how Wednesday RTH opens to determine which side has momentum advantage to bet follow through.
- If price stays above 4100-4115, then be mindful of a rotation back to 4150 (more rangebound).
- Above 4150 opens 4170/4185/4200 (then bigger expansion).
- Below 4100 opens 4080 liquidation risk. Then, further downside such as 4070/4050/4030 become possible.
- Currently hovering at 4120s, sort no man’s land.
Note: Our overall bias/educated guess has not changed, we are still on the outlook for next big leg down. However, the market’s price action has not confirmed anything yet as this is strictly rangebound trading for the time being. Adaptable to both sides as we need market generated information to tell us more clues and enhance probabilities.
- Key levels are static, context is dynamic, real-time execution is fluid
- Reactionary day-to-day market environment so capture points/profits and cut losers quickly, know your timeframes and adjust. We utilize a level by level approach
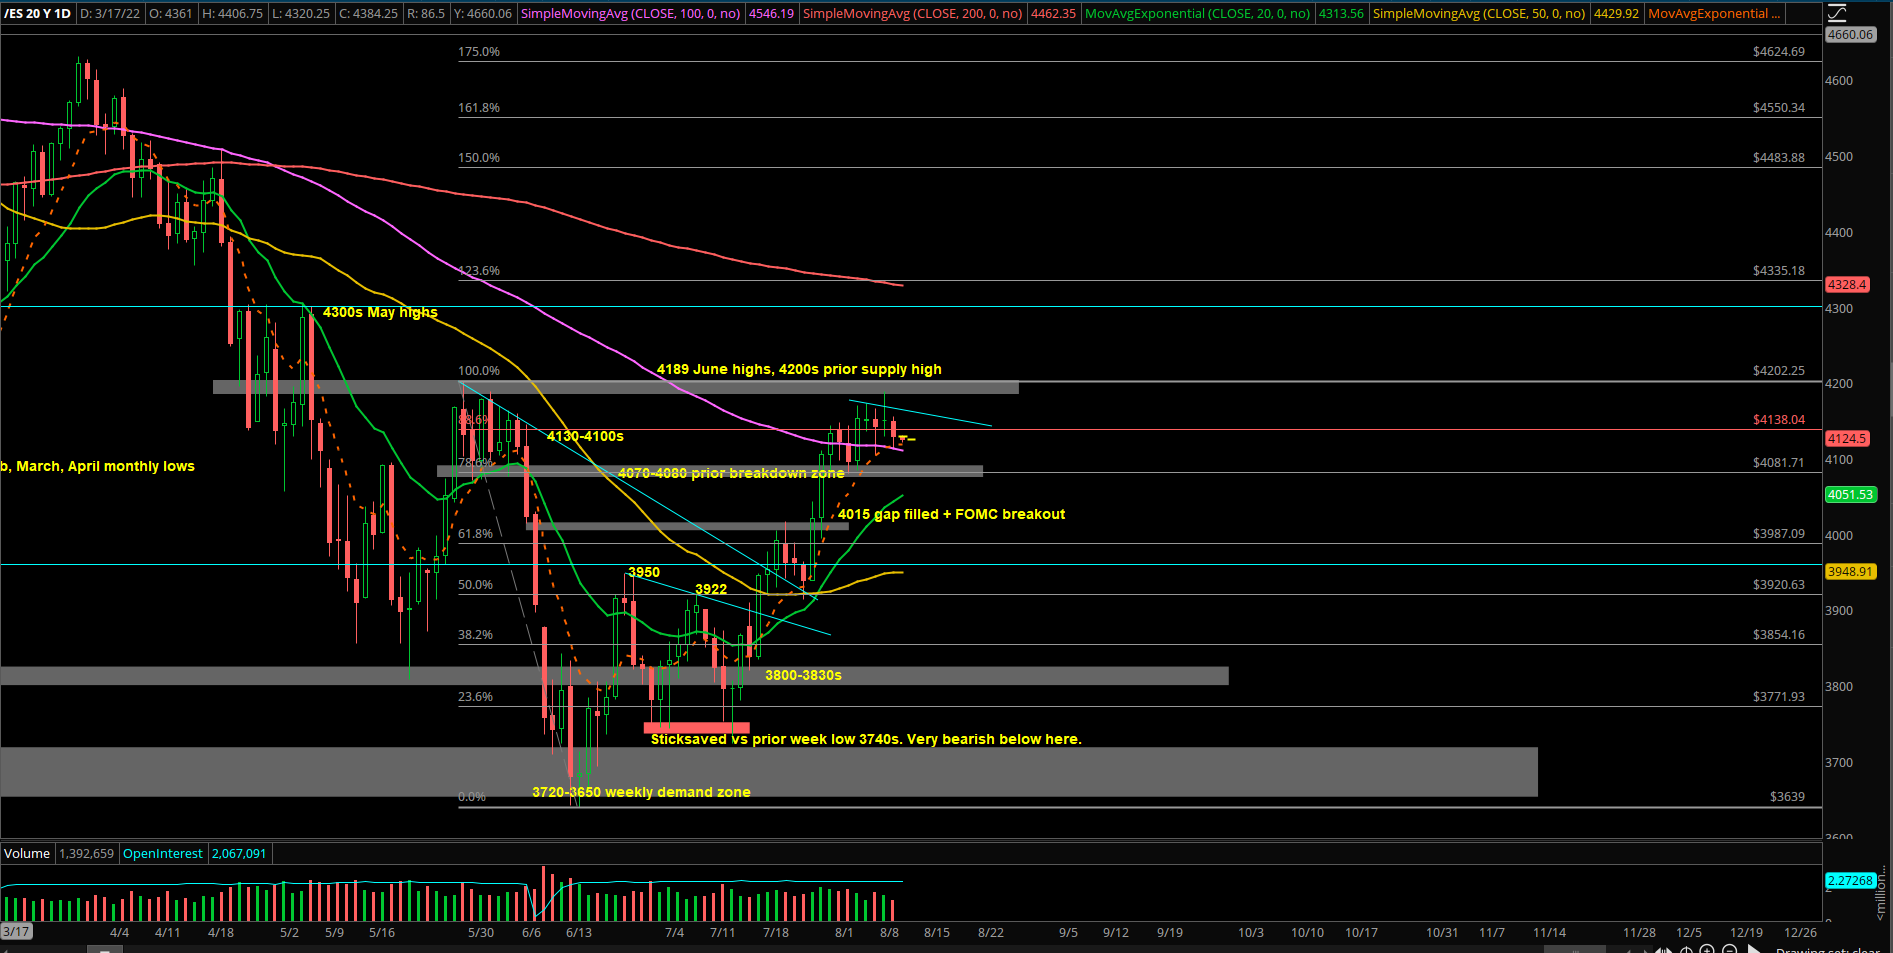
Bigger Picture:
ES lost 8.2% for month of June. Sellers were unable to close the month at the lows.
ES gained 9% for month of July. Buyers were able to close the month at the highs.
All this within the context of a downtrend year and majority of business has been conducted by trending below daily 20EMA+weekly 20EMA. This is an important distinction because the market hasn’t trended down for this long of a period since year 2008.
For month of August, according to stats, it is historically a chop-fest type of month. We need to be mindful of churning back and forth so mentally prepared for more rangebound trading. We’ll play this by the ear and as we keep utilizing level by level approach every day. Market is likely waiting for Sept/rest of year to do a bigger range expansion.
As of writing, we see significant supply/prior resistances at 4130s/4180s/4200s/4300s, keep monitoring how price action reacts versus these key levels/areas. We are on the lookout for another swing leg down given the risk/reward here.
For intermediate sellers to confirm they are back in business, it would take a daily close break below 4000 followed by 3920 to open larger downside risk and destabilize this multi-day bottoming process that started from June 16. Meaning massive amount of buyers get trapped if price goes below FOMC breakout and July 25th week low. In addition, if any time a break below June low 3639 occur, then we have next significant demand zone at 3550-3500.
For intermediate buyers to see if this year’s low could be in, it would take a daily close break above 4200 followed by 4300 (May highs) to begin that discussion.
As of writing, we’re treating the current rally from June lows to end of July as a typical countertrend rally within a bearish year’s trend. Meaning this year’s low may not be in yet. Key parameters are listed above.
Various different timeframes and structures explained in the report. Understand the context and know your timeframes. Levels are prepared for the next session. Adapt in real-time.