It’s Almost Time To Chase JP Morgan
 By
Levi
By
Levi
- We are looking for a specific high-probability long setup in JPM.
- Follow along as we discuss why this type of setup can help the swing trader find key entry and exit points.
- We also will analyze what implications this could have on the longer-term outlook for JPM.
------------------------
There is no need to tell any market participant that the last 5 months have been tough sledding for investors and traders alike. This, like all other corrections, will see an end and a new rally phase will unfold. You can see our updated market outlook in other articles published here on Seeking Alpha.
For JP Morgan Chase, it has actually been in a corrective structure for some 7 months, having hit its most recent swing high at the end of October of last year. Let’s talk about why we see that correction as being near completion and what is most likely next.
As well, we will briefly discuss what may happen after this next rally phase finishes. To do so requires a brief introduction to our preferred method of analysis, Elliott Wave. While there are many methods of analysis in use amongst market participants, both fundamental and technical, this one is our preference.
This is not to claim that fundamental analysis is of no benefit. Certainly not. In fact, in StockWaves we espouse the belief that fundamentals and technicals can be synergistic when correctly applied.
Elliott Wave works on a continuum. The broader the issue being analyzed, the more human behavior and sentiment will be the driver. The smaller the issue, E.G. a start-up biotech stock, the more fundamentals will drive initial reactions and movements, both up and down.
For those that are not familiar with Elliott Wave, the most fundamental explanation is that it is the study of human behavior in motion via stocks and the market that they compose. For decades now, specific structures have been observed. These structures repeat on all time frames and therefore have predictive value. The more broadly traded a stock is, i.e. a large cap like JPM, the more reliable its structures will be for studies via Elliott Wave.
This especially applies to a market of stocks such as the S&P 500 Index. We have written extensively about the correct application of Elliott Wave theory. As well, there are several articles here on Seeking Alpha as to how we overlay what we call Fibonacci Pinball. This system of analysis keeps us on the right side of the market, whether bull or bear, much more often than not.
The current setup in JPM appears to have great potential in the near term. Some will prefer to start an initial position at current price levels. Others have a trading style that waits for a more specific structure to develop. Here’s what we currently see for JPM.
We have been waiting a long time for banks to give us a decent consolidation. Our analysis of the sector via XLF and other individual bank stocks suggests that consolidation may be completing soon and that it will turn up for an intermediate rally phase. In fact, XLF may have already seen a larger 5 wave structure up from the major low struck in March 2020.
What this means is that on a percentage basis, XLF may actually see a larger upside move than JPM. BAC is another stock that we are tracking that shows something similar to XLF. From current levels, an initial 5 wave rally up in BAC may reach near the recent highs at the $45 level before a brief pullback. This could set up a surge to much higher targets in the months to come.
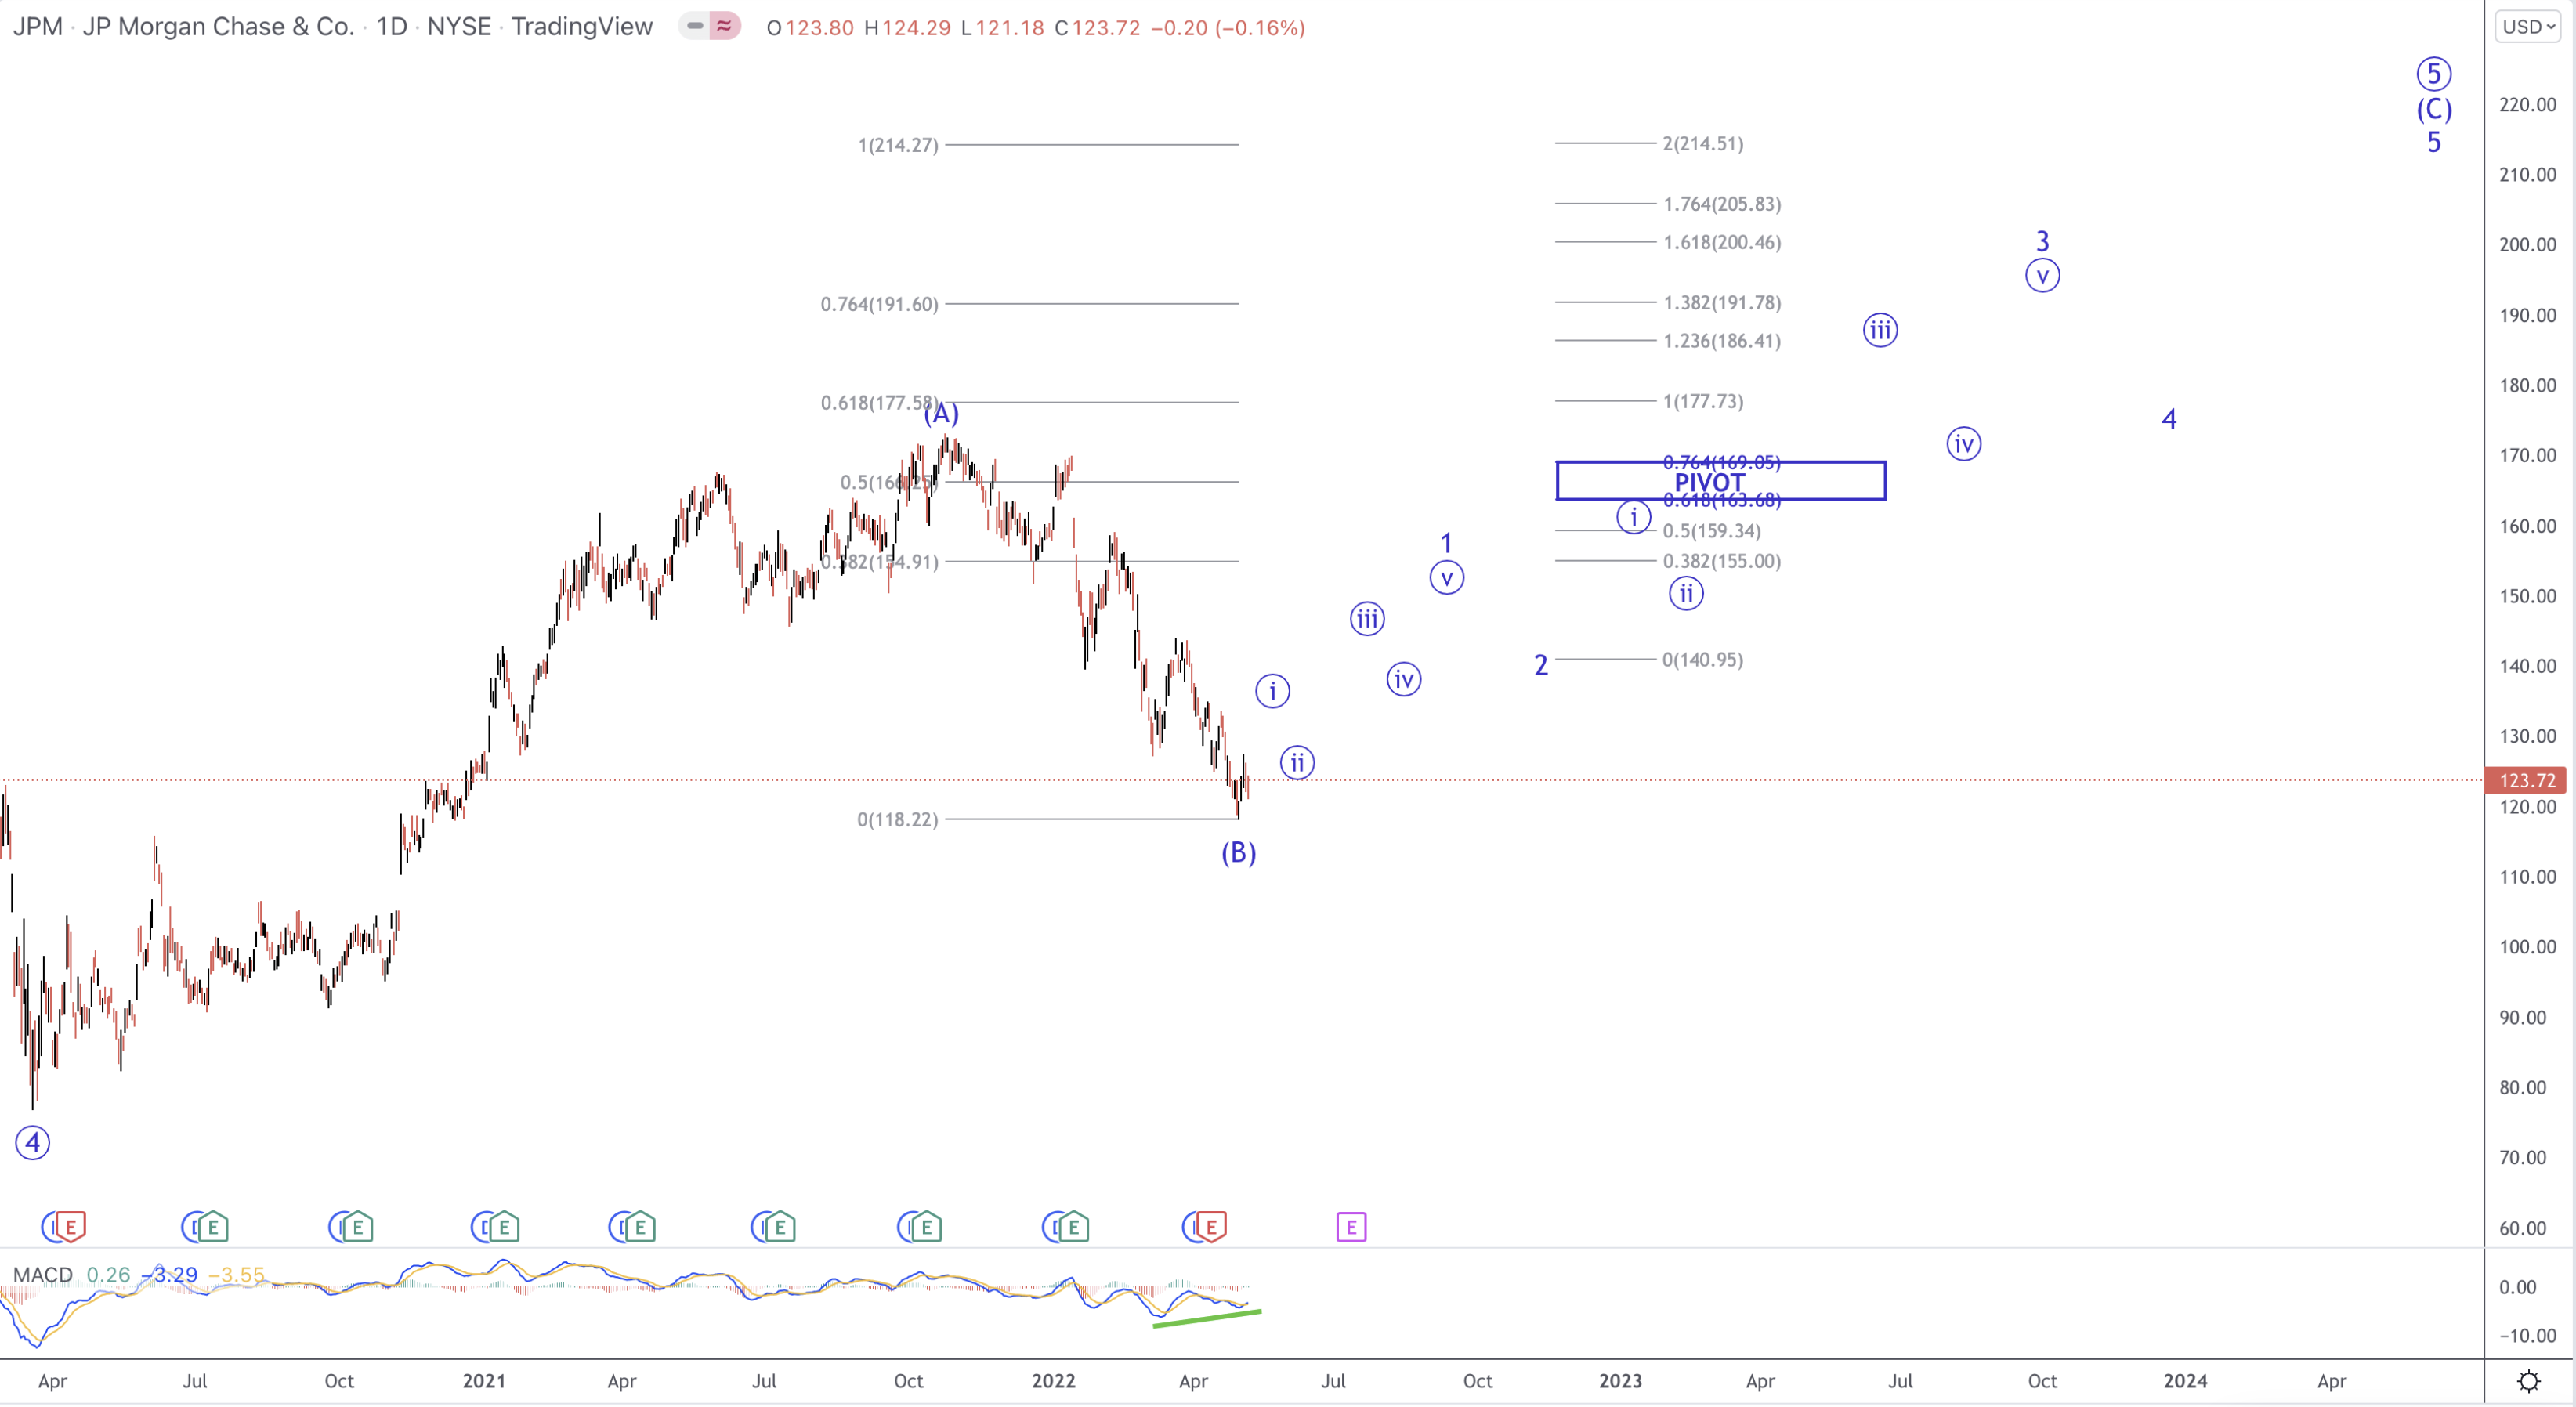
Regarding JPM, the most straightforward structure would be as illustrated in the attached chart. We believe the high that was seen in the Fall of 2021 was an (A) wave and that the (B) wave of this rally has already completed or will soon do so. From this swing low of $118, an initial smaller rally should form.
The (C) wave of a larger Primary 5th wave may also be composed of 5 waves. Note too that each of these 5 waves could also break down into 5 smaller waves. This is the principle of self-similarity. The market and its stocks are fractal in nature. Again, this is what gives Elliott Wave its power and utility.
An ideal setup to chase JPM would be the first wave up shown as wave 1 of the larger (C) of a Primary 5th. That may see the $155 area. Thereafter, a normal pullback would be to the $140 zone. The next lesser degree wave ‘i’ would typically be 38 - 62% of wave 1 projected from the low in wave 2. Again, a small pullback should be seen.
This would be the highest probability setup for a move to as high as $215 over the next several months. Here we can also see a particularly useful feature of Fibonacci Pinball inside our Elliott Wave analysis. This is a type of behavior that we have seen play out literally 1000’s of times and therefore can testify as to its efficacy.
Once we have the initial rally up in waves 1 and 2, we can set our market pivot. The pivot will first act as resistance for the lesser degree wave ‘i’ as you can see. Once the pivot is conquered, it will then act as support. This serves various purposes. One being, it helps communicate to us when our bullish thesis may be wrong.
Let’s suppose that JPM only manages a rally up to the recent highs in the $170’s and then breaks down below $163 and even follows through under the $155 level. Should this take place, it suggests our higher targets are not likely to be obtained and in fact JPM may have already struck an important high.
However, from the bullish standpoint and the bigger structure we are seeing, JPM has a viable shot at the $215 level. To continue as probable, the structure should unfold as illustrated in our chart.
Some make look askance at Elliott Wave. Frankly, I don’t blame them. Not all self-proclaimed Elliott Wave experts are truly such. This is not to disparage others. However, there are specific guidelines that the analyst should follow so as to obtain the desired result. We are looking to find high probable setups, these being short, medium or long term in nature. It is our desire to provide high-quality, actionable analysis that keeps us on the right side of the market. We believe that our track record speaks to this.
A quick note as to what may be next for JPM. Should the $215 level be struck over the next several months, it could be a significant high in price for some time to come. So, for those with a longer term outlook, carefully observe the price action over this time frame and it may be advisable to become protective of any positions held once this entre structure completes.
We must also address the possibility that JPM has already struck an important high in price last Fall. While we do not see this as highly probable, should JPM continue down in its current move and see under $100, then we would reassess our bullish outlook.
This is not an attempt to put forth so many scenarios that one of them must come true and we proclaim victory, vigorously patting ourselves on the back. Please recognize that markets and the stocks of which they are comprised are non-linear, fluid and dynamic in nature. We adapt in real time to what we're given. As well, analysis will evolve and become even more clear as data fills in the chart. There will come a moment where the analyst can apparently even complete the sentence for the stock or market they observe.
One way of comparing our analysis is to that of a head coach of a football team and the staff that compose a game plan for their upcoming opponent. Many coaches even have 15 pre-scripted plays that they run at the beginning to see what the reaction of the opposing coach will be. As well, the game plan of each coach usually has provisos and possible adaptations given certain scenarios that can come up during the actual game.
The football coach must adapt to what's given during the real game. It simply is not possible to stubbornly stick to one specific path when the facts in front of you change. We do the same in our analysis. There's a likely path in the bigger picture. This is similar to it being likely that the superior team will come out victorious in any competition. We have our most likely scenario that we follow, but we also have an alternative to consider.
Being able to quickly adapt to changing landscapes is one of the hallmarks of Elliott Wave analysis, when correctly applied.
I would like to take this opportunity to remind you that we provide our perspective by ranking probabilistic market movements based upon the structure of the market price action. And, if we maintain a certain primary perspective as to how the market will move next, and the market breaks that pattern, it clearly tells us that we were wrong in our initial assessment. But here's the most important part of the analysis: We also provide you with an alternative perspective at the same time we provide you with our primary expectation, and let you know when to adopt that alternative perspective before it happens.
There are many ways to analyze and track stocks and the market they form. Some are more consistent than others. For us, this method has proved the most reliable and keeps on us the right side of the trade much more often than not. Nothing is perfect in this world, but for those looking to open their eyes to a new universe of trading and investing, why not consider studying this further? It may just be one of the most illuminating projects you undertake.