It’s Déjà Vu All Over Again
Ok. Ok. I will admit it. This market has been exceedingly frustrating for many months during which time it has gone nowhere.
There. I said it. In fact, it reminds me of the 2014-2015 timeframe in so many ways. And, I am quite certain many of you likely feel the exact same frustration.
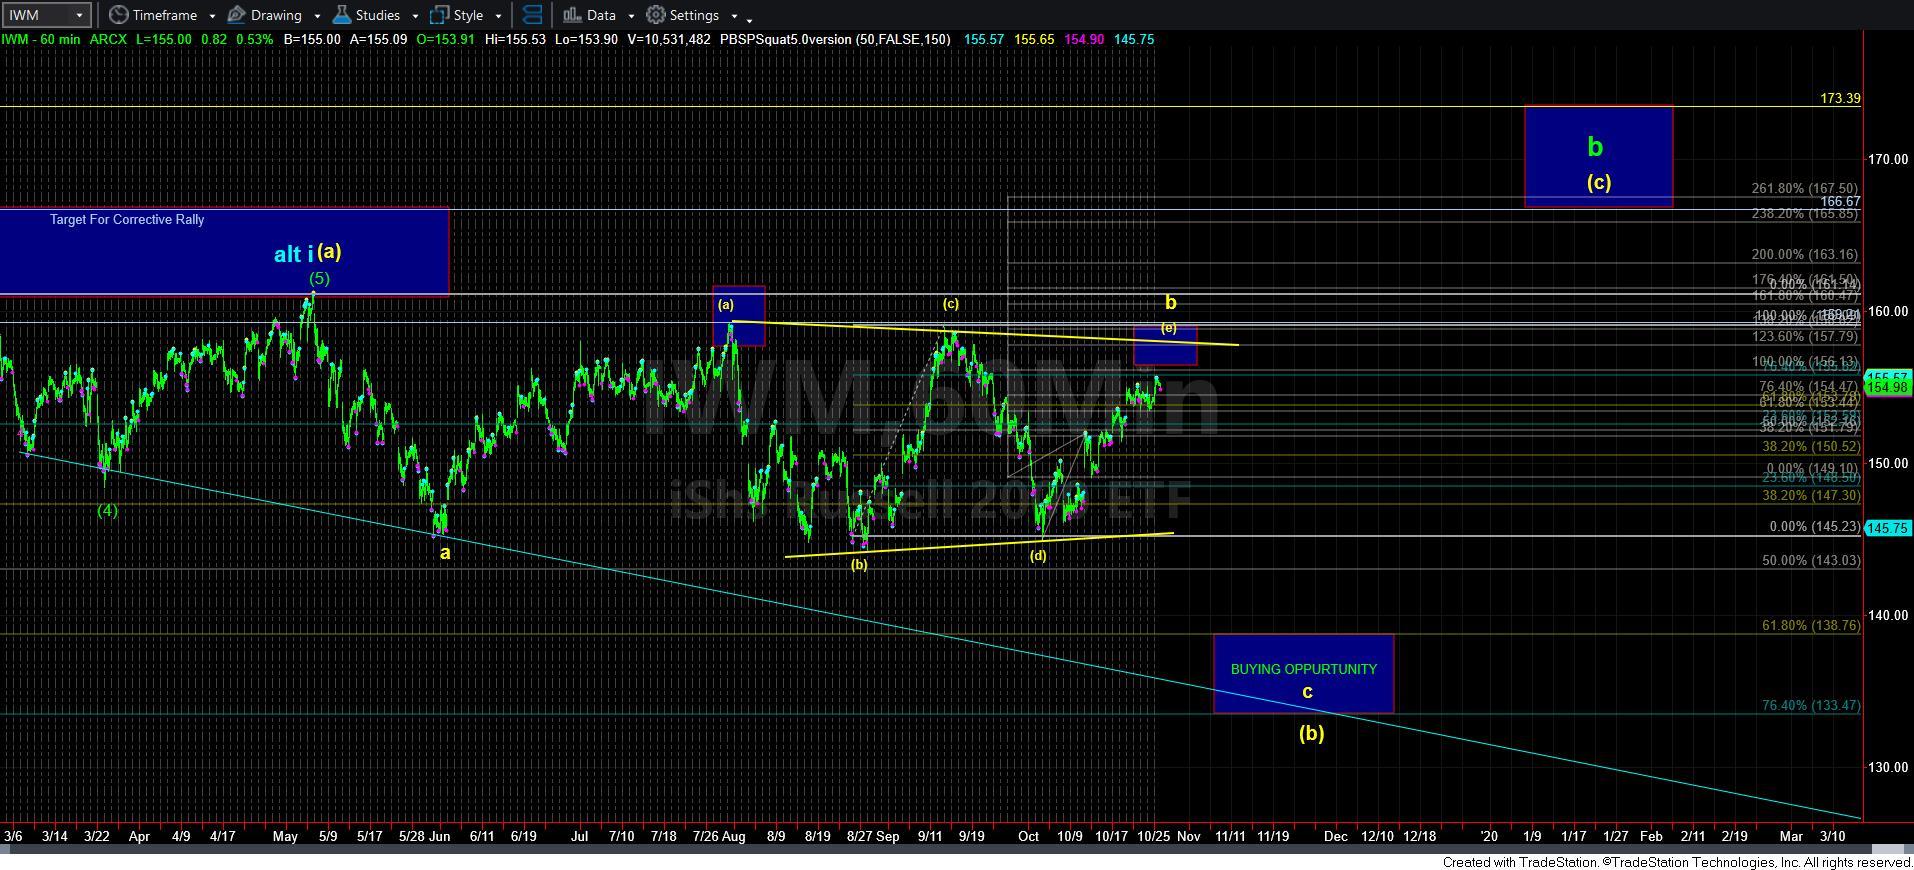
I mean, when you step back and look at the IWM chart as one example, you will see we have been trading within the same region since February. Yes, that means we have been going back and forth for 9 months with no progress. And when you focus on many individual stocks you will see how many have dropped below their 200DMA’s with many more below their 50DMA’s. The underlying market is still very weak, whereas the indices have been going sideways, with many stocks still needing to see much further downside for their respective 4th waves.
But, even if we do feel the frustration of this range bound action, we cannot allow it to affect our objectivity regarding what the market is telling us. And, as I have been saying for quite some time, the market has not been telling us anything different other than that this is likely corrective action. So, I am not going to take the time to re-review all the reasons as to why I classify this rally as a c-wave within a [b] wave rally. Rather, I am just going to state that my count remains the same in the larger degrees.
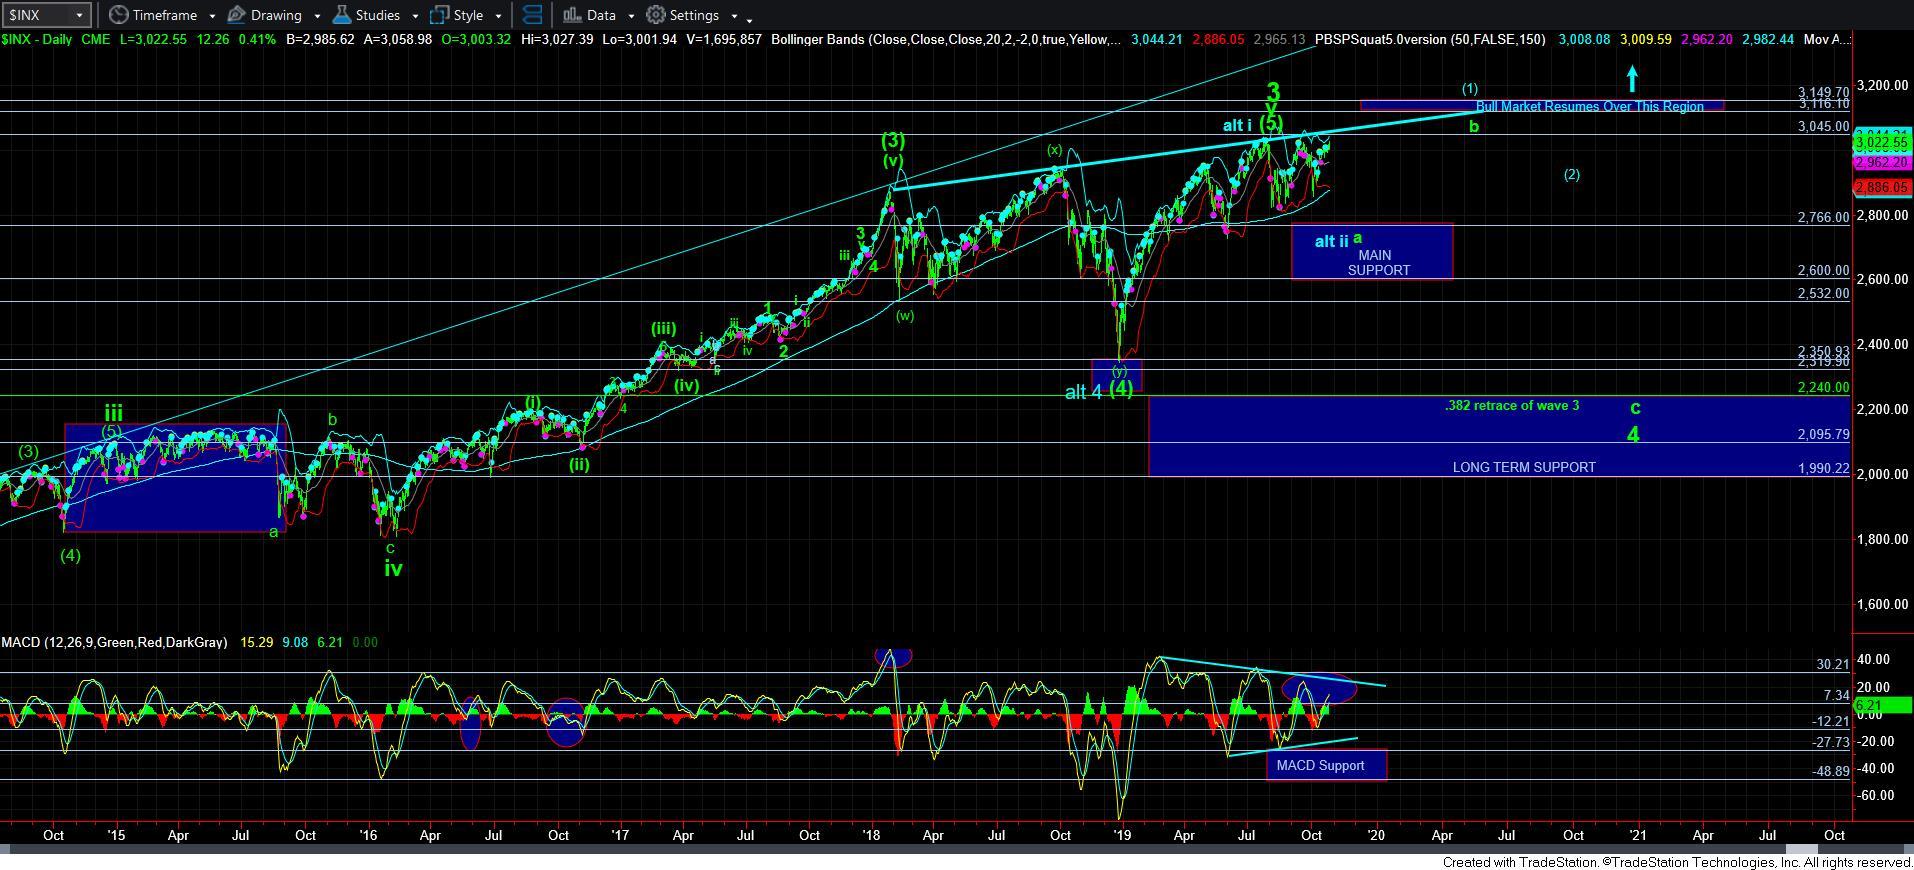
As the market began its rally off the December lows of 2018, my initial expectation was that we could top out as we headed into the March/April time frame. Clearly, the market had other intentions as it extended the timing for my correction expectations, and in quite a similar fashion to what we saw in 2014-2015.
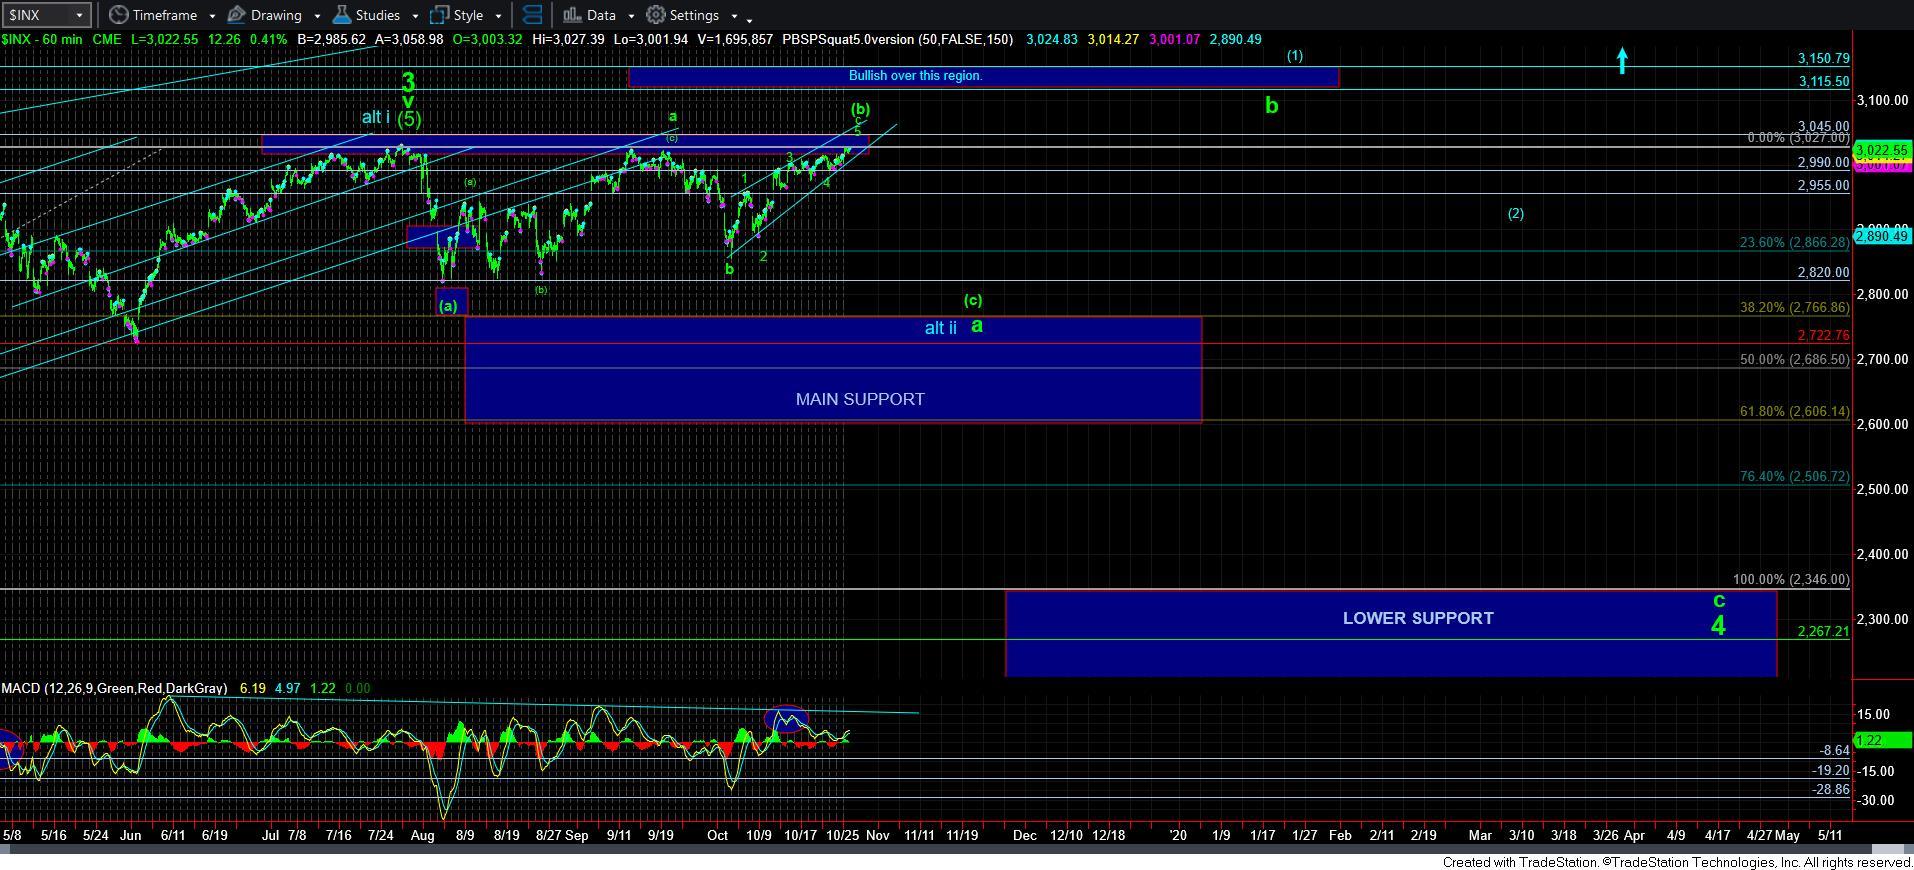
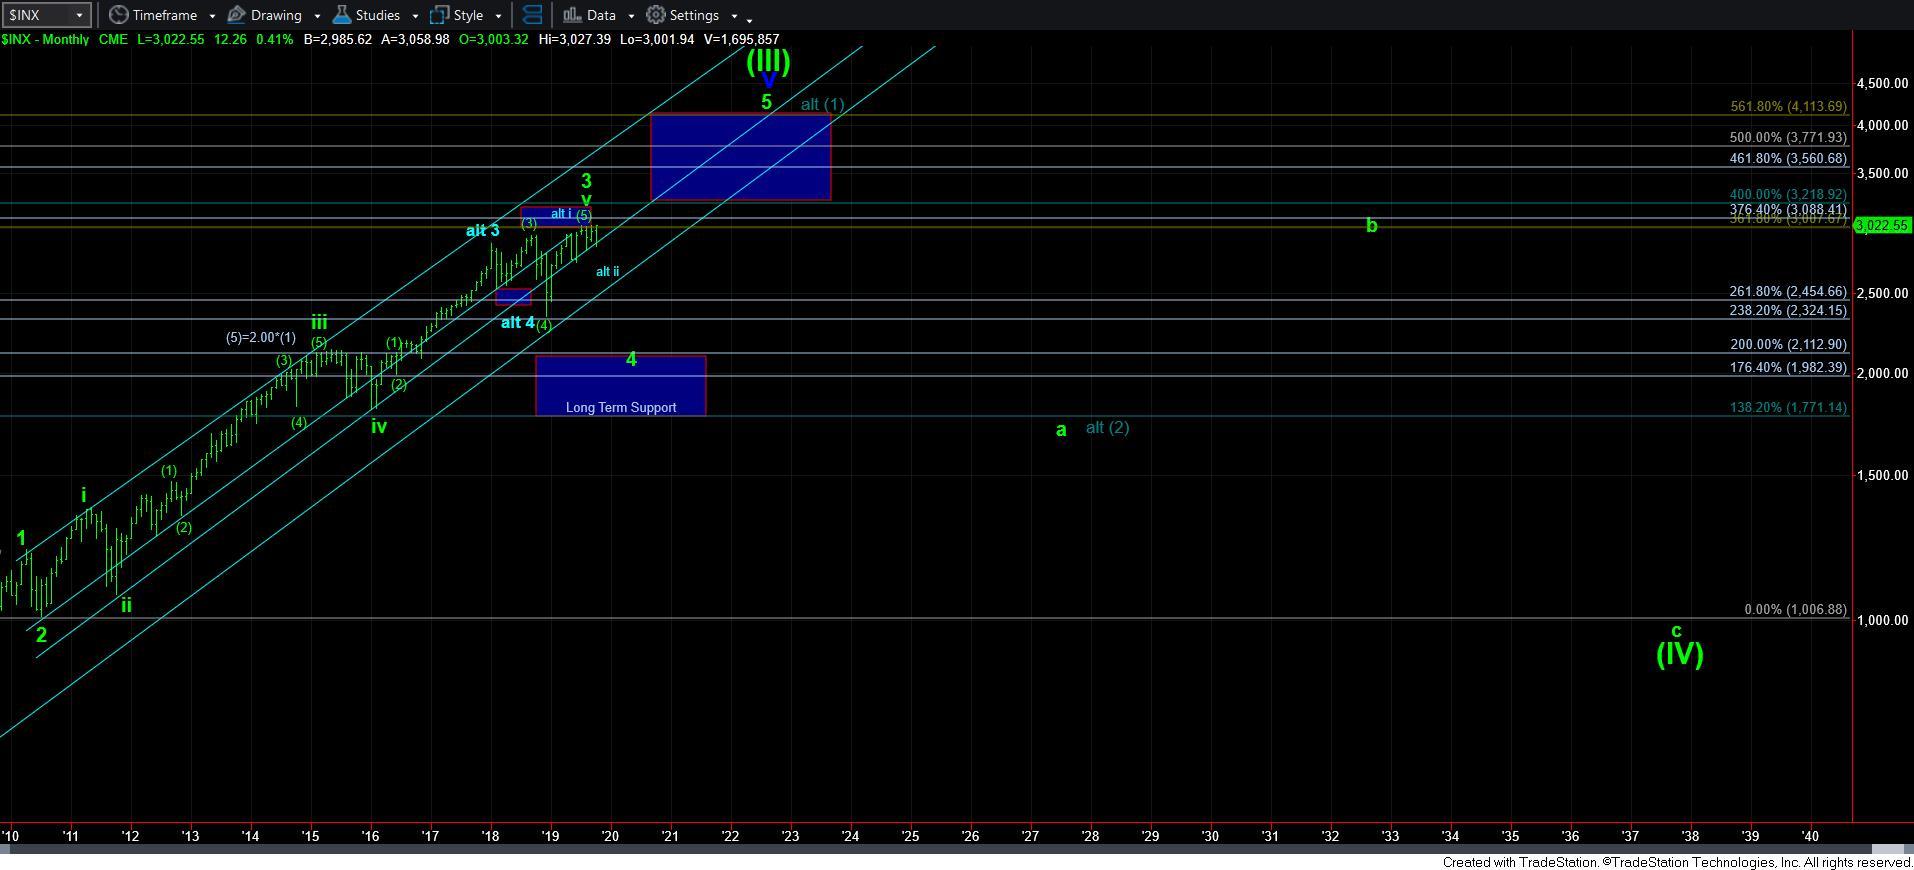
For those of you that followed my analysis for the last year, you would know that I expected at least a 20% correction to be seen in the market last year once we broke below the 2880SPX region. Before that correction began, my expectation was that the market could target the 2200SPX region. However, as we moved through the November time frame, I modified my downside expectation to the 2285-2335SPX region before I expected another rally to be seen. And, as we now know, the futures bottomed at 2316 before the expected rally began. Moreover, I provided my target for that rally before we even bottomed within the 2864-3011SPX region from the 2300 region low I was expecting.
As you can see in the attached chart to our members posted in early December of 2018, my a-wave bottom in my primary count was in the low 2300 region, followed by my b-wave rally expectations. Since that time, I have slightly modified my larger degree wave count, but the overall expectations remain the same for 2020.
The one thing that has changed is that we are taking longer than I had initially expected to top out in the much larger degree b-wave, as we have been chopping around within the rally target box I provided at the end of 2018. As it stands now, I still think we have yet to complete the a-wave, as we still need another drop to do so.
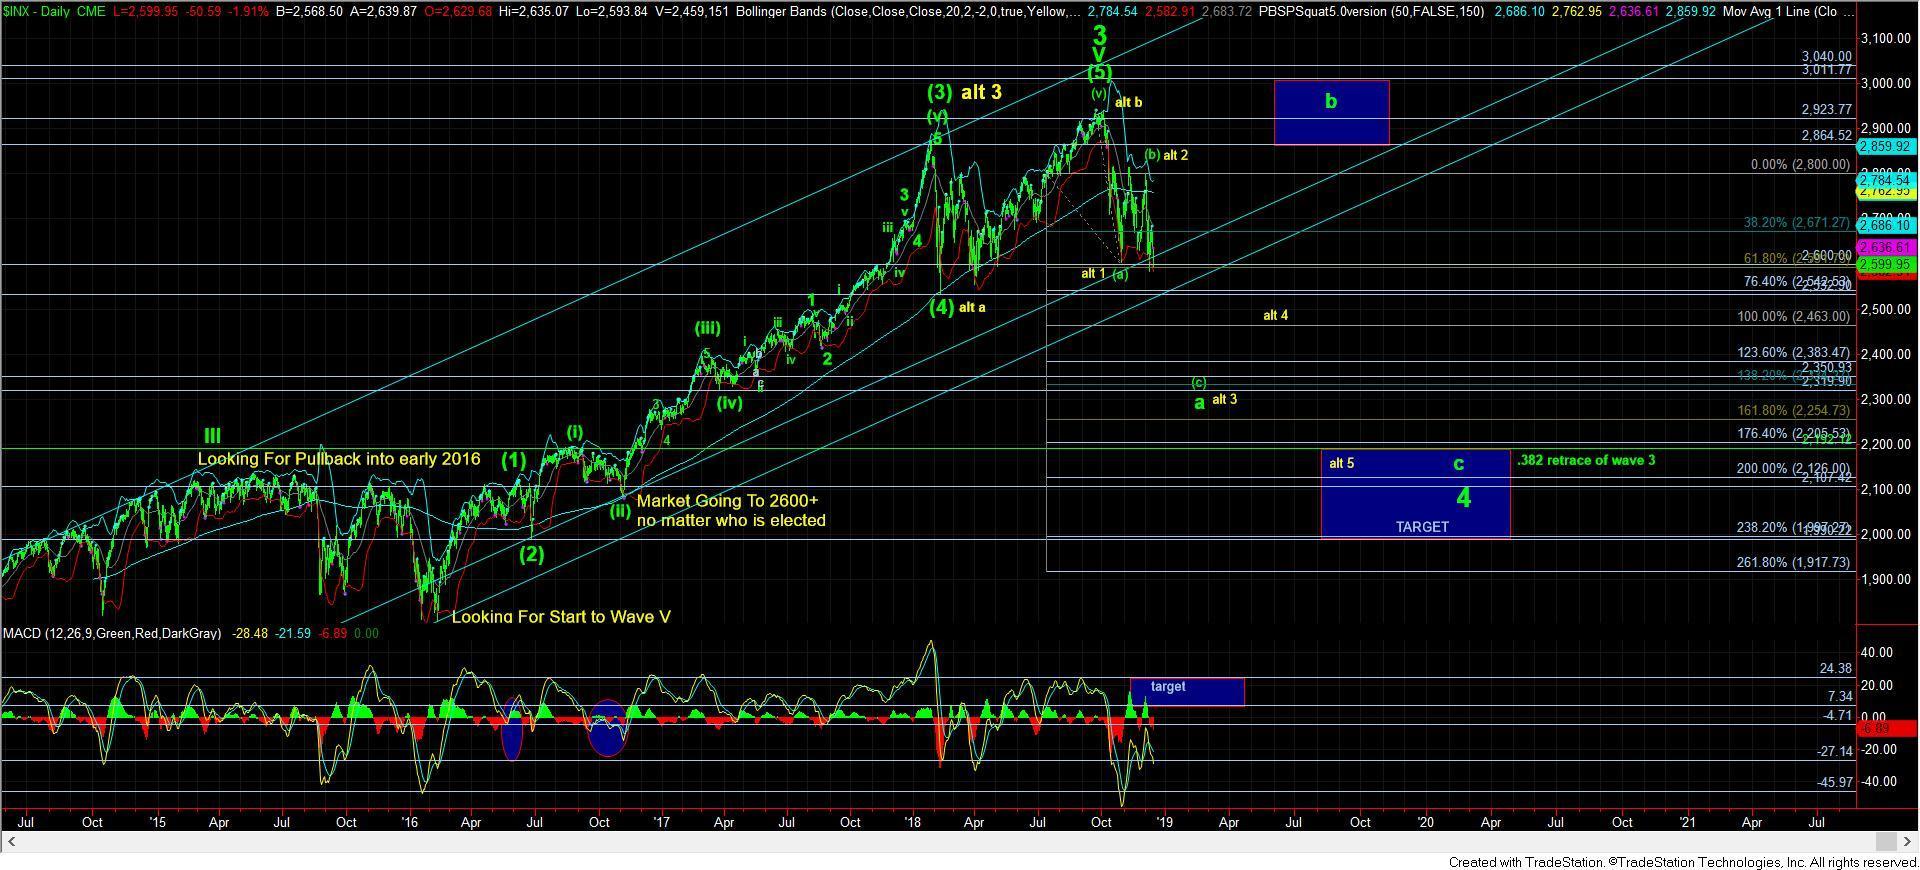
To that end, I would suggest you review the market action from October 2014 through the 2015 time-frame. While the October 2014 pullback in wave (4) of iii of 3 is similar to the wave (4) in wave v of 3, the action since that drop has been an almost perfect fractal copy of the action we have seen since that time. And, as I have outlined in my analysis from last week, I think the market can still maintain a relatively high-level consolidation in the SPX as we look towards the first quarter of 2020, even after we see the [c] wave drop towards the 2700-2800 region in the coming weeks to complete the larger degree a-wave.
While fractals do not always play out in the exact same fashion, I do want to also highlight that it took 11 months from the point the wave (4) ended until the point in time when the a-wave of wave iv ended in 2014-2015. Moreover, as you can see from that earlier fractal, the market moved back up towards the highs rather quickly in the b-wave of wave iv, which is what I outlined as my expectations last week in our current structure, which is why I think the next drop is a strong buying opportunity. Moreover, I even believe we have potential to make a new all-time high in the next b-wave rally unless the SPX significantly lags my expectations to be seen in the IWM.
And, lastly, please also note that while my minimum target for the [c] wave of the a-wave down that I expect is the 2820SPX region, the drop in 2015 well exceeded that type of move. Moreover, the [c] wave of the a-wave in 2015 was a very strong and fast plunge, and I see the potential for the same to occur here. Therefore, I retain an expectation that 2820 should be a minimum target for the [c] wave decline I expect in the coming weeks, with potential for much more to be seen.
So, let’s move into our current market structure.
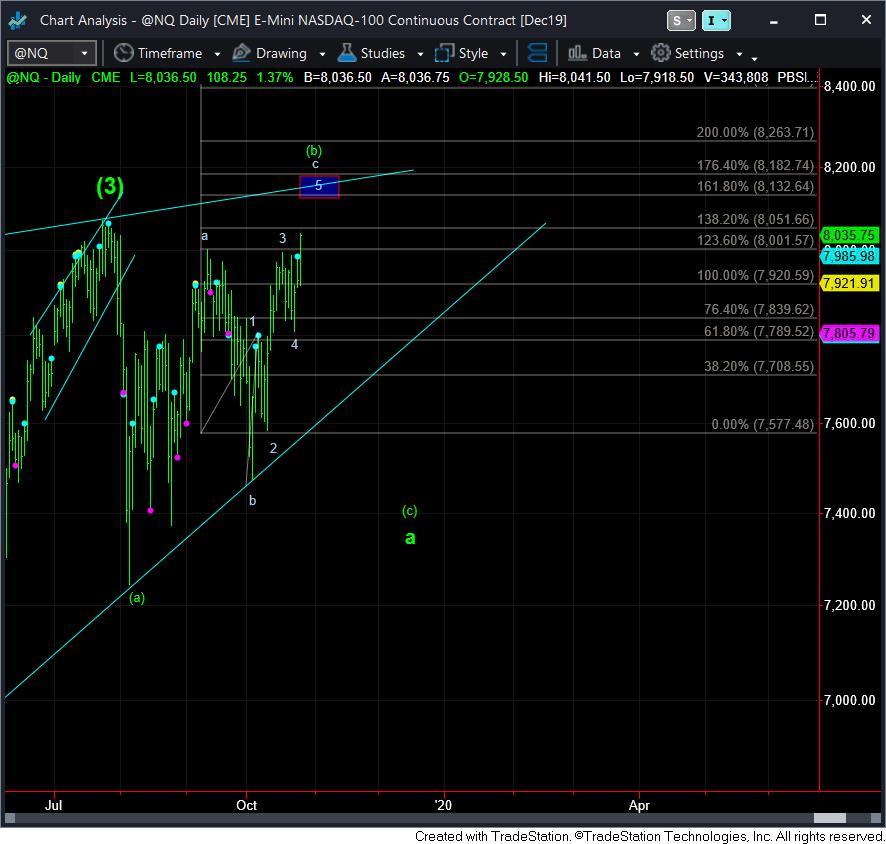
This past week, I did something I don’t do all too often – I took a peek at the Nasdaq chart to see if it would tell me anything different than I am seeing in the other charts. And, it also supports my expectations across all markets. As I discussed in my live video this week, as well as in the charts I was posting this week, the NQ seems to now be completing a 5th wave in the c-wave of its [b] wave rally as well.
As far as the IWM is concerned, it seems to be filling out a nice a-b-c rally for the [e] wave of this b-wave triangle. In fact, a=c is just over the 156 region, wherein the .764 retracement of the [d] wave down also resides.
And while the market can still see another push higher in the coming week, most of what I am seeing suggests we are finally ready to top out in this larger degree [b] wave. This [b] wave has now taken 3 months to complete, but we now should finally be in the last “squiggles” within the c-wave of the [b] wave.
In the coming week, my upper support now resides in the 2975-2990SPX region. It would take a break down below that support with follow through below 2955SPX to point us towards at least the 2820SPX region for the [c] wave of the a-wave I have been tracking. And, should we see a corrective pullback in the coming week down to the 2990SPX region, it would make me consider one more push higher to the 3040/45SPX region over the next week or two before this [b] wave rally tops out.
However, should we break our upper support, be prepared that we may see a fast and furious follow through below the important 2955SPX region ultimate support for this rally, especially if the market follows its 2014-2015 fractal copy.
Overall, the market is stuck in a region wherein it has potential for 30% higher levels to be seen from here over the coming years, but it also has 30% potential downside which can be seen from here before we begin a rally towards those higher targets. That means we are truly “stuck in the middle.” And, it certainly has felt like it.
Yet, it will likely take several more months before the market makes its intentions clear as to whether we are going to rally to that 3800-4100SPX region sooner rather than later. My analysis right now still points to later rather than sooner, but I will retain an open mind based upon what I see in the rally I expect into the first quarter of 2020.