Is This Downside Done In Metals?
I am not sure that there is a one word answer to the question asked in the title of the article, but if I had to use one word, I would say the answer is much closer to “no” than yes.
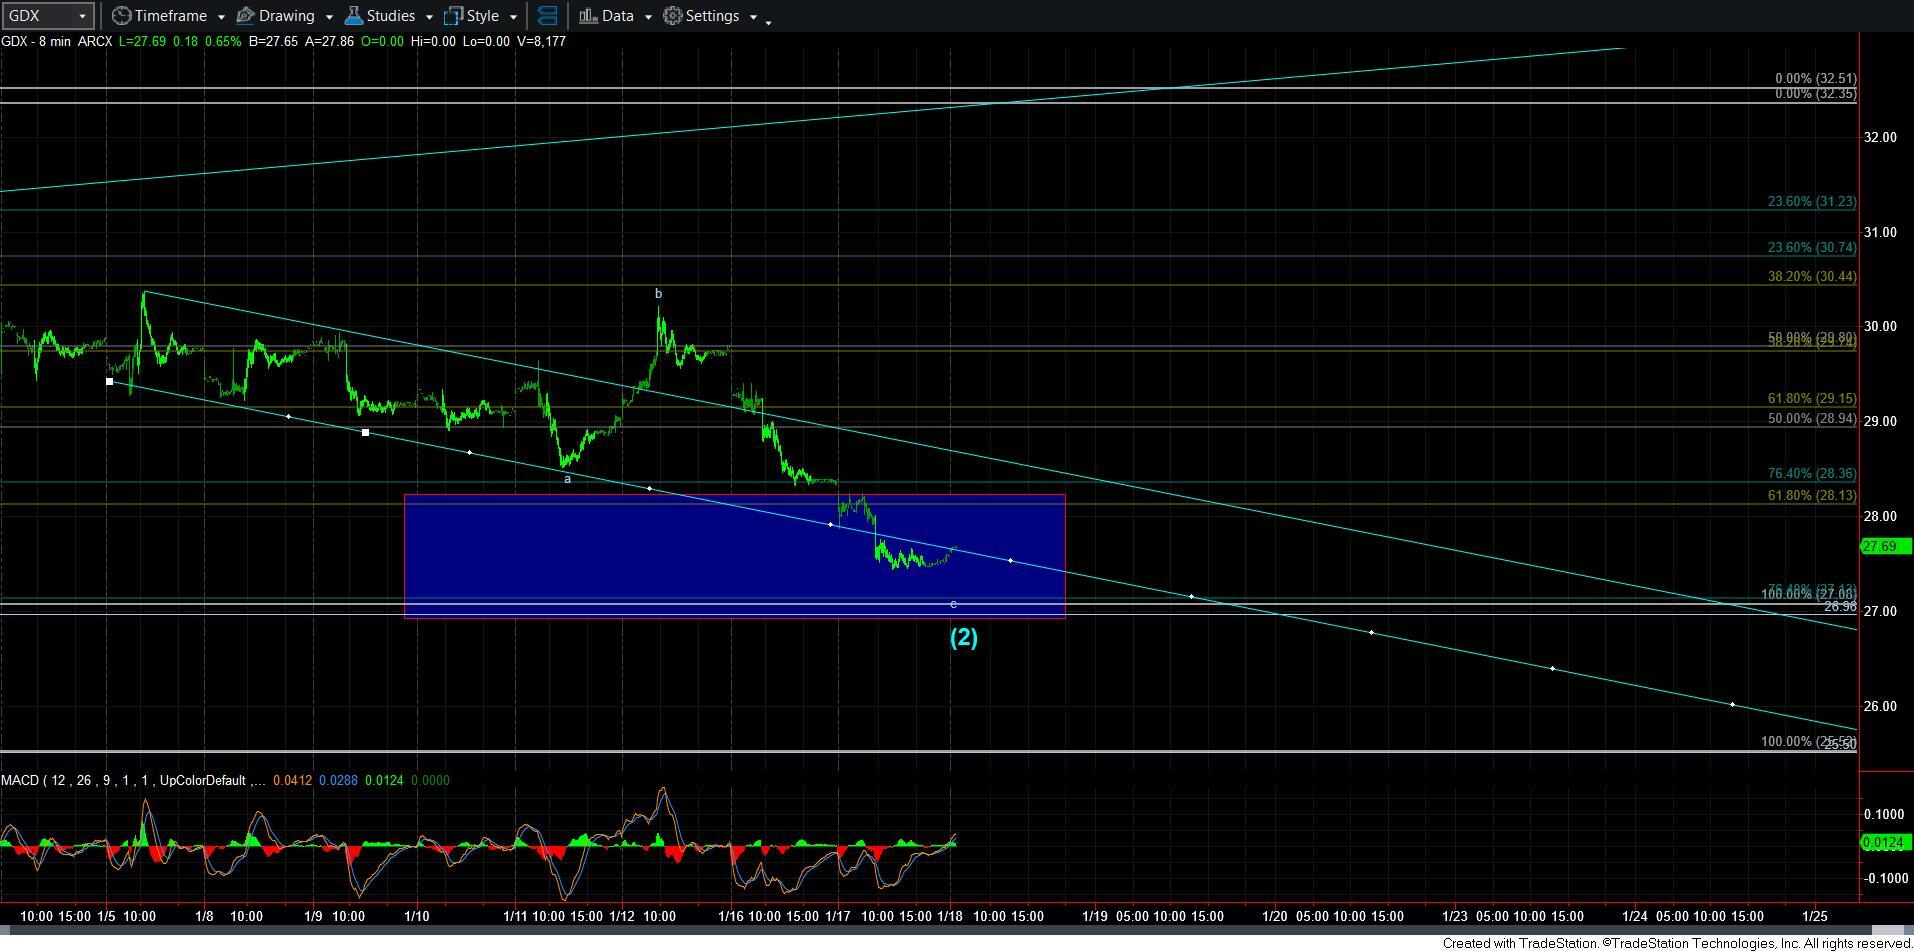
The main reason I say that is that it seems that GDX is closer to a bottom than the other charts. In fact, there is the minimum number of waves in place for a bottom to be struck in GDX, but I would probably view the bounce we are seeing this morning more in line with a 4th wave bounce in the c-wave. Therefore, there is a reasonable expectation to see another lower low, and potentially even test the lower end of the support box.
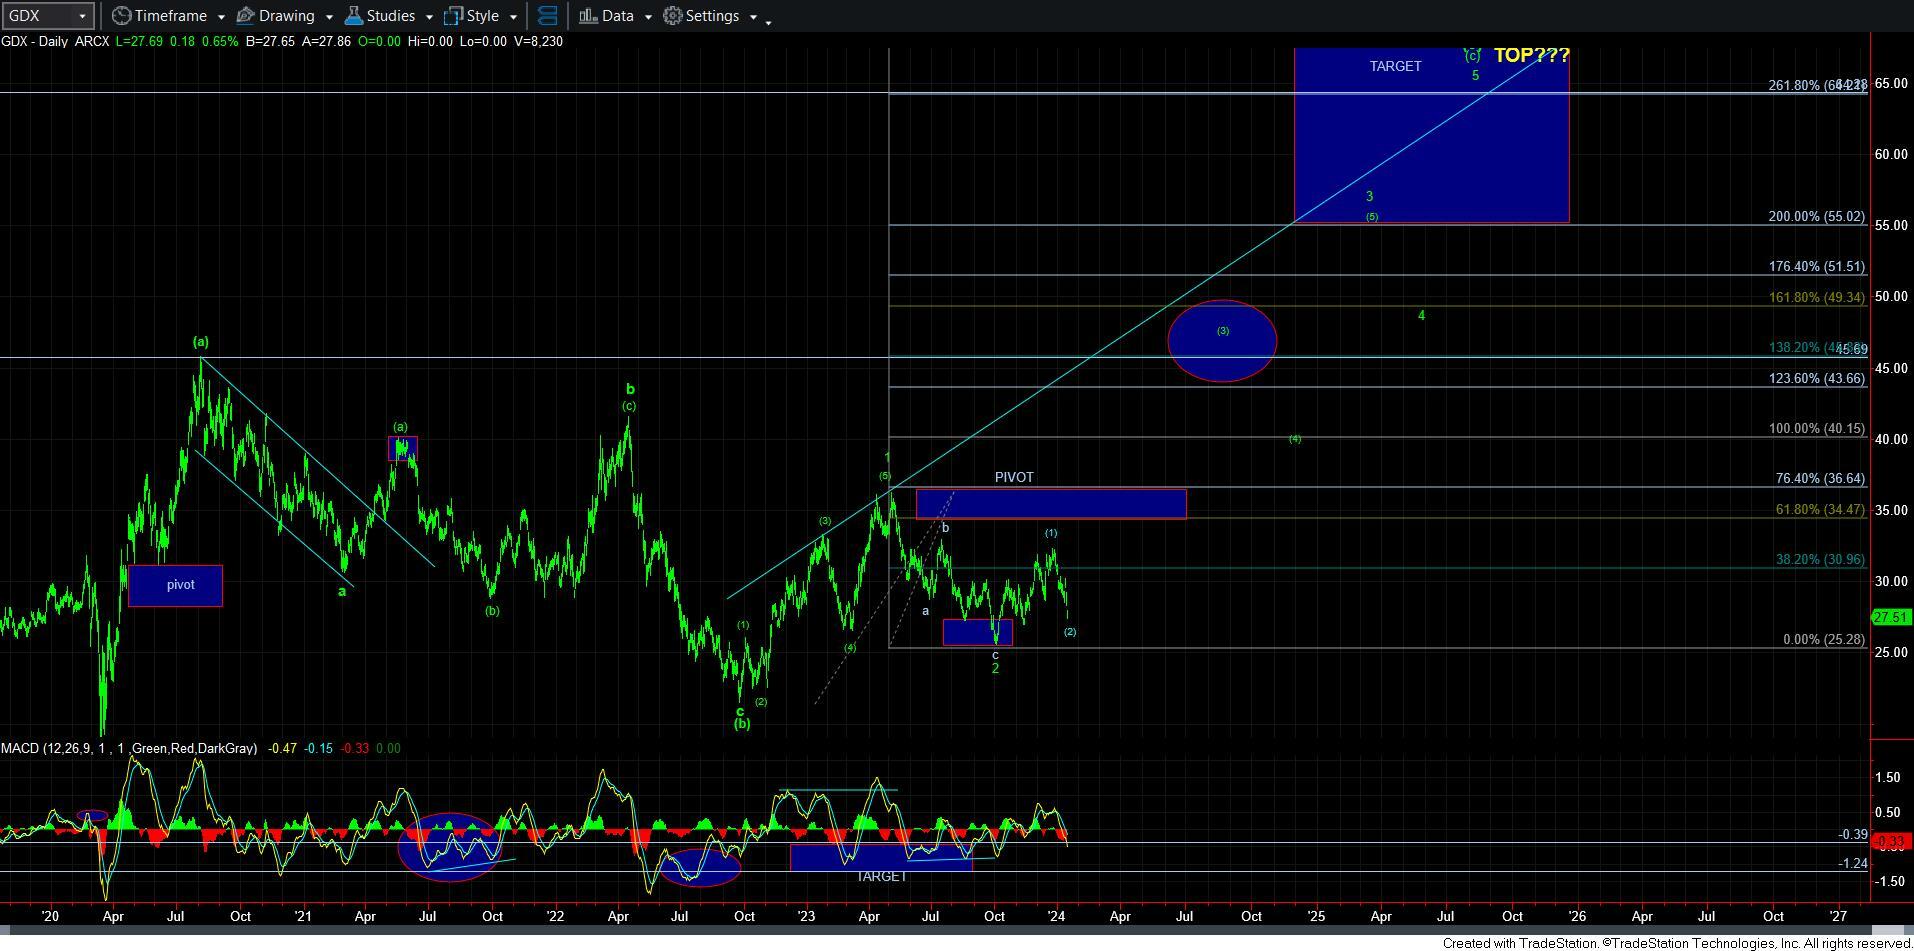
But, please remember that I still want to see a 5-wave rally through 30.25 to signal that wave [3] in GDX has begun.
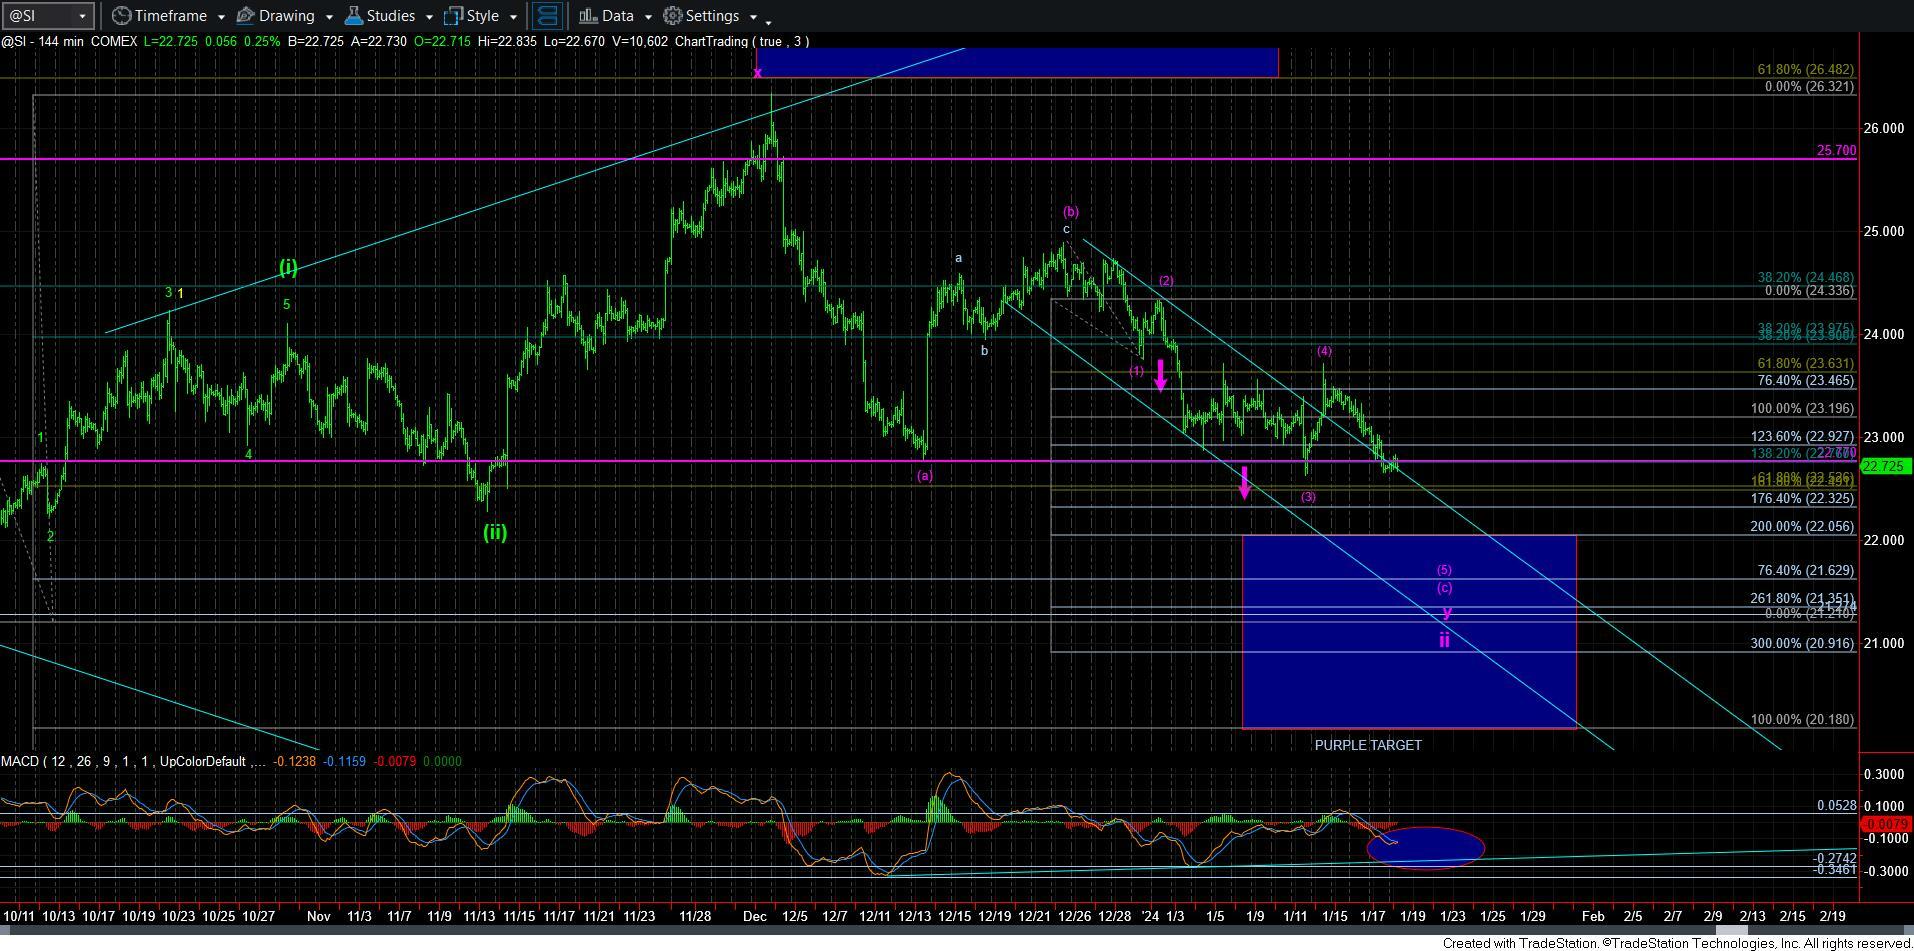
In silver, I would also say it seems likely that we need lower before this is completed in the purple wave ii. But, I want you to watch the MACD very carefully. It is showing us a typical and textbook bottoming pattern. You see, not only are we seeing positive divergence in the [c] wave relative to the [a] wave, but we are starting to see that positive divergence we normally see as the 5th wave of the [c] wave is bottoming. When the MACD on the 144-minute chart turns green again, we will have either have struck a bottom or are VERY close.
GLD is a bit more problematic. As I have said many times, when we get standard 5-wave Fibonacci Pinball structures for [c] waves, it often makes identifying a bottom much easier. However, when we have overlap as we are seeing currently, it adds a much higher degree of complication and it causes me to consider a number of options.
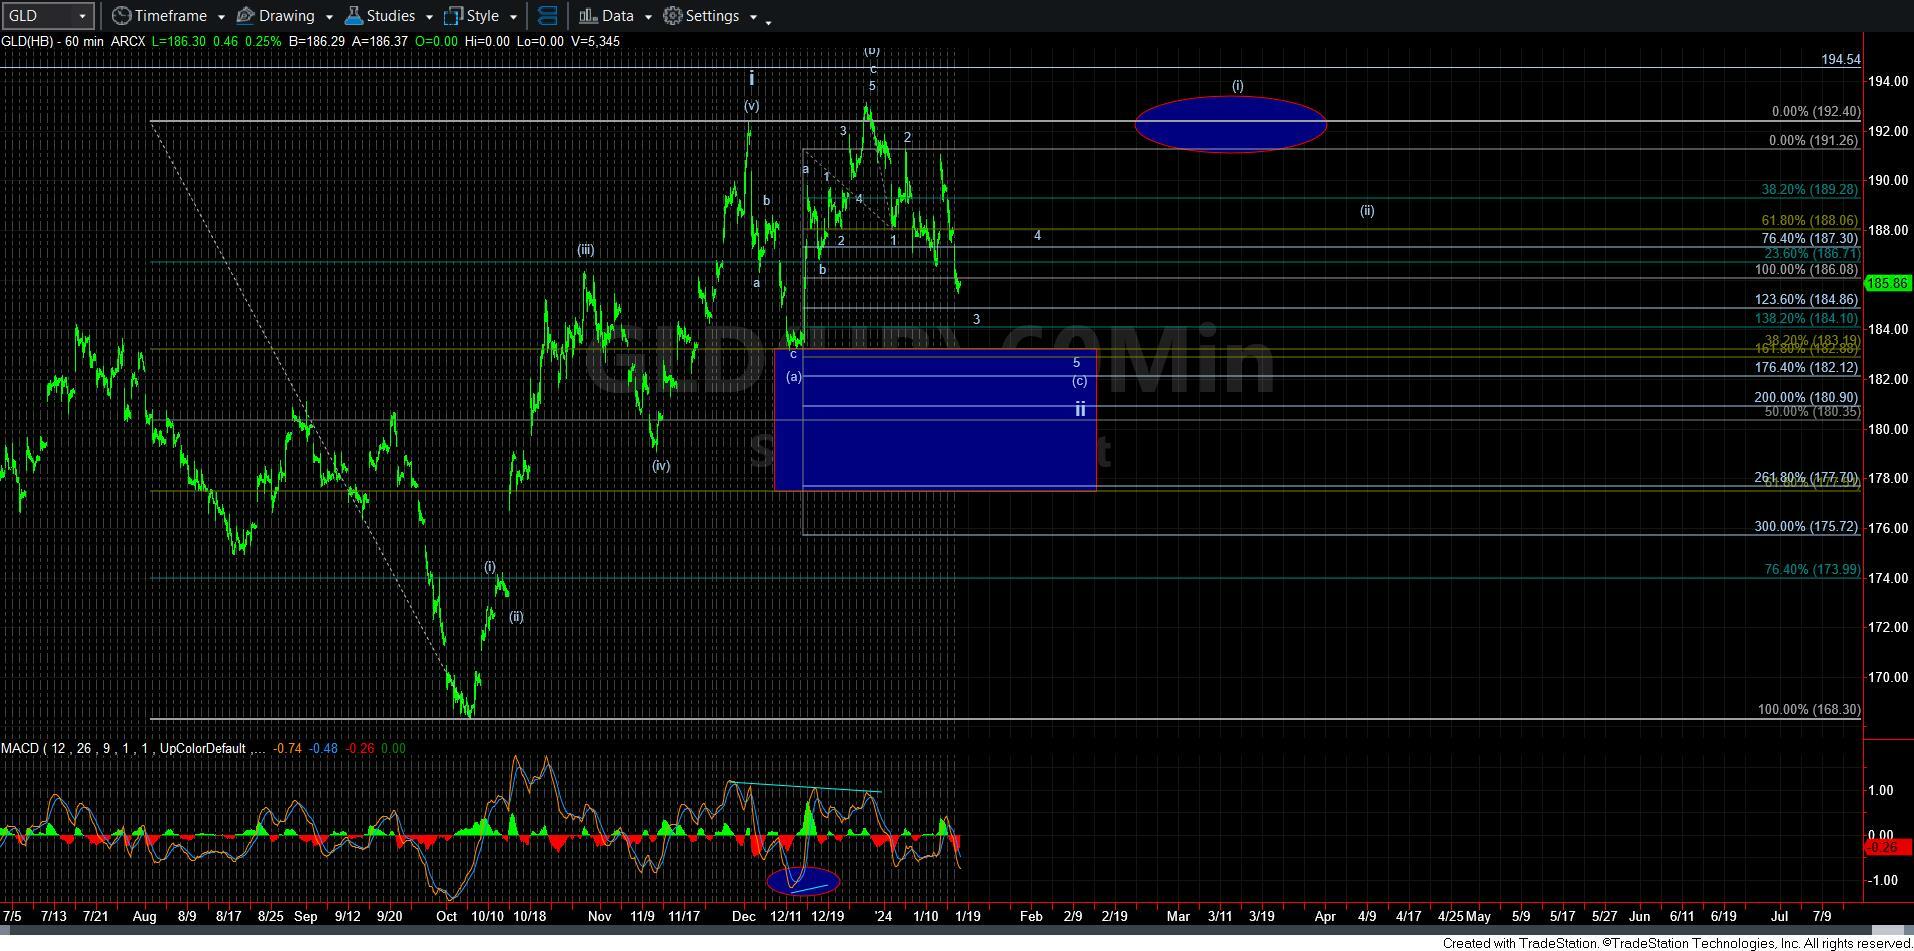
As you can see in the 60-minute GLD chart, my primary count has us completing wave 3 in the ending diagonal structure for the [c] wave, and we have some close to the 1.236 extension target for wave 3 in the ED, the typical target we see in an ending diagonal. That means we can still see a rally back to the 188 region (as diagonals often see overlap between waves 1 and 4) before we see a final 5th wave lower low and completion to this [c] wave. And, ideally, we really should be approaching the support box one more time.
But, due to the complexity involved in overlapping structures such as this, there is some potential that we are actually bottoming in the current lows we are striking as a more complex w-x-y pattern, which is not being shown. The reason it is not being shown is because I really do not think it is highly likely for a number of reasons. Therefore, I am maintaining my current primary count as shown.
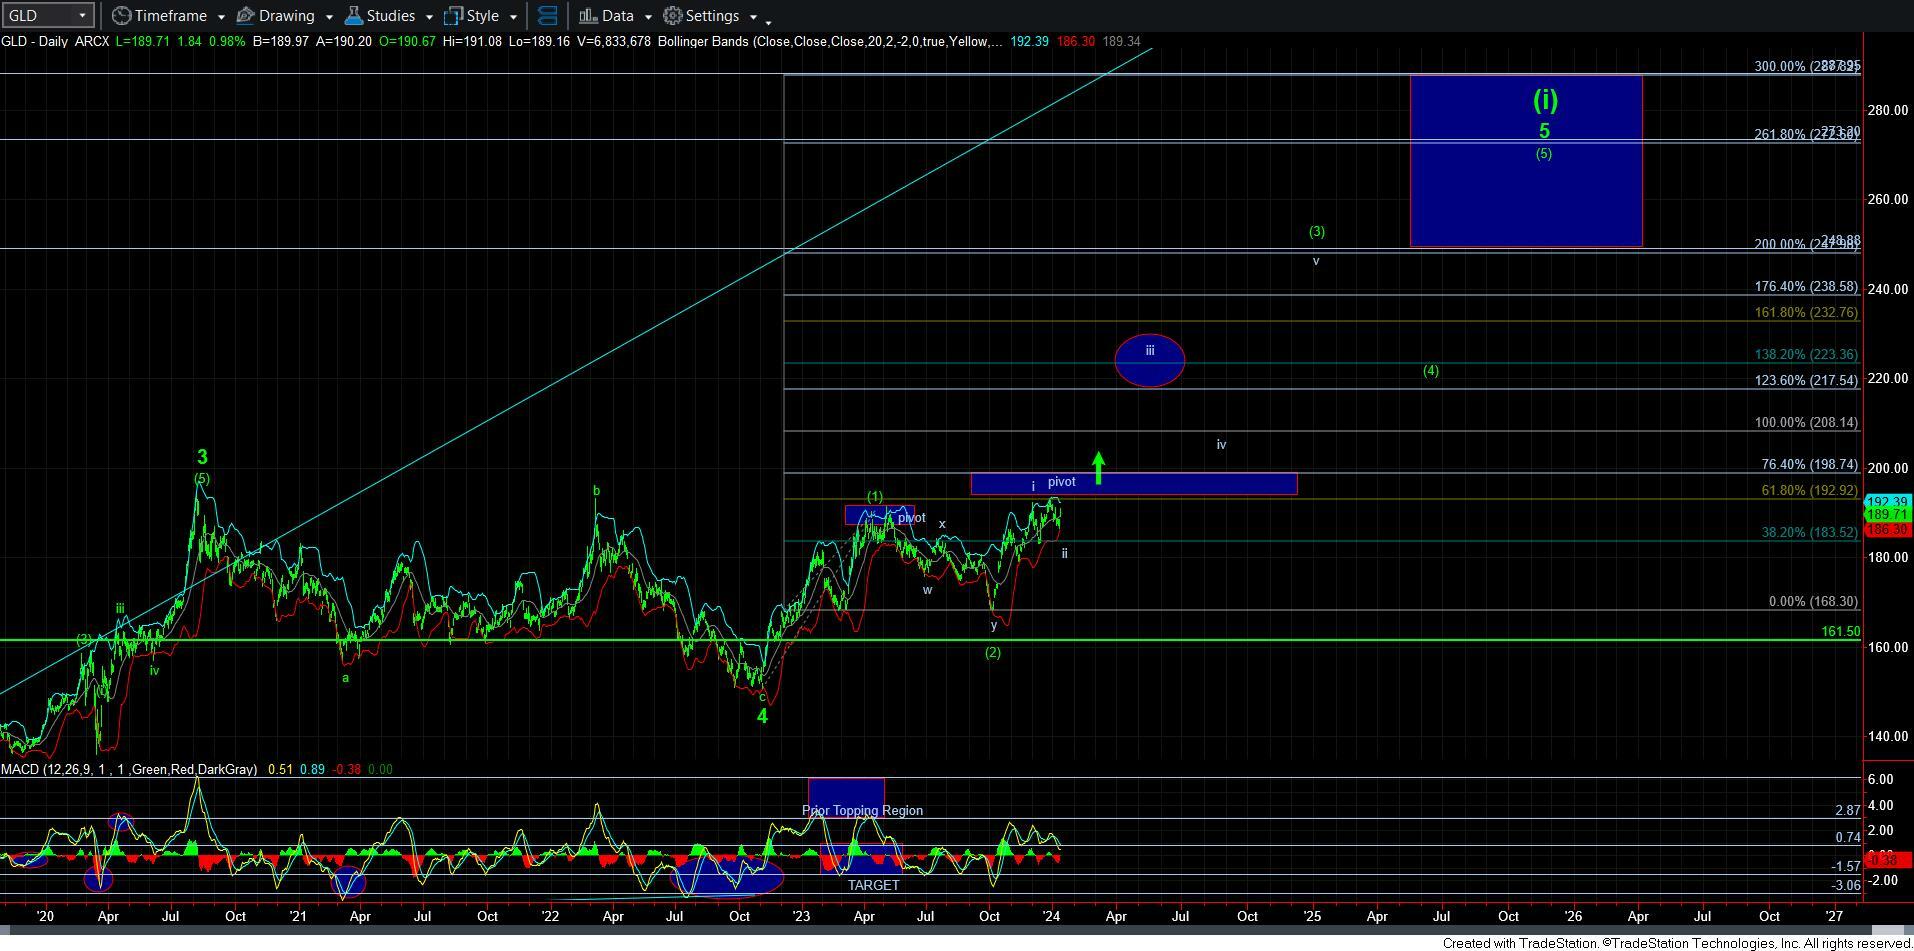
Of course, if we see a 5-wave rally taking us back to the wave [i] target ellipse before we complete the downside structure as shown, I will likely have to adjust my view and prepare for the 3rd wave break out sooner rather than later. But, please do keep in mind the bigger picture, as that next 5-wave rally will put us on a major “break-out-alert,” as it would be seeing up the heart of the 3rd wave rally this year.
Overall, it would seem that we are should be getting very close to the completion of this current downside structure based upon both the structure of the decline and the technicals, with GLD seemingly needing a bit more work to the downside to complete its ideal structure.