Is That A Triangle?
If you have been following me closely of late in the metals, then you would know that I am watching the silver chart quite intently to identify whether the market has actually bottomed and begun its next major rally phase. So, I continually look for clues as to whether the market has bottomed from the silver chart.
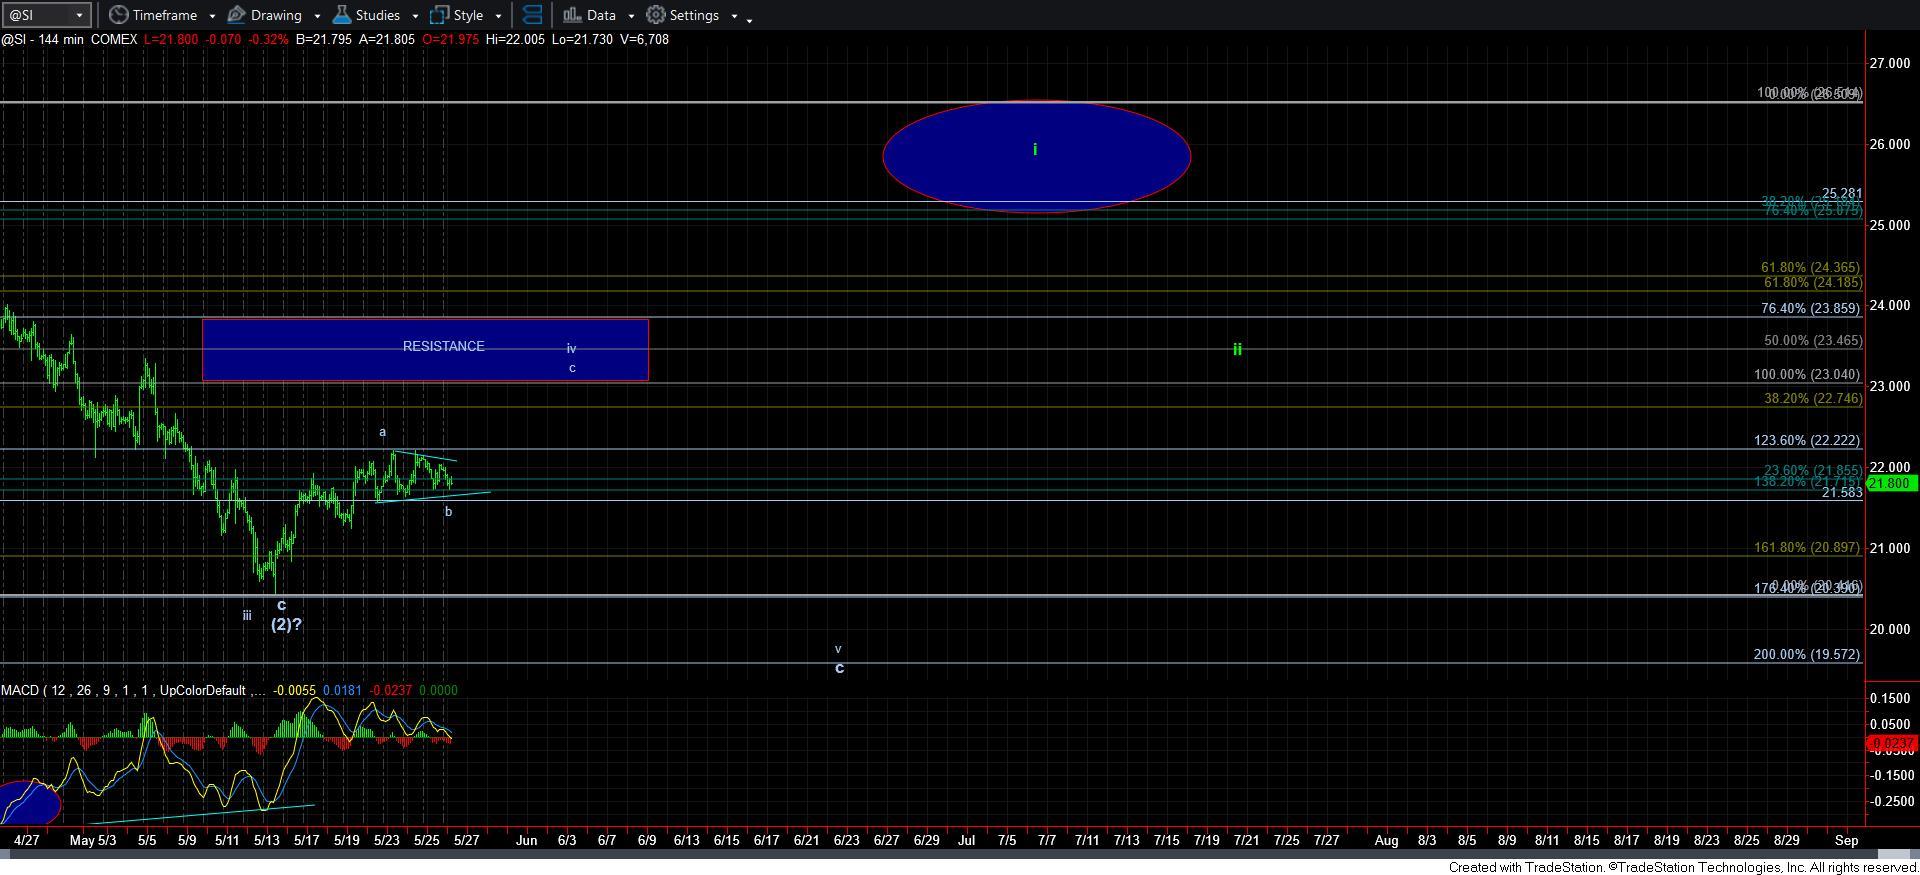
In my last updates, I outlined how we have seen three 5-wave structures develop off the lows, and there was several ways to count that structure. But, now, we may have developed a triangle, as you can see from the 144-minute chart. Now, triangles most likely take shape in a 4th wave or a b-wave, but not in a 2nd wave. Therefore, out of the two potentials, I am assuming this could be a b-wave triangle we are seeing.
Now, silver is known for developing what seemingly looks like a triangle, but, more often than not, experience has shown me that it will usually break down rather than actually being a triangle. You see, a triangle often presents us with a consolidation structure before the market continues in the direction from which the triangle began. So, since the market has been moving up off the recent lows, it would suggest that if the triangle form holds, then we continue higher in a c-wave within wave iv.
So, the question will be if silver can hold the 21.58 level. If so, then we have to primarily count this as a b-wave triangle, with the expectation that a c-wave will take us to the resistance zone overhead. However, if we break down below 21.58, then the nature of that break down will tell us if we are on our way to a lower low or if this 4th wave is just going to take another twist.
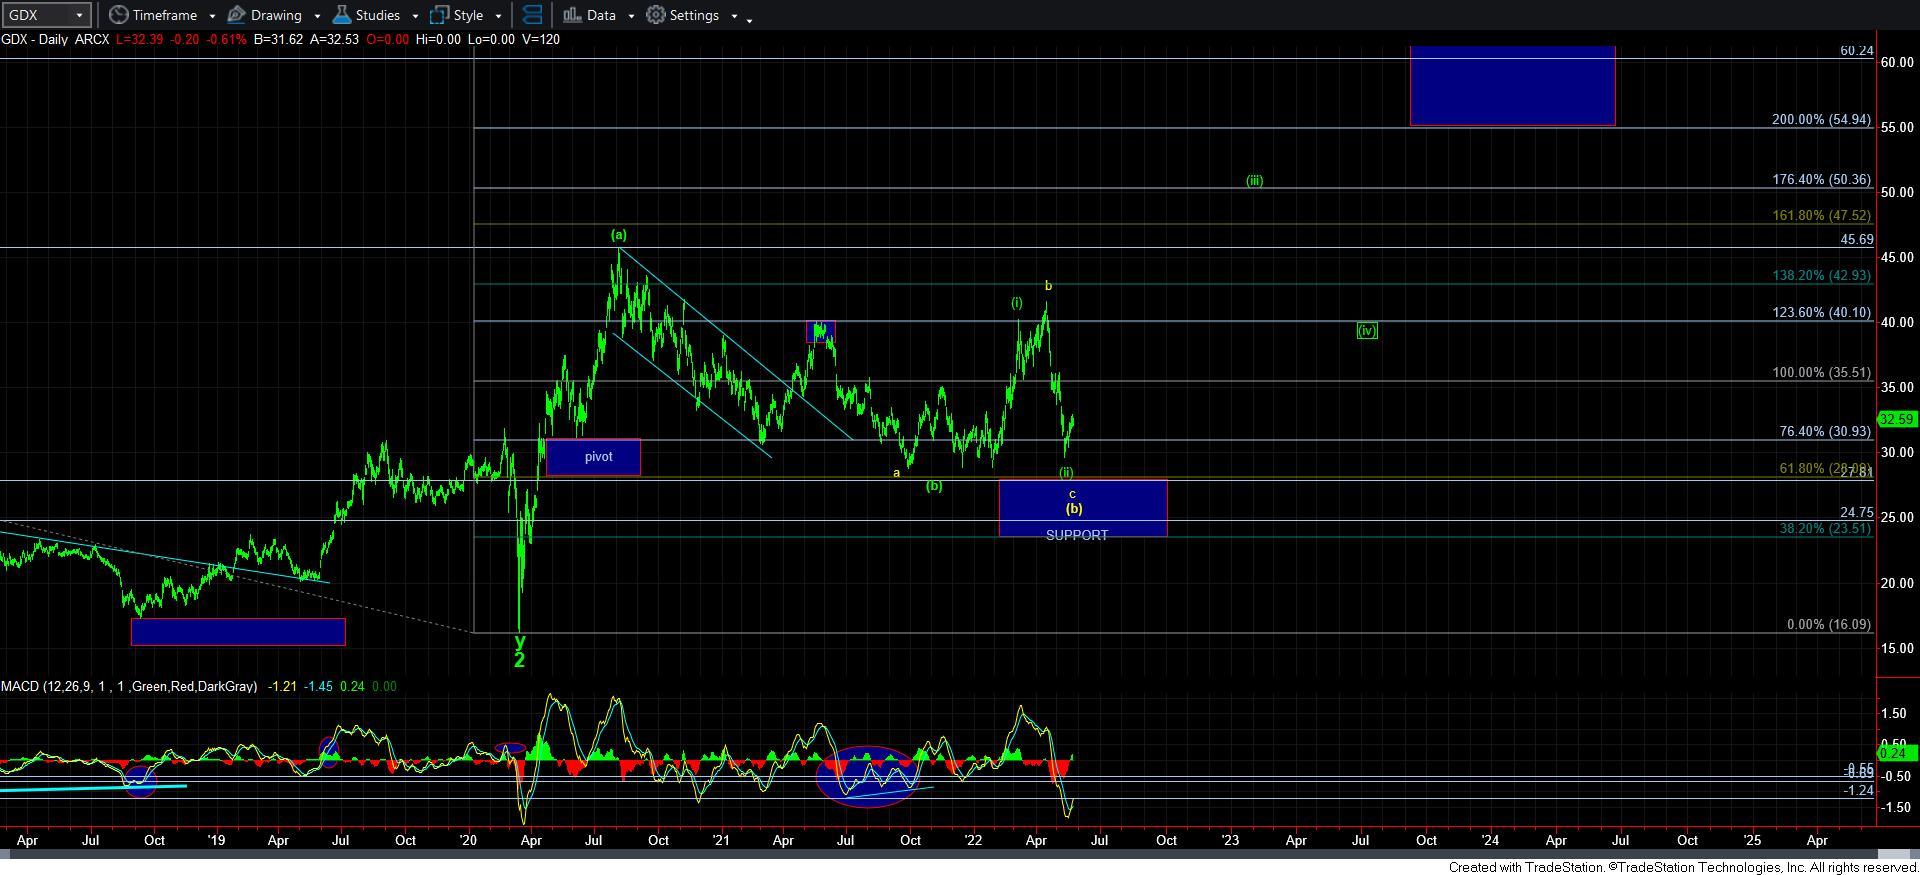
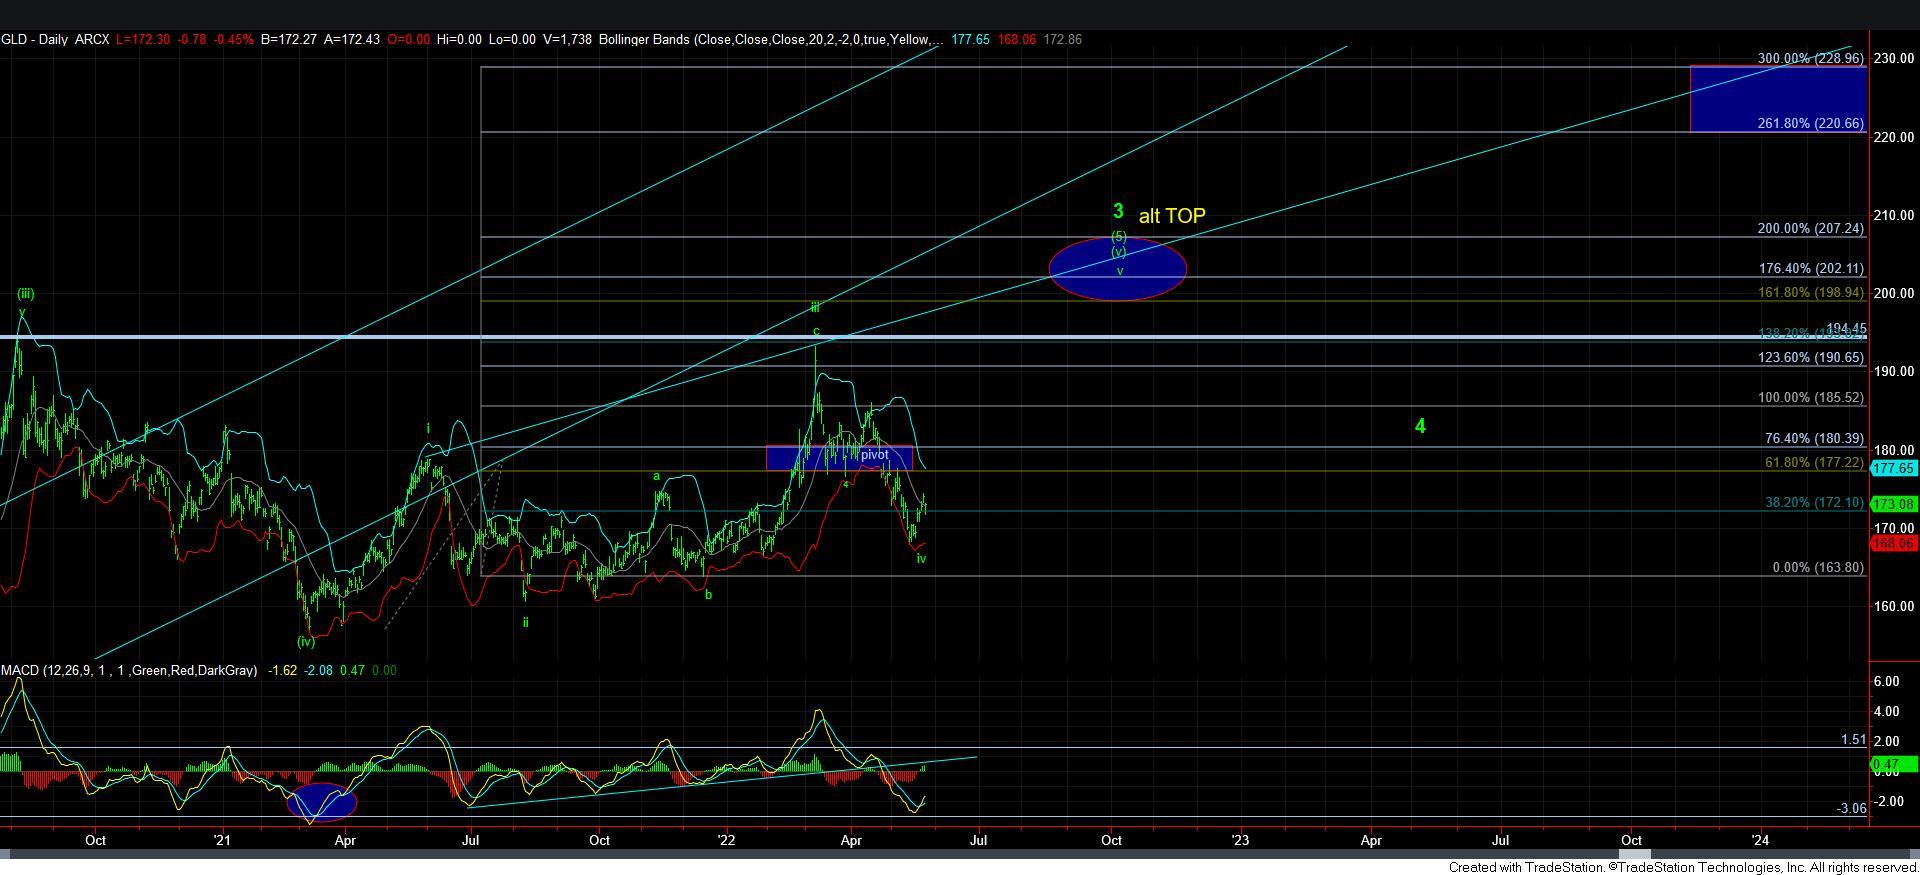
As far as GDX and GLD, I am still of the same position that they are still both in a larger degree diagonal structure, which will continue to provide us with relatively unreliable structures while they continue higher towards their next targets overhead. However, as noted before, if GDX does see a lower low, then it can re-set its count, and potentially provide us with an impulsive rally structure which will be more easily tradeable.
So, for now, I am still not convinced that the metals market has indeed bottomed due to the silver structure. And, I will continue to look for clues that will either confirm or reverse that perspective.
The last point I want to highlight is that both the GDX and GLD daily charts have seen their MACD turn up. That happens when the price structure has either bottomed, or that this rally is a 4th wave in this current decline, with a 5th wave lower low to be seen in price, whereas we see a positive divergence bottom in the MACD. And, if we do see a lower low, that would be a higher probability buying opportunity. But, overall, the market is close to completing this downside structure, if it has not already completed.