Is That 5 Up?
When I was a kid, I used to drink a soda called 7-UP. Now, as an adult, I play a game called 5-UP.
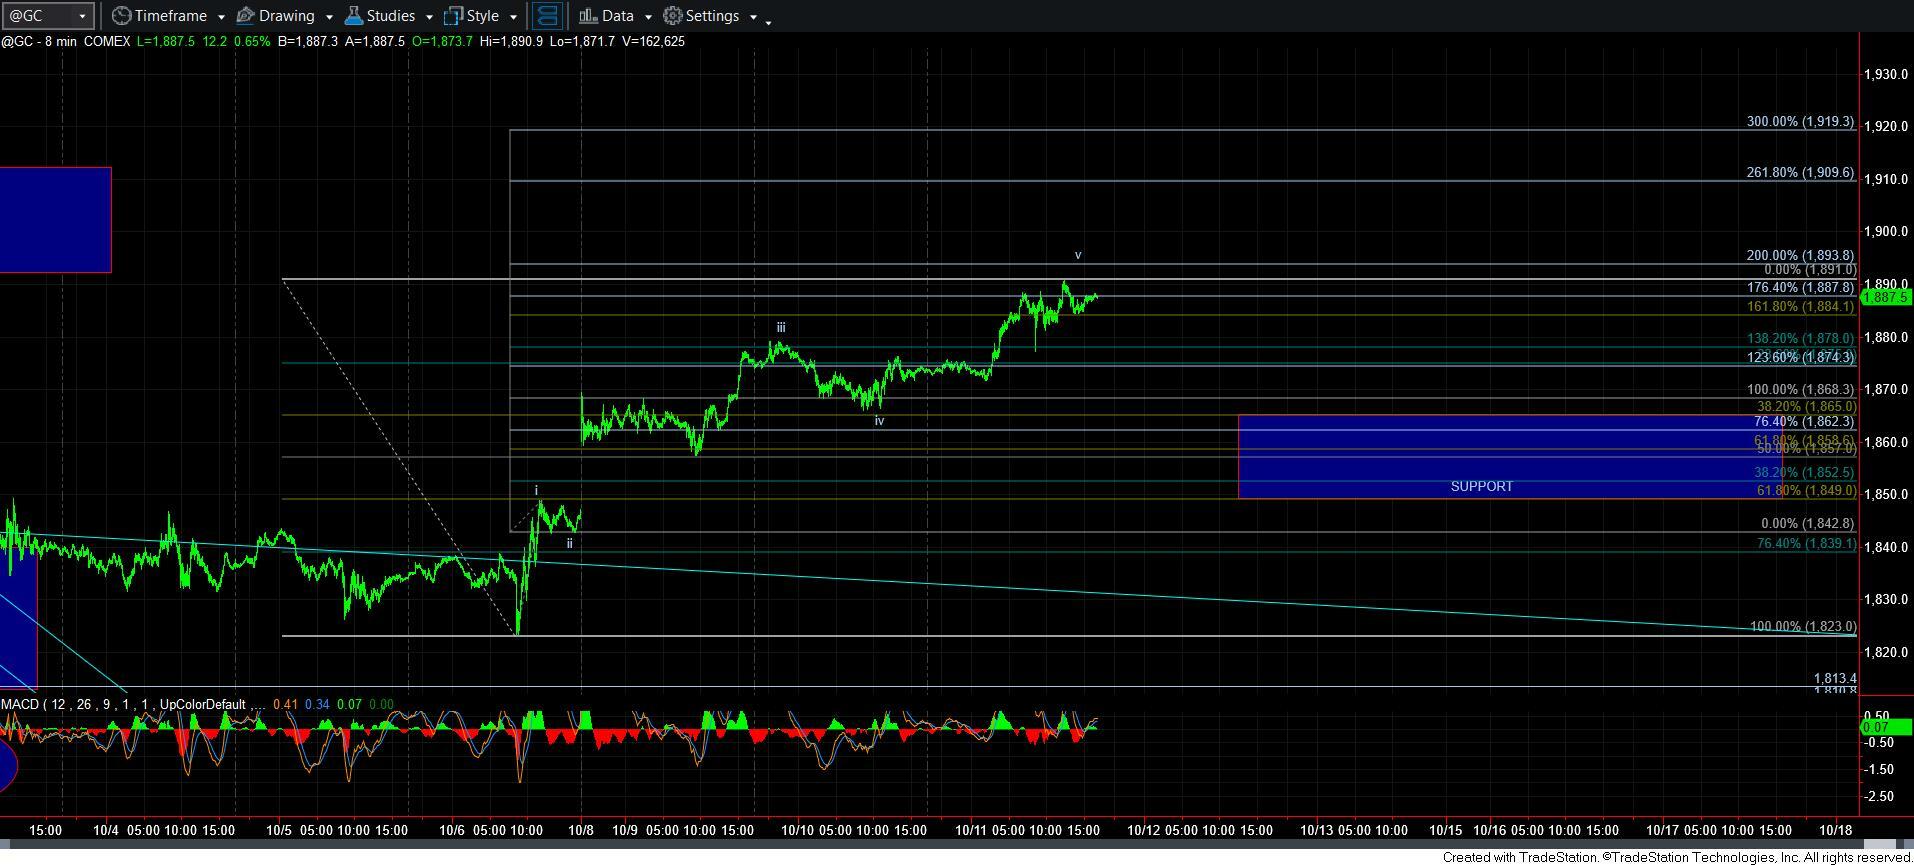
Well, we know we have very clear parameters for our game of 5-UP. In fact, we have very specific levels we want to see struck within our Fibonacci Pinball structure.
So, while I can count 5-UP in gold, I have to also note that the levels it struck during this seemingly 5-wave move was not anywhere near what we normally see during a gold rally. Normally, 3rd waves will strike levels north of the standard 1.618 extension, sometimes even seeing 2.618-3.618 extensions. Yet, the rally we are now tracking barely made it past the 1.382 extension for its 3rd wave.
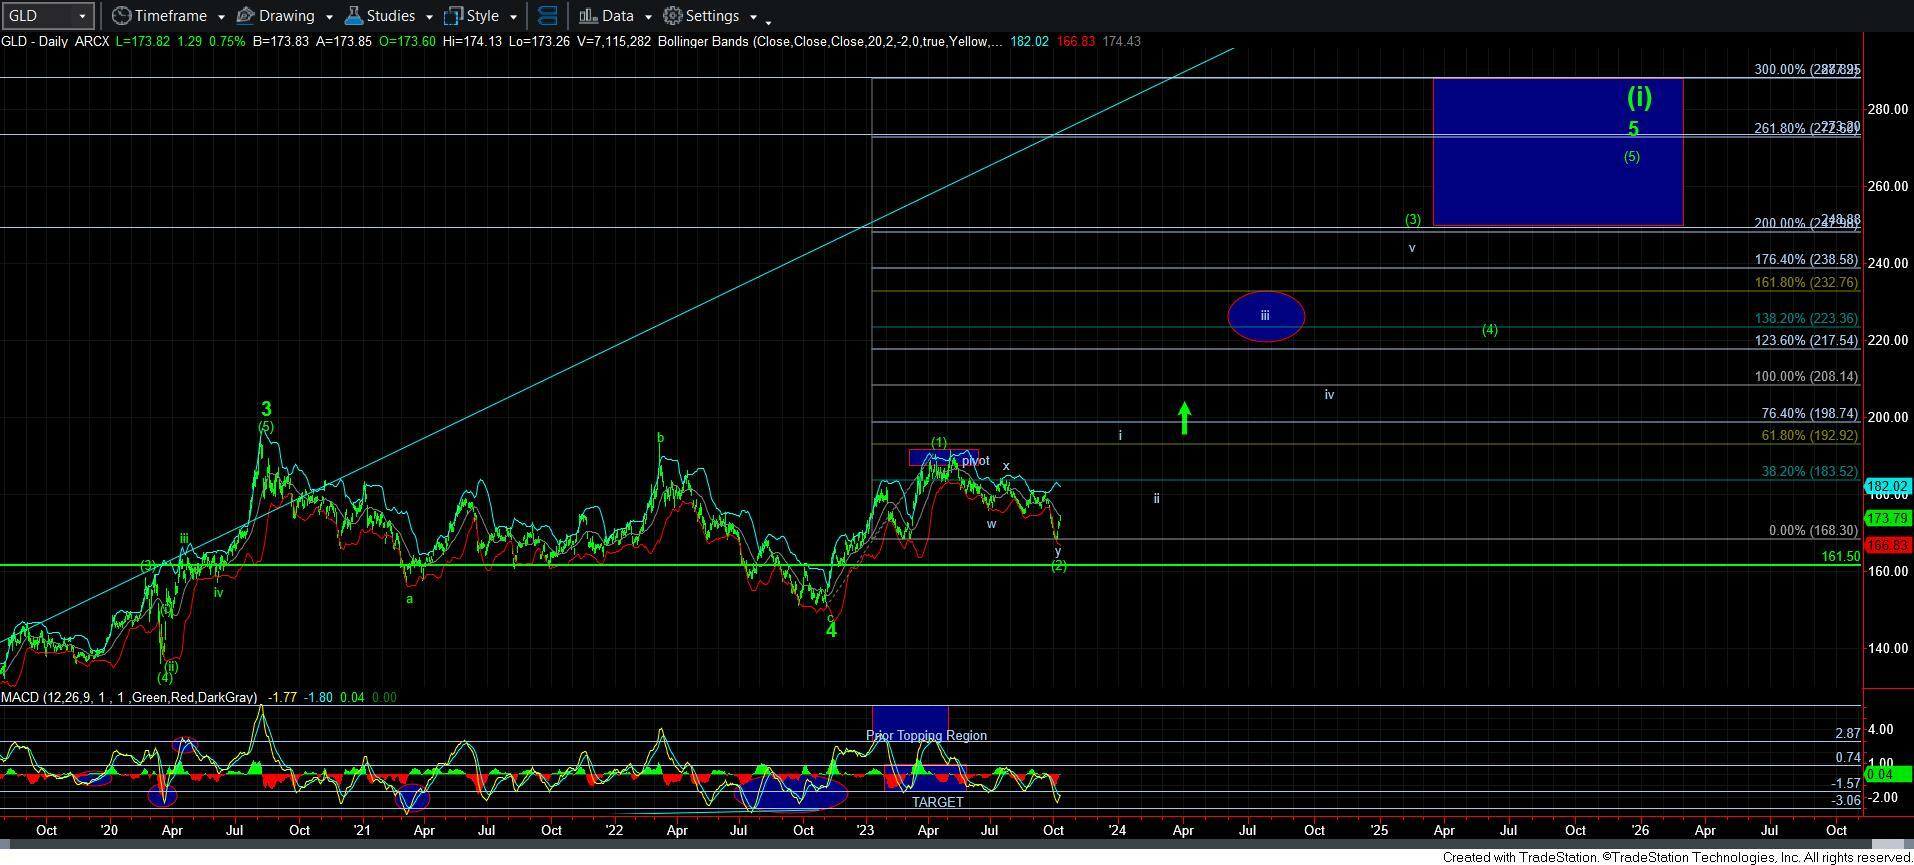
Another issue I have with viewing the pullback in GLD as being complete is that there was absolutely no positive divergence on the daily chart. That is certainly not something that will disqualify a potential bottom being struck, as we have seen that happen before. But, in addition to that, I have to rely upon a less common w-x-y pattern for a bottom.
But, nonetheless, it is 5 waves up. And, I am going to treat it as such. Yet, I am going to be watching the structure VERY carefully going forward. For if I see anything else out of the ordinary or unusual, I am going to turn VERY cautious about trusting the rally.
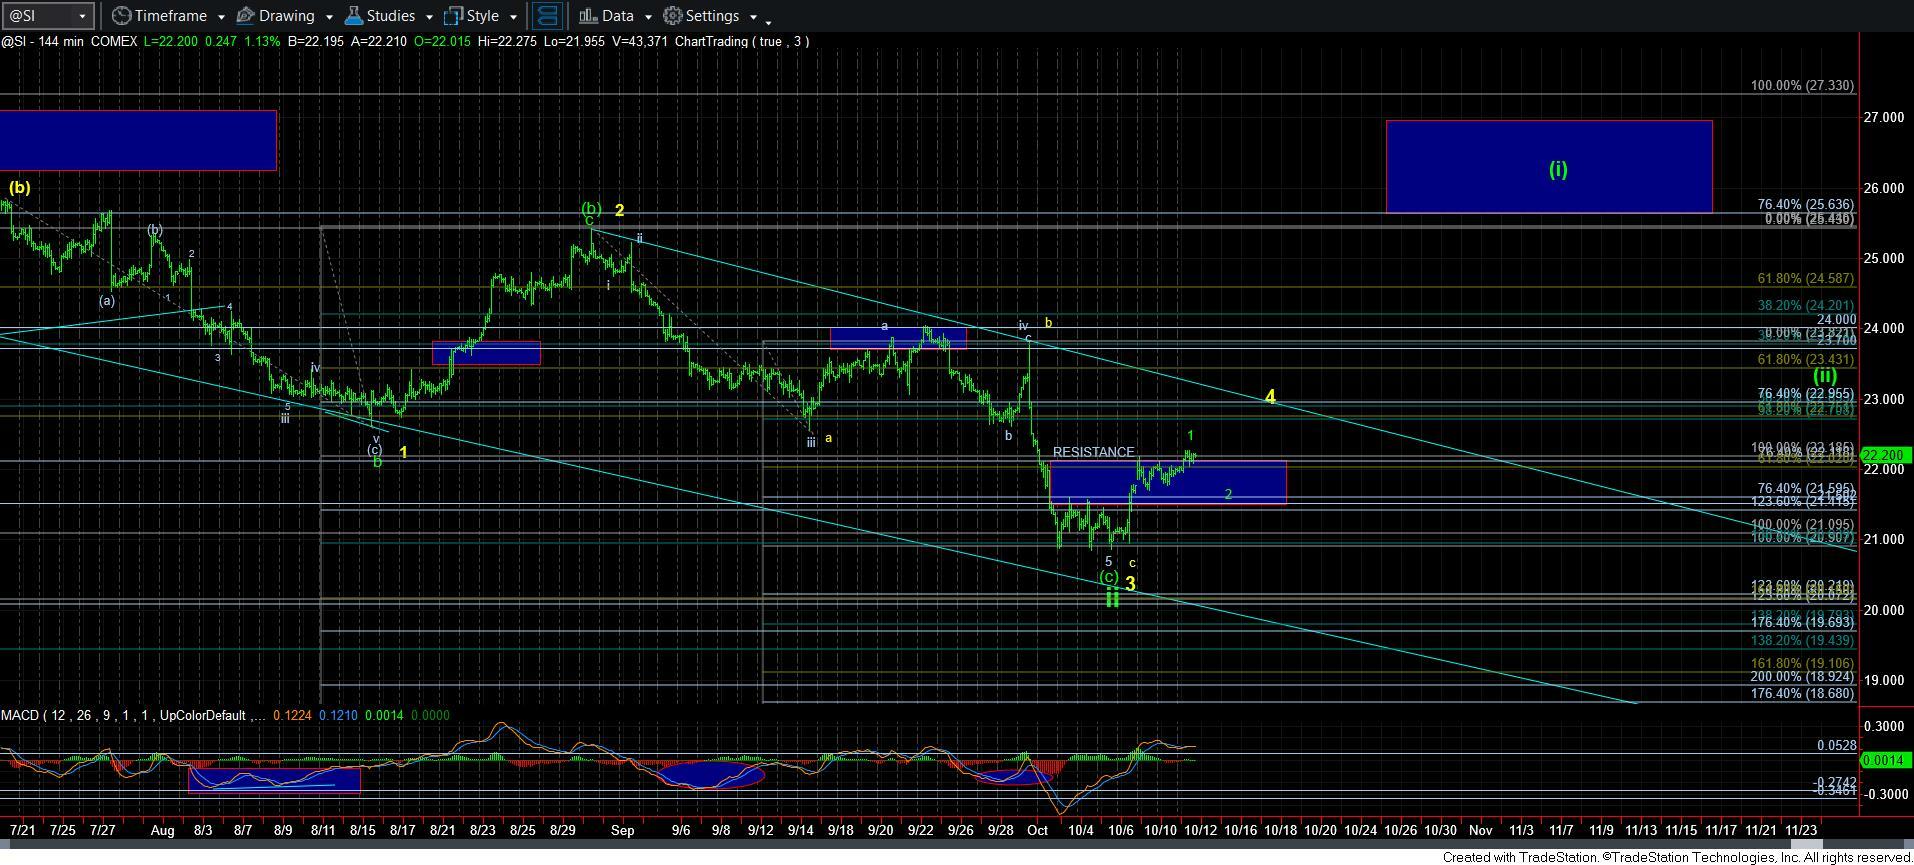
In silver, I can also count 5 waves up. And, that would be wave 1 of [i], as you can see from the 144-minute chart. But, I am still going to be cautious of this rally until we can see a corrective pullback, and then break out of what could be an a=c rally off that pullback low, which will likely coincide with the 23 region. In other words, I am going to need to see a strong move through the 23 region to make the likelihood that we are in the wave [i] in silver we have been seeking for quite some time.
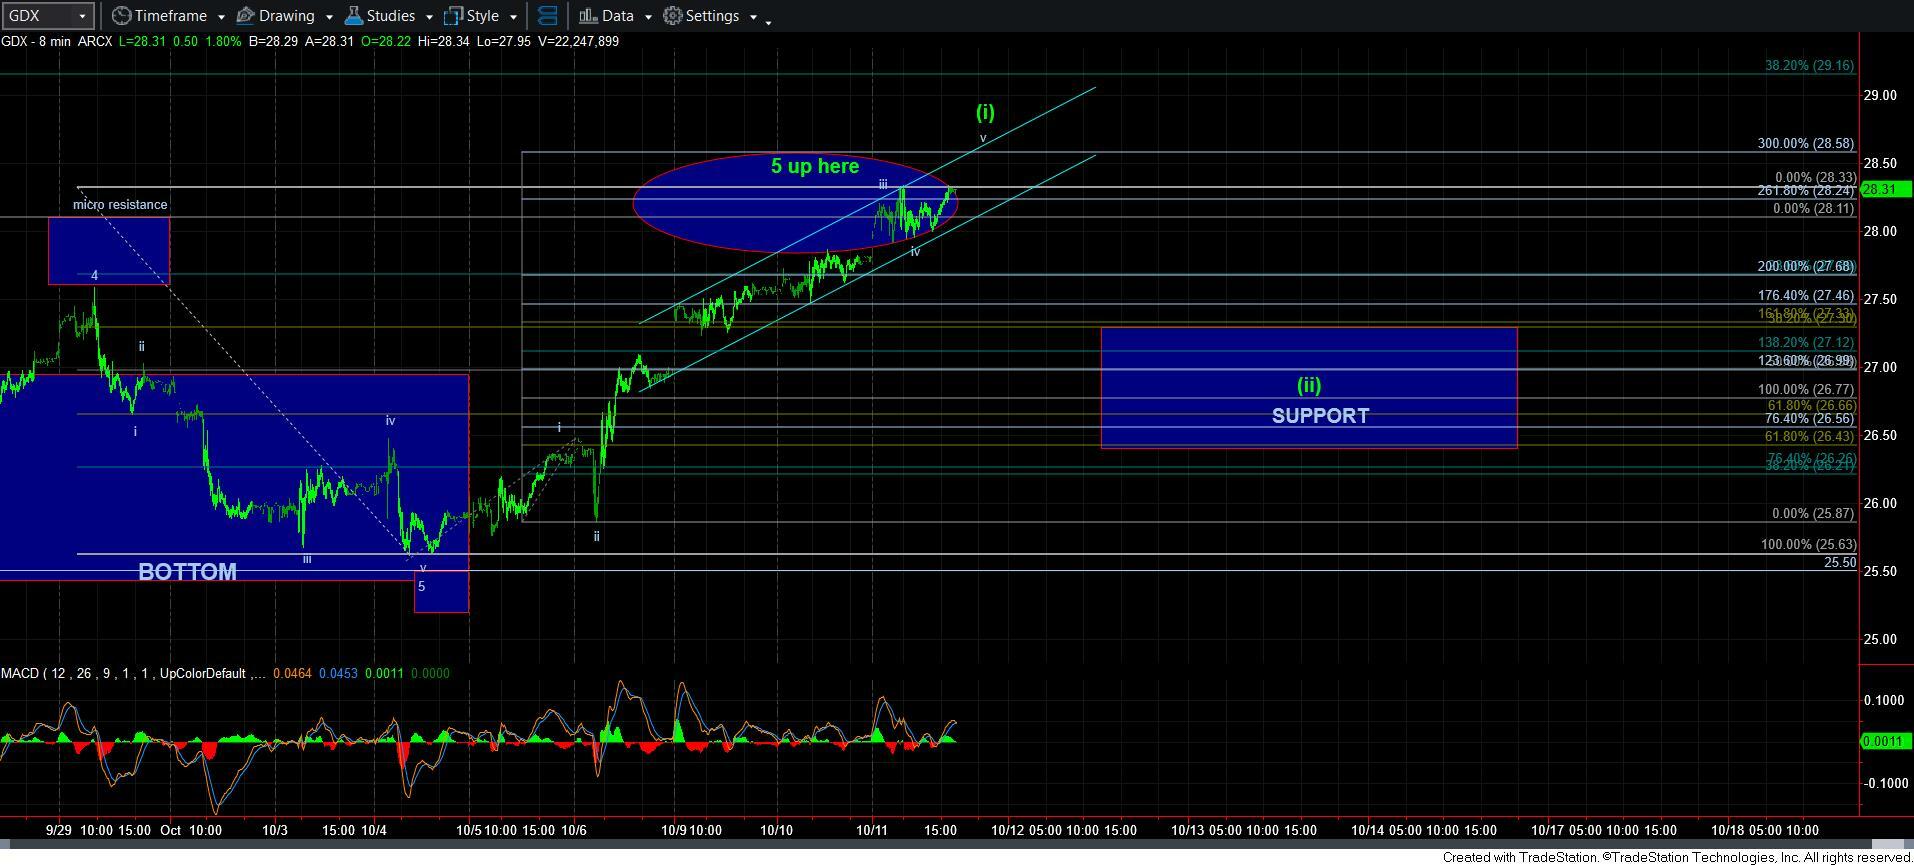
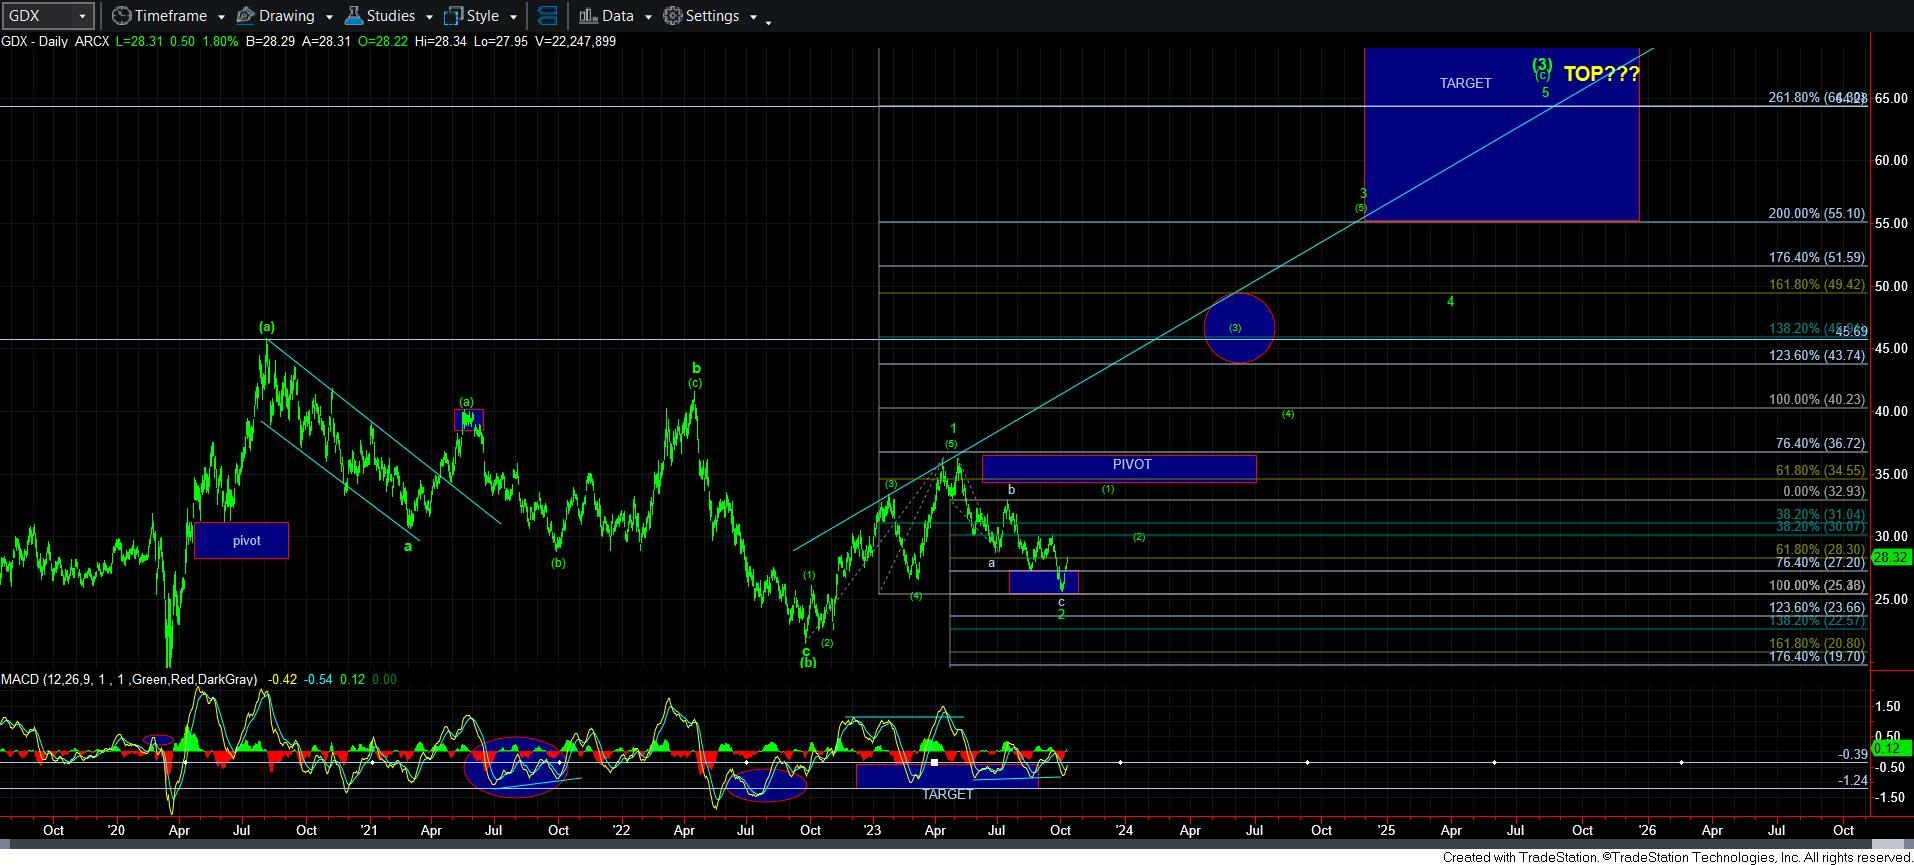
Now, this brings me to GDX. This chart is the most likely to have bottomed in my eyes. Not only did the market complete a really nice a-b-c pullback structure (albeit with an extended 5th wave in its c-wave, which is common in metals), but it bottomed EXACTLY where it should have (an a=c target), and it has now seemingly just about completed 5 waves up. There are a couple of ways to count this 5-wave rally, so I am going to give it another day or two to see exactly where we top.
But, the main point is that if we see a corrective pullback in GDX, you can buy that pullback, and place a stop just below the support box I will outline. You can see one now on the 8-minute chart, but it may get modified if we continue to push this up a bit higher.
Now, for most of you, I want to zoom out a bit. I want you to look at the daily charts of GDX and GLD and the 144-minute chart for silver. I want you to take note of the i-ii structure in GLD, the [1][2] in GDX, and the [i][ii] in silver. IF you remember, it is THAT set up that we are seeking before we go on a “break-out-alert.” So, the current 5-wave potential structure we are now tracking off the recent low is only the first wave within that initial 5-wave structure in those larger degree charts. I hope this puts things into perspective as to how this next major rally in metals will likely take shape.
So, please recognize where we are in the bigger picture before you begin to get FOMO from this move. It is hardly anywhere near ready for the market to really begin taking off.
Therefore, let’s see if we can get a nice corrective pullback in the coming week, which we can then attempt to trade for the next move higher. But, as I highlighted in silver, I am going to be a bit cautious as we approach the 23 region (and the a=c region in GC) during that next rally. But, for now, I am going to treat the current rally as a 5-wave rally, unless I begin to see some reason to change that perspective.