Is It Possible That We Are Ready To Rally In Metals?
The answer is that it is certainly possible. But, I still have no strong evidence that it has begun.
You see, as I have been highlighting for some time, the structure in the charts we have been following have been incredibly overlapping with no clearly definable structure to suggest that the bottom has indeed been struck. Even a number of the individual mining charts have the same amorphous shapes, which leaves us wanting for a high probability bottom having been struck.
Yet, the evidence is starting to mount that the potential does exist that the bottom MAY have been struck in the various double bottoming structures we see in charts across the complex.
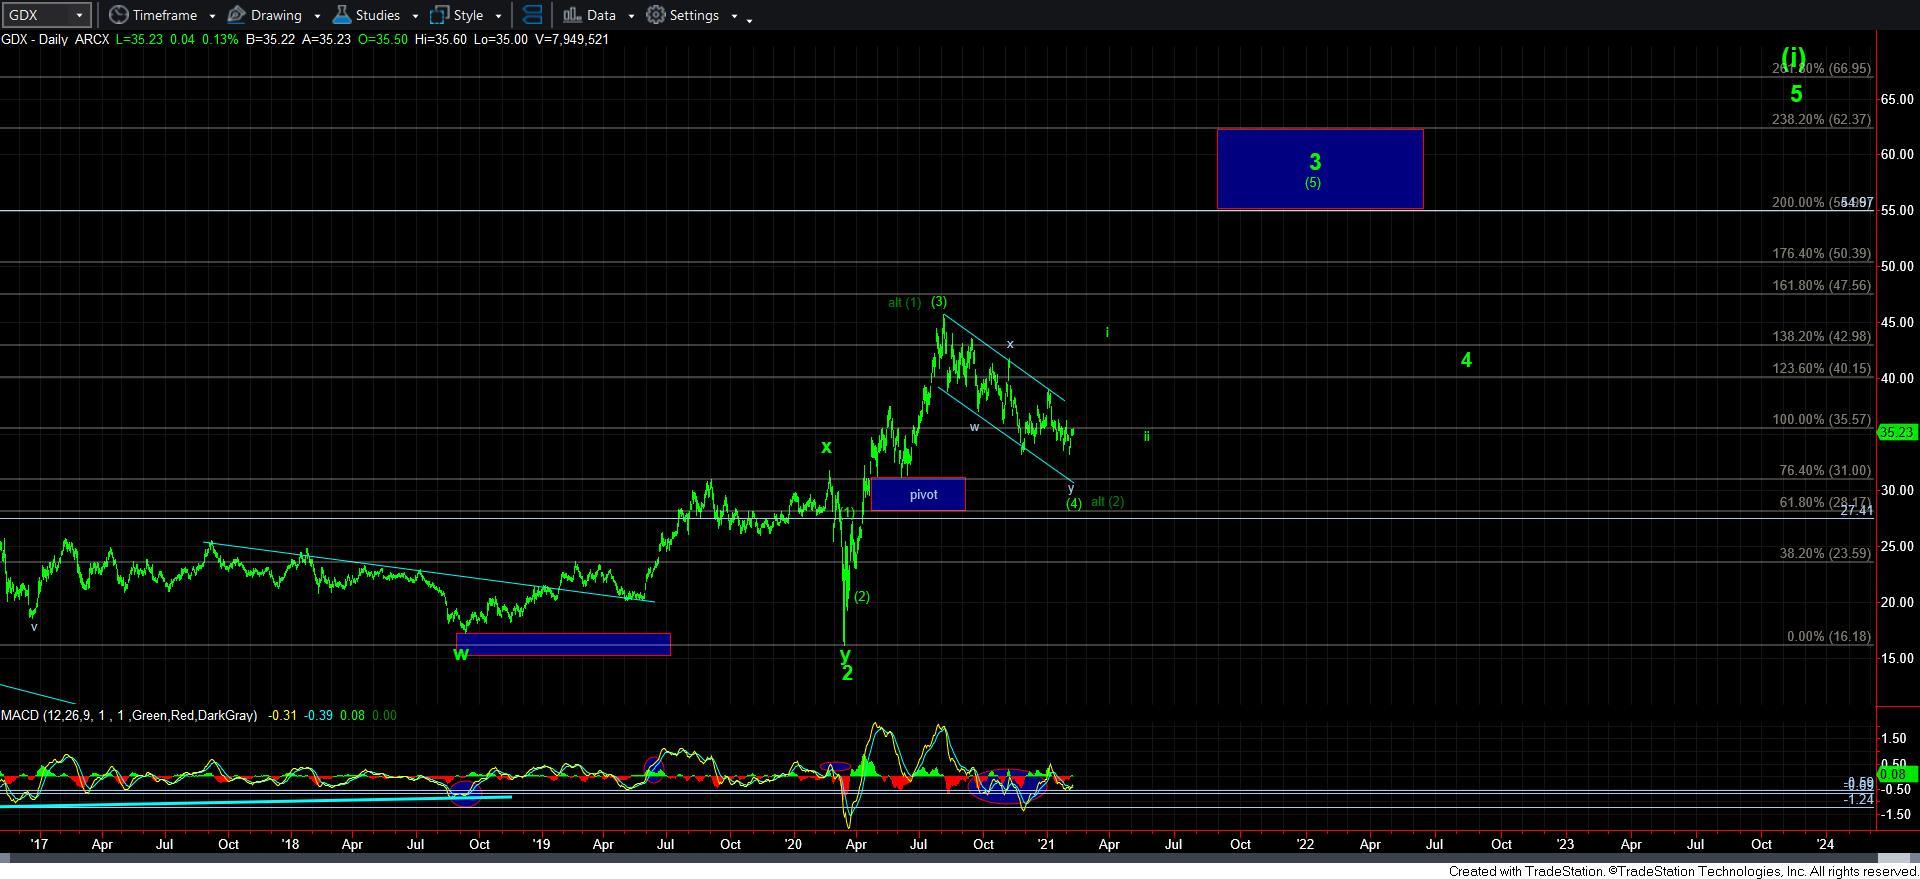
One chart in particular looks like we have either bottomed, or have one more micro lower low to provide us with a full count to the downside. That chart is the GOLD (Barrick Gold) chart. In fact, if we begin to see an impulsive structure break out through the 23 region, we would have an initial indication that Barrick may have bottomed. And, since that is one of the largest holdings within the GDX, we may have to shift towards a bullish perspective sooner rather than later, especially if GOLD begins to rally in impulsive fashion off the recent lows.
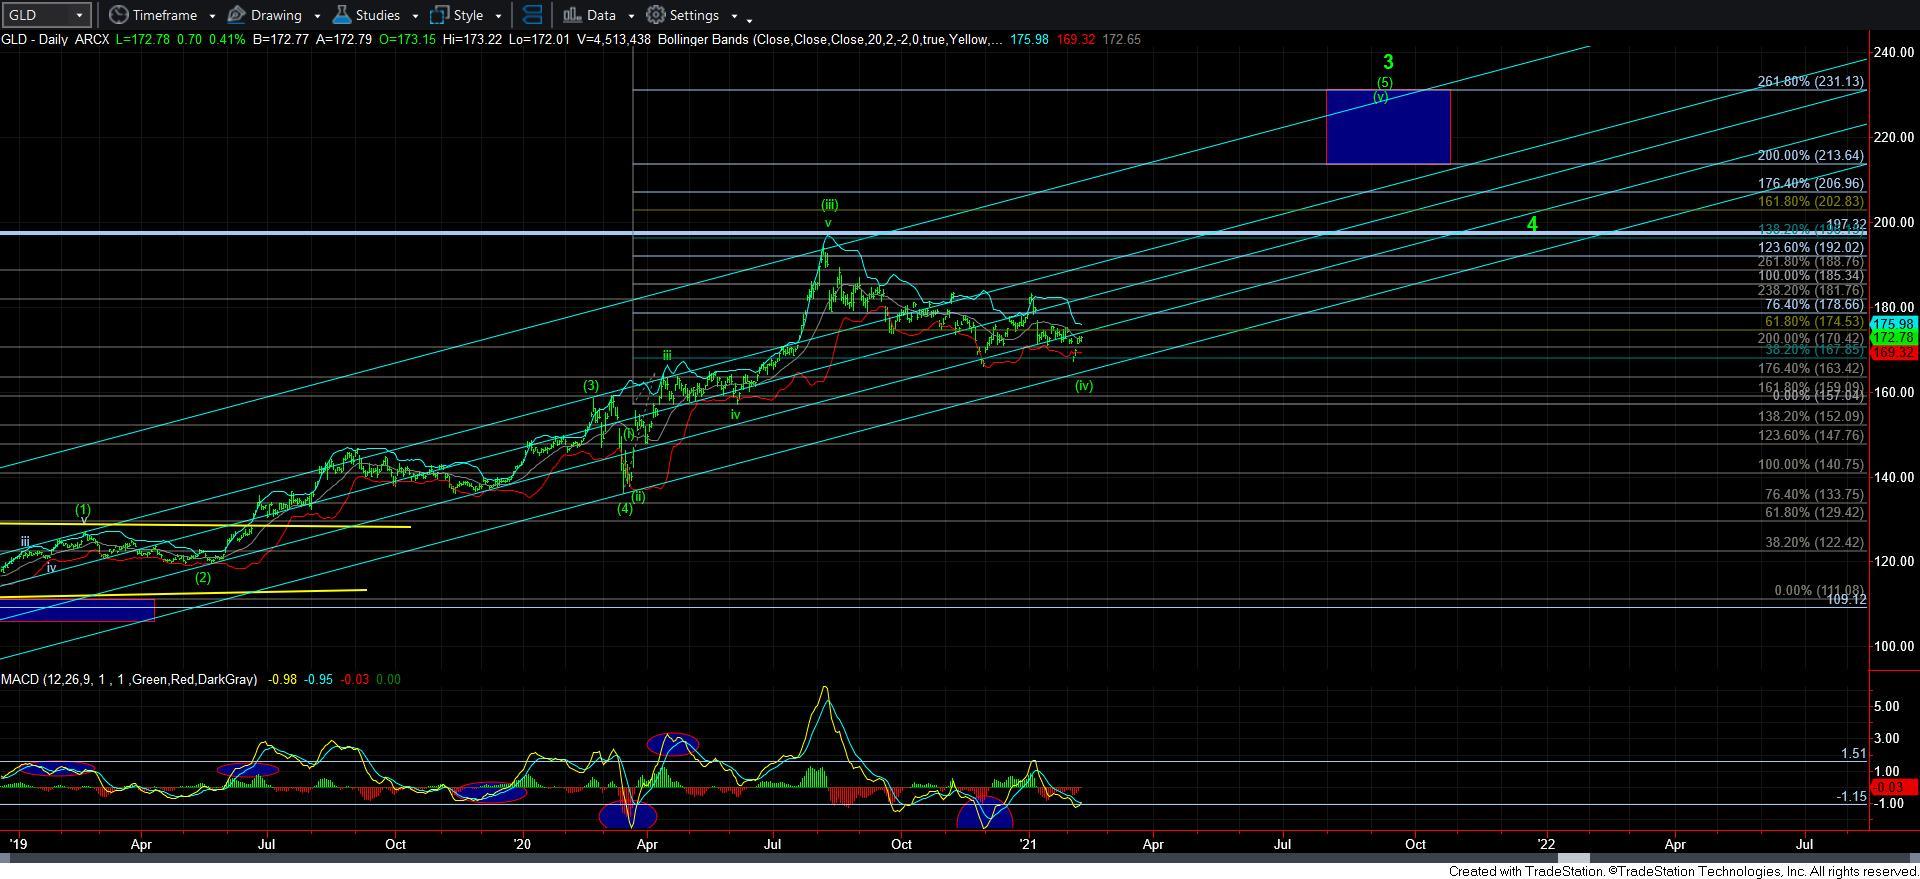
GLD has the same issue, as it can have potentially bottomed with a double bottom as well. In fact, we may be completing a 5-wave structure off that last low as we speak.
In silver, I have no changes to report at all. I am simply going to repost something I posted earlier this week as to the patterns I am tracking:
Let me try to put silver into context.
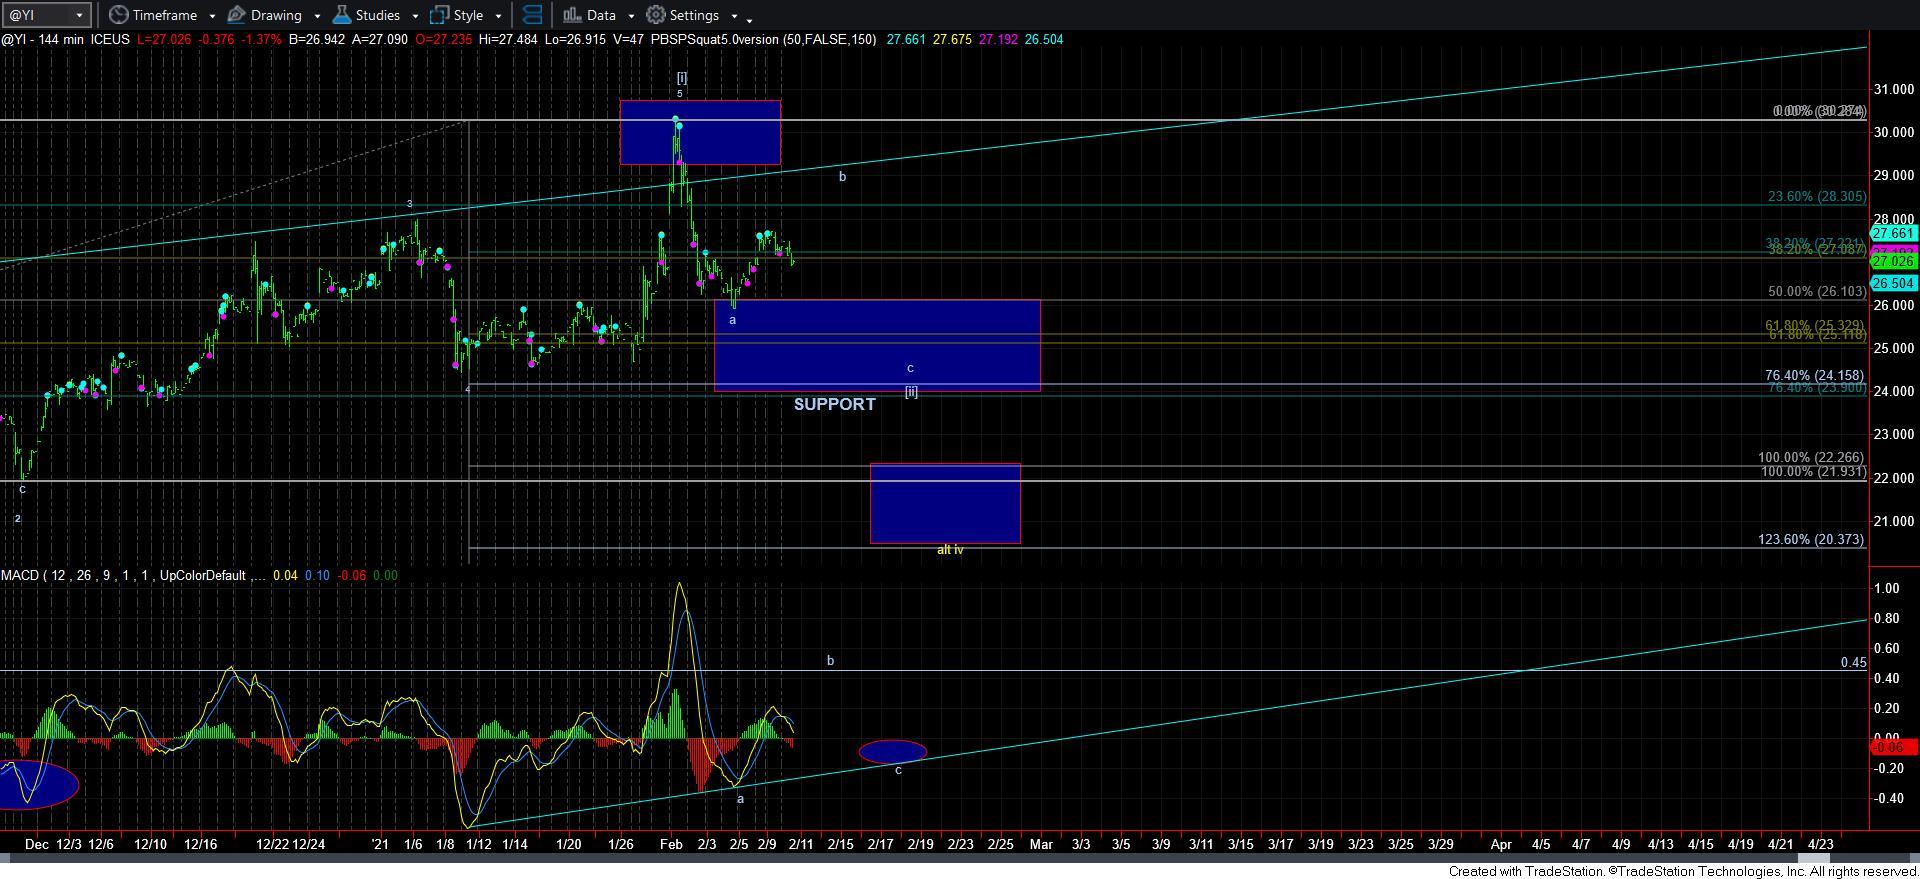
While we have the minimum number of waves in place to suggest that a leading diagonal has completed for wave [i], diagonals are not the most reliable of structures. That being the case, I have to draw the line somewhere as to what I am viewing as my primary.
So, for now, my primary is that we completed an a-wave of wave [ii] to the top of our support box, and we are likely in a b-wave of wave [ii]. Thereafter, I would like to see a c-wave of wave [ii] which provides us with a positive divergent bottoming as shown by my illustration with the MACD path.
However, since these diagonals are not the most reliable of structures, we have to tread carefully. Should the market see a direct break out over last week's high, then we have to see how that rally is structured. IF we rally up towards our b-wave target in a CLEARLY impulsive structure, then I will view the wave [ii], as already completed, and expect that we are ready to attack the 40 region the next major rally phase.
However, if the rally is clearly corrective, then I maintain the b-wave count as long as we remain below last week's high. However, if we rally correctively, and then break out over last week's high, then I would have to view last week's high as only the 3rd wave in a bigger leading diagonal for wave [i], and we would then be in a 5th wave within wave [i].
This is NOT easy since we are not dealing with a standard impulsive structure. So, please stay on your toes, especially since I still cannot take off the alt iv until we take out last week's high.
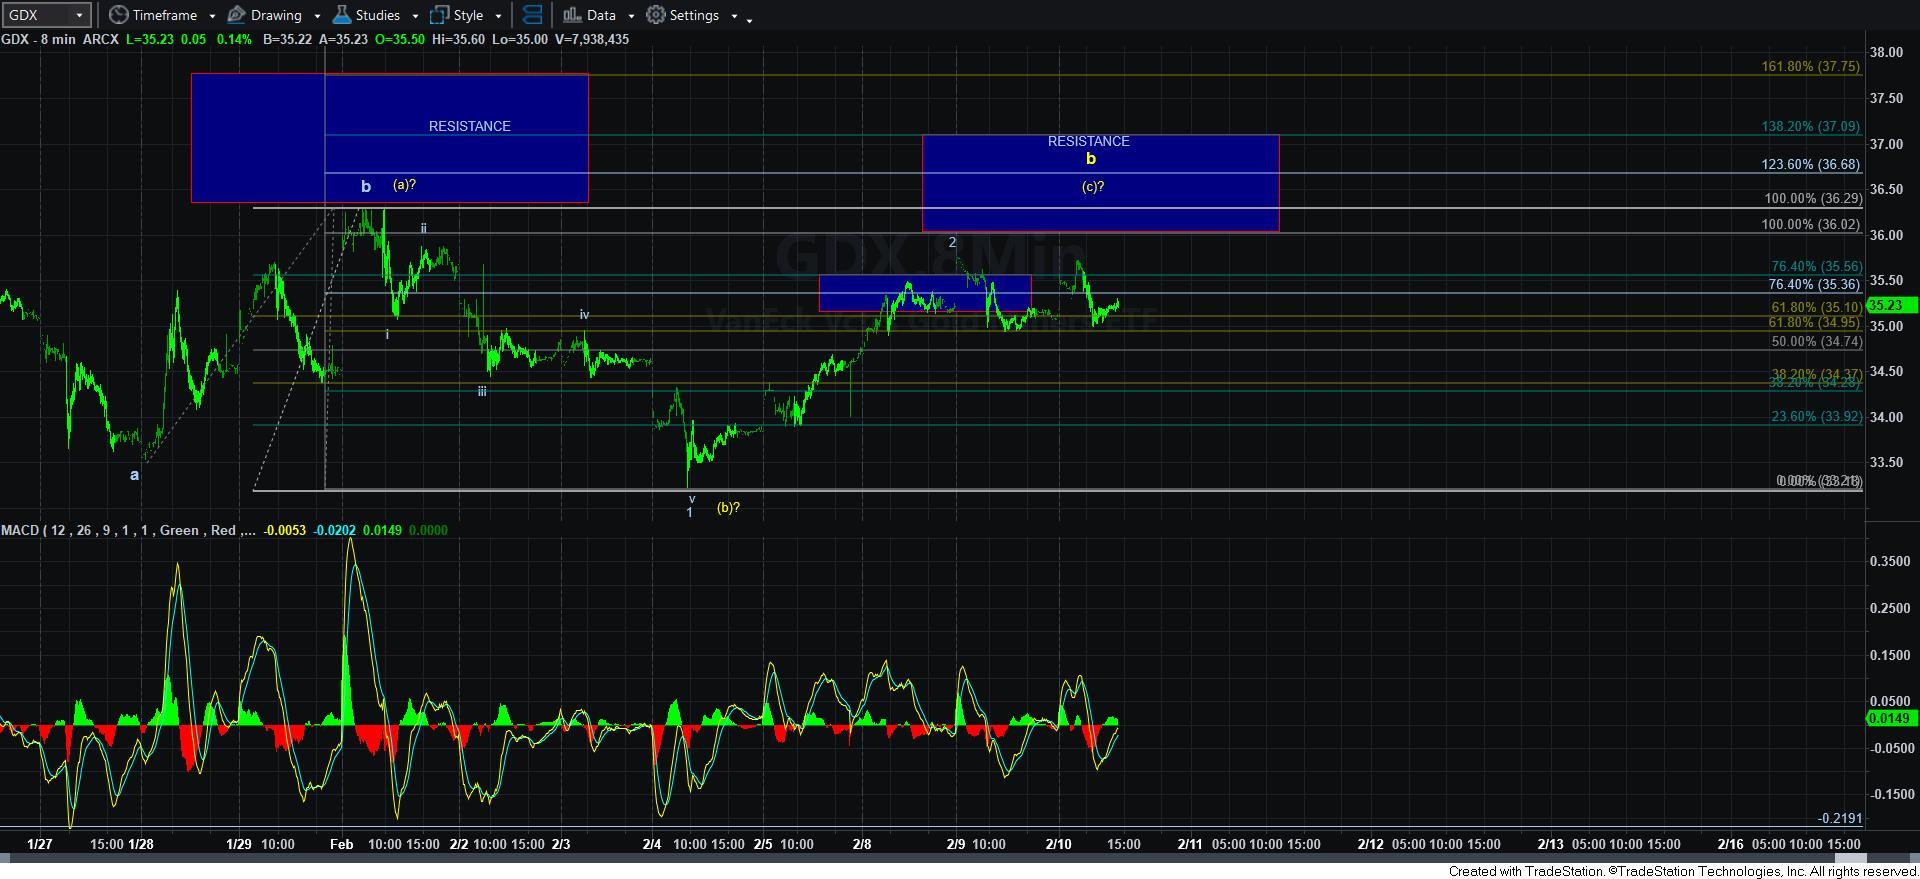
So, in summary, I am on high alert for further signs that the complex has bottomed, and begun the next rally phase I expect for 2021. However, for as long as the GDX remains below the resistance region noted on my attached 8-minute chart, I will maintain a protective put position in the GDX.