
Is COIN Finally Breaking Higher?
 By
Ryan Wilday
By
Ryan Wilday
I have taken a hiatus from my series on Coinbase (COIN), which started with expectations of a major top in 2025, through the current correction. Since my last article in May, COIN has chopped around in a range between just below $140 and just over $220. That range has lasted just over seven months. Finally, I see something worth talking about.
In that article, I asked the question of whether COIN was more likely to drop below $100 or briefly take flight to over $200. We finally have an early indication of an answer — that COIN wants to take the upward route. The only caveat is that the seven-month range has been sticky, and it might suck COIN back in at any time. Today, we have only the earliest sign of escape velocity.
Even up to earlier this month, I was looking for a good short setup since price structure in late summer formed a lower range high that looked like the beginning of a downtrend. However, despite thrashing around well under the upper extent of its range, such a short setup never came.
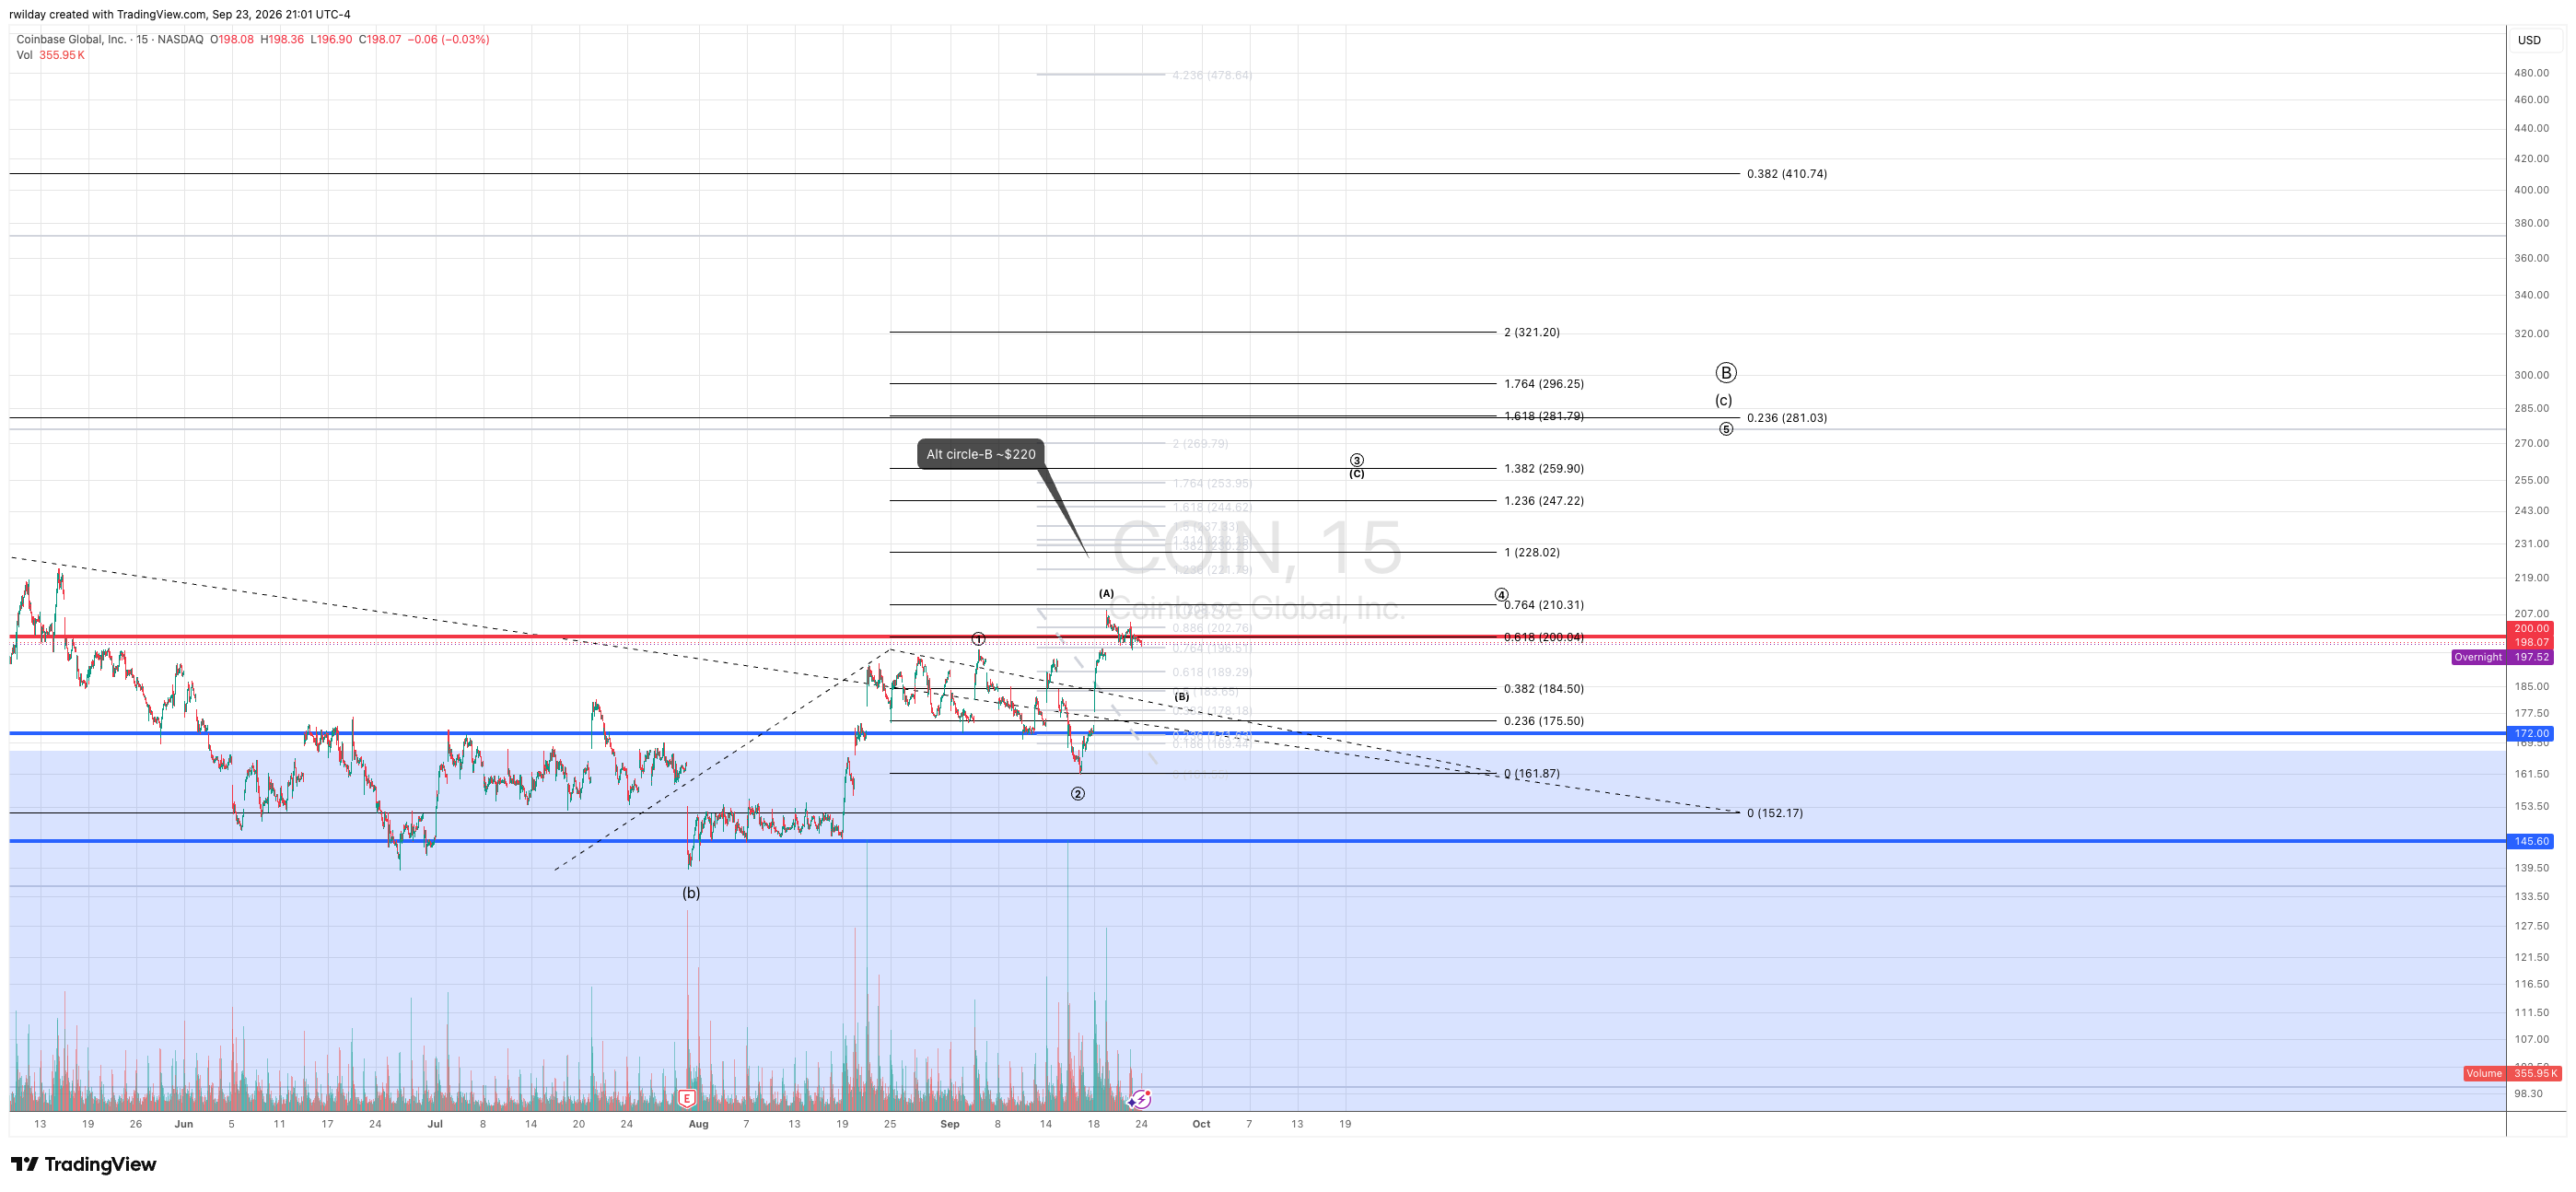
Instead, on September 17th, it started a four-day-long impulsive move over $200. The question is now whether COIN will be limited to a move not much higher than the current high of the range: $222.35, set on May 15th, or stage a bigger rally toward $300.
I slightly lean toward the latter, but for me to want to take a fresh long trade, I need a setup that can propel COIN higher. That may come in a pullback in black-(B), which, if it has started, should hold $172. Such a setup should give COIN the necessary energy to reach wave-(C), which has a nominal target of $259. A full diagonal for wave-(C) should complete circle-B to at least $281.
Tracking a Big Bad B
I feel this series of articles has been a B wave master class. I have been very clear how B waves are the toughest waves to analyze and trade. They have few norms, and even come in several structures defined by the Elliott Wave theory: Flats, WXYs, Zig Zags and Triangles.
They typically retrace at least .382 of the preceding A-wave but can break out over the start of A, with a .382 to .5 extension over it. Finally, when you think they can be a simple ABC, they divide into a larger example. That is to say, ‘typical’ is a misnomer when describing a B wave.
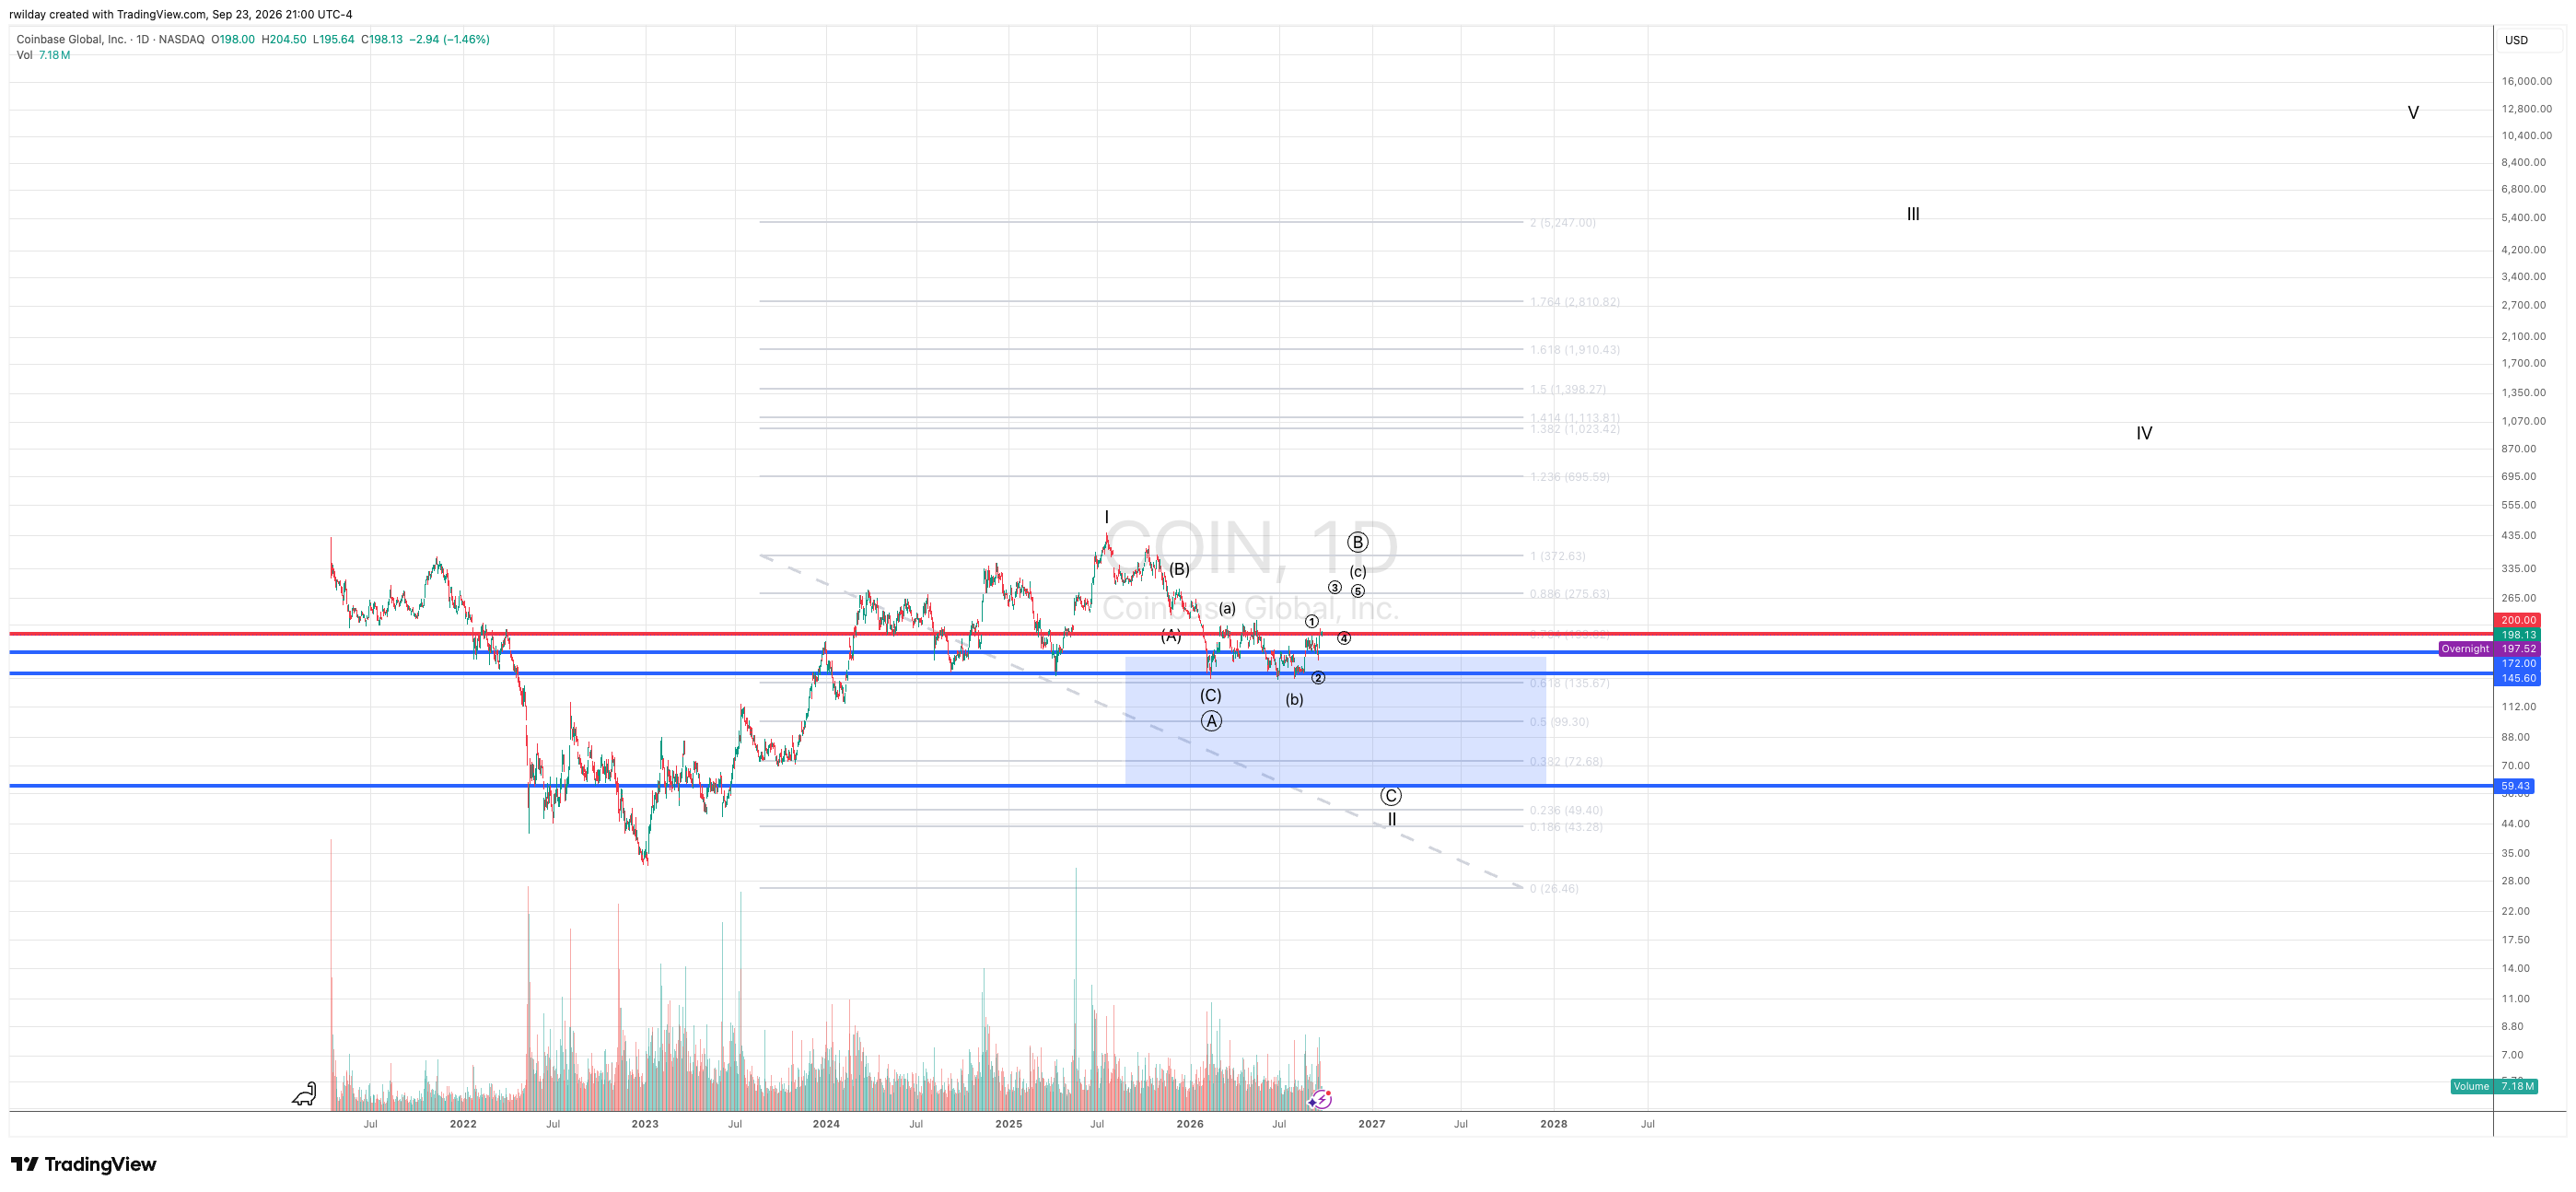
I say all that because, if COIN makes it to my target at $280, it may still subdivide into a larger ABC that can briefly take COIN to new all-time highs before it succumbs again to the current correction. I have expressed that in red on this chart.
Path to a Long-Term Bottom
As to where COIN is likely to find its ultimate bear market low, I cannot say until the B wave tops. C waves typically express price symmetry with the A wave or are slightly longer. The projection will be clear when the first wave down from the B top is clear. All I have to go on for now is that COIN is long-term bullish over $59, but that’s a long way down from here.
Mapping My Tactics
Zooming into the nano structure, you’ll see my first plan to add to longs in a long time at (B). As of writing, I cannot yet say that (B) has started. But as long as it corrects as a clean corrective ABC and holds $172, I will add to longs. Further, I will soon need to see an impulsive reversal out of that B to stay in the trade. The setup could be options-worthy.
As to my long-term holdings, I play a game of adjusting my cost basis with the ebb and flow of this chop. I avoid aggressive, short-term positions until the setup is right. But the machinations of a B wave help a long-term accumulator to lower their cost, while taking profit opportunistically as prices rise correctively. Such an approach avoids perfectionism since choppy action precludes it. And if that is one’s mindset, it takes little trading skill.
Conclusion
To conclude, the long hiatus from writing an addition to this series is a symptom of the trading action that one should expect to find at this stage of COIN’s price development. After a great run from an all-time low of $31 to its high at $422, it needed to correct. Ultimately, should COIN hold $59, I expect it one day to reach well over $3000. But that target is a long way off in terms of time.
It seems for now that we have only seen the current bear market’s first volley in circle-A before this arduous seven-month chop zapped traders’ energy. If COIN forms a large B wave as expected, potentially at new all-time highs, a grand trap will be set. The final flush will be epic and a great buy location. Trades until then are more short-term oriented. If you are an accumulator of COIN, be stirred to patience. It will be a long road ahead.
