Is A Bottom In For The U.S. Dollar?
 By
By
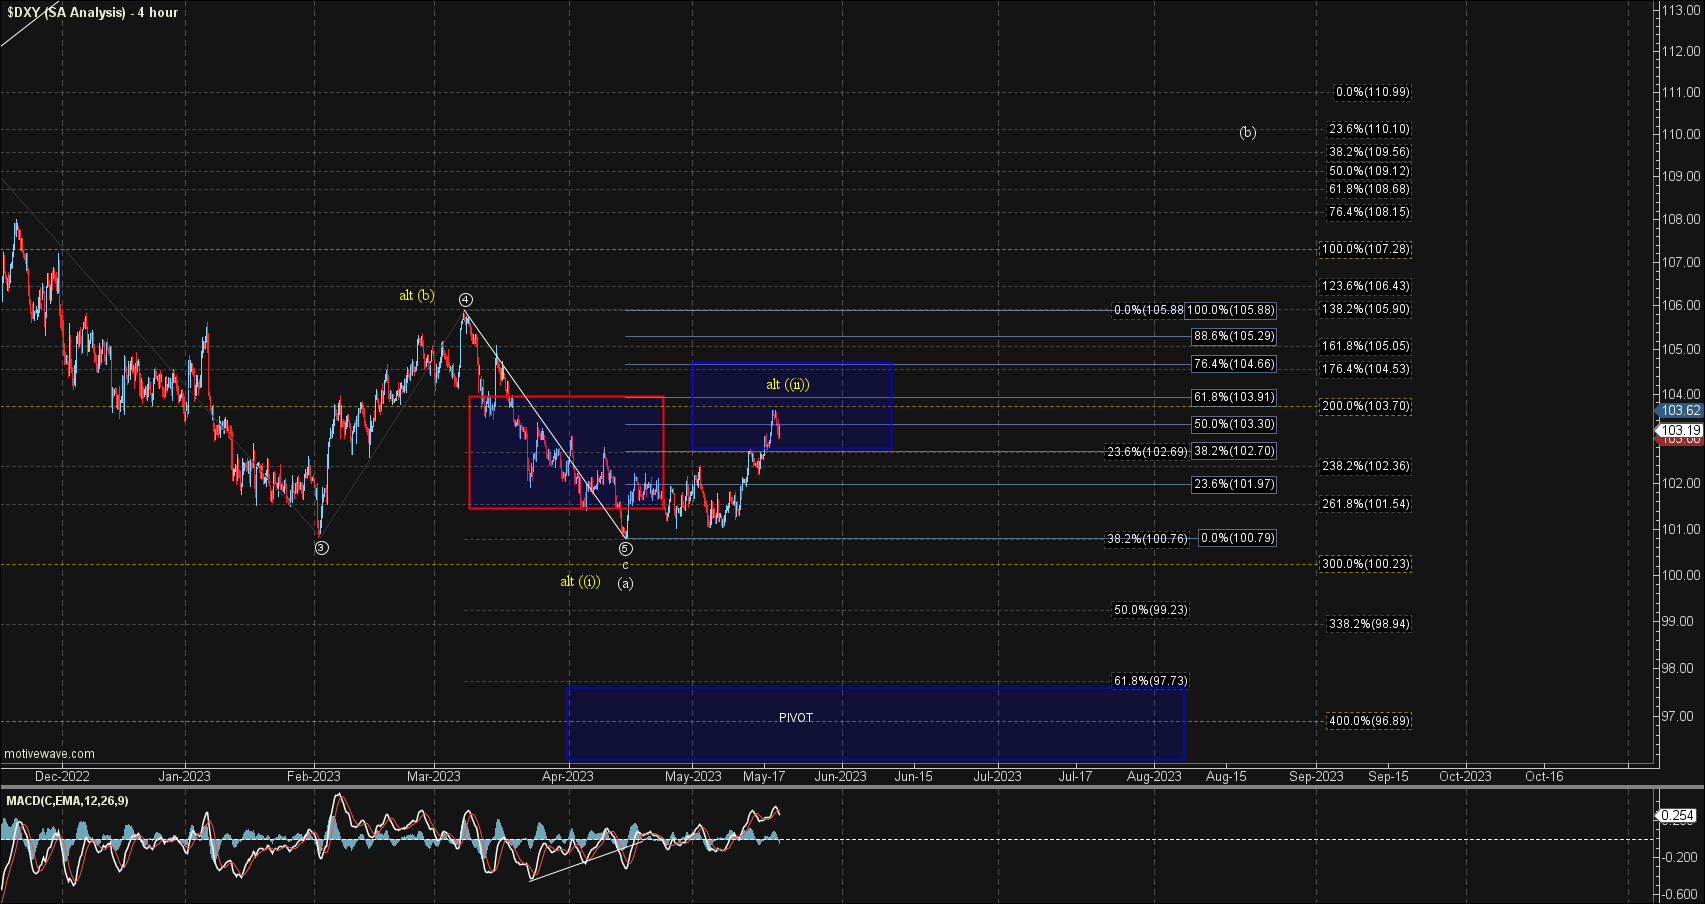
This week the DXY continued to push higher giving us further confirmation that we may have put in a bottom in the wave (a) as labeled on the charts in white. We do, however, still have a bit more work to do to give us final confirmation that a bottom is indeed in place and that we have begun or larger wave (b) up back over the 105.88 high.
Shorter Timeframes
I am still counting the move into the 100.79 level as an extension of the wave (a) down off of the September highs. As we do have enough waves in place to consider the pattern full at current levels I am still watching for a break of upside resistance to give us a signal that we may have put in a bottom in all of the wave (a). That initial resistance level currently sits at the 103.70 level which almost broke this week. If we can follow through and break that level then I want to see that followed up with a break over the 105.90 level to give us confirmation that a bottom is in place and that the larger wave (b) up is underway.
If we are unable move through those levels and break back below the 100.79 low then it would open the door for all of the wave (b) to have already topped with this current push higher being part of a yellow wave (ii) of (c). I am showing this alternate count in yellow on the charts, but this is not still my base case at this point in time. It would take a break down under that 97.73 level to confirm this however with the break of the February lows I do have to allow for the possibility of this count.
Bigger Picture
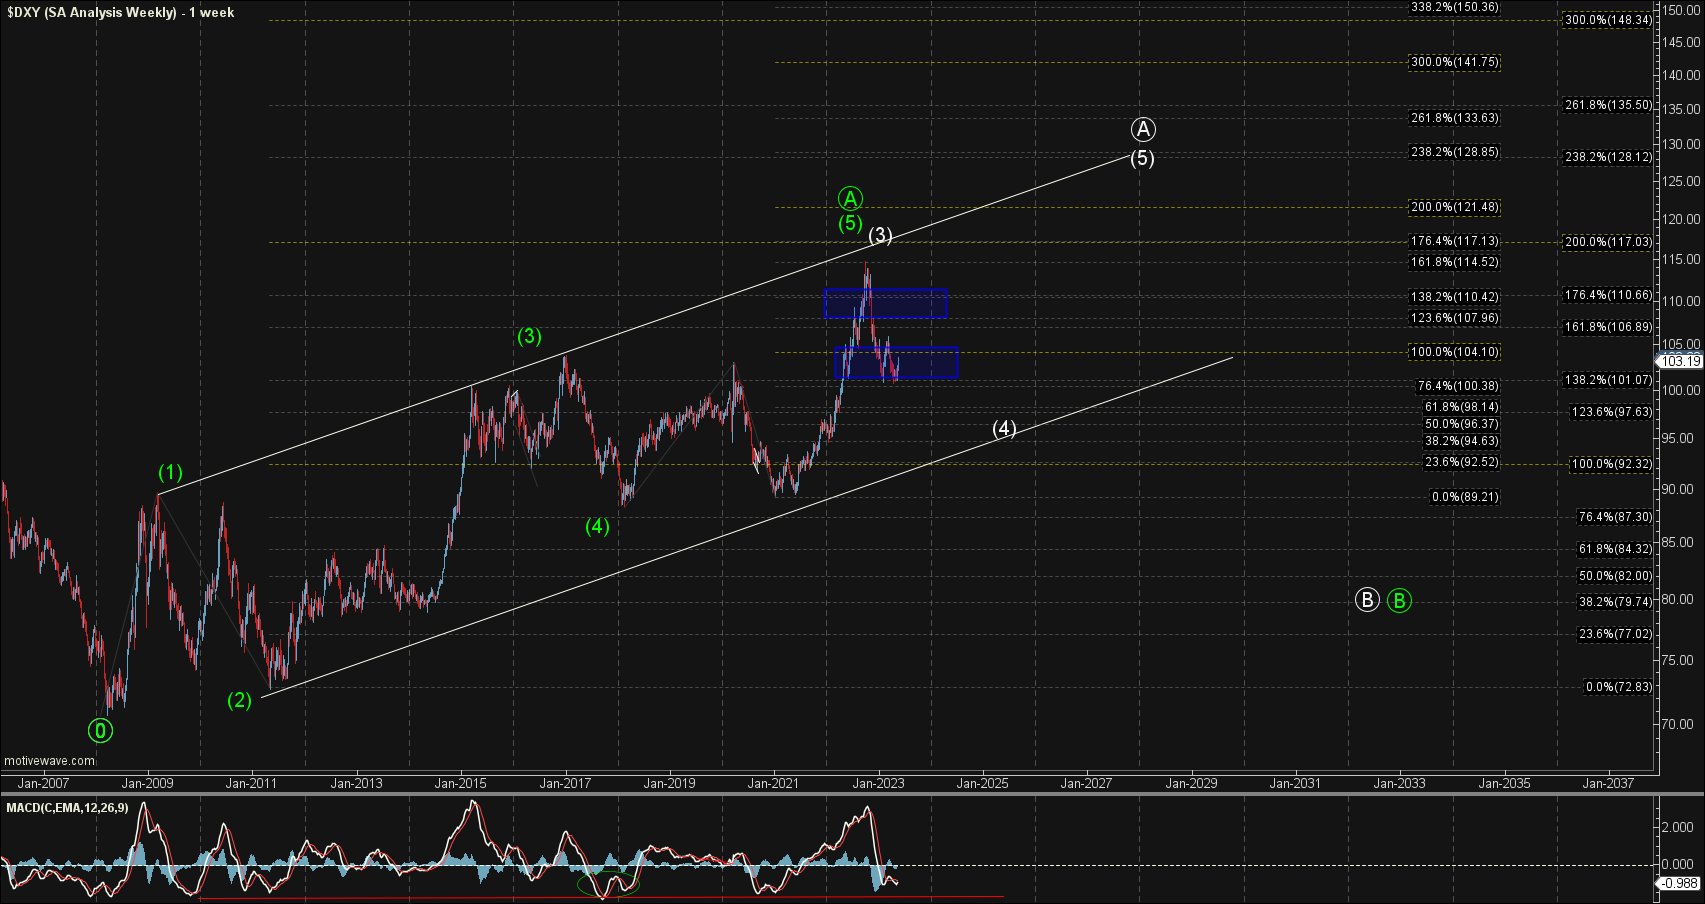
There is still no significant change in the bigger picture count, and as I have noted previously, I am counting the top in October as either the white wave (3) or the green wave (5) of ((A)).
The white count should head down towards the lower trend line to fill out that wave (4) before pushing higher once again to finish off the larger degree wave (5) of ((A)). The exact bottoming level for this potential wave (4) is still a bit unknown at this point in time as the entire structure off of the 2008 lows would count as a large diagonal, making the support levels a bit unreliable on this time scale. Therefore, it is better to look more closely at the smaller degree pattern and fibs to get a better idea of where exactly the bottoming zone would land.
The green count is suggestive that we have topped in all of the larger degree wave ((A)) and we are already in the wave ((B)) down. Both the white and the green count are going to look very similar in the early stages of this move as they both are corrective in nature. The green count of course would give us a much deeper retrace for that larger wave ((B)) before turning higher, whereas the white count should find support much higher before getting that higher high.