'Intel' Suggests Semiconductors Ready To Byte The Bullet (Video)
 By
Zac Mannes
By
Zac Mannes
Summary
-INTC represents over 11% of the SOXX.
-Semis represent over 11% of NASDAQ 100.
-Charts suggest a large degree correction is just starting.
With semiconductors comprising over 11% of the NASDAQ, a closer look at this sector is warranted. In the video below, Garrett begins looking at the VanEck Vectors Semiconductor ETF (SMH), which follows the PHLX Semiconductor Sector Index (SOX-X) equally as well as the iShares version (SOXX).
SMH has a very nice impulsive move off the 2009 low, hitting a perfect Fibonacci 161.8% extension for the Primary Wave 3 off the 2011 wave 2 low. It also has a very cleanly complete 5-up at the Intermediate degree, and inside the (5)th off the 2015 low has a complete set of five sub-waves at Minor degree. This, coupled with the recent turn down from the hit of the 161.8%, makes it highly probable this Index is beginning its larger Primary wave 4 consolidation. Ideally, this will drag price on SMH down to the 82-65 region. This would correspond to roughly 1,150-900 on the SOX-X, and 155-120 on SOXX.
Intel (INTC) and Taiwan Semiconductor Manufacturing Company (TSM) are the largest by market cap and, thus, the heaviest weightings inside SMH, but interestingly, TSM does not make it into the NASDAQ 100, whereas INTC is in the top ten by weight there. It is also the more "household" name in the space but, more importantly, is giving us the strongest signs that the larger Primary wave 3 topped.
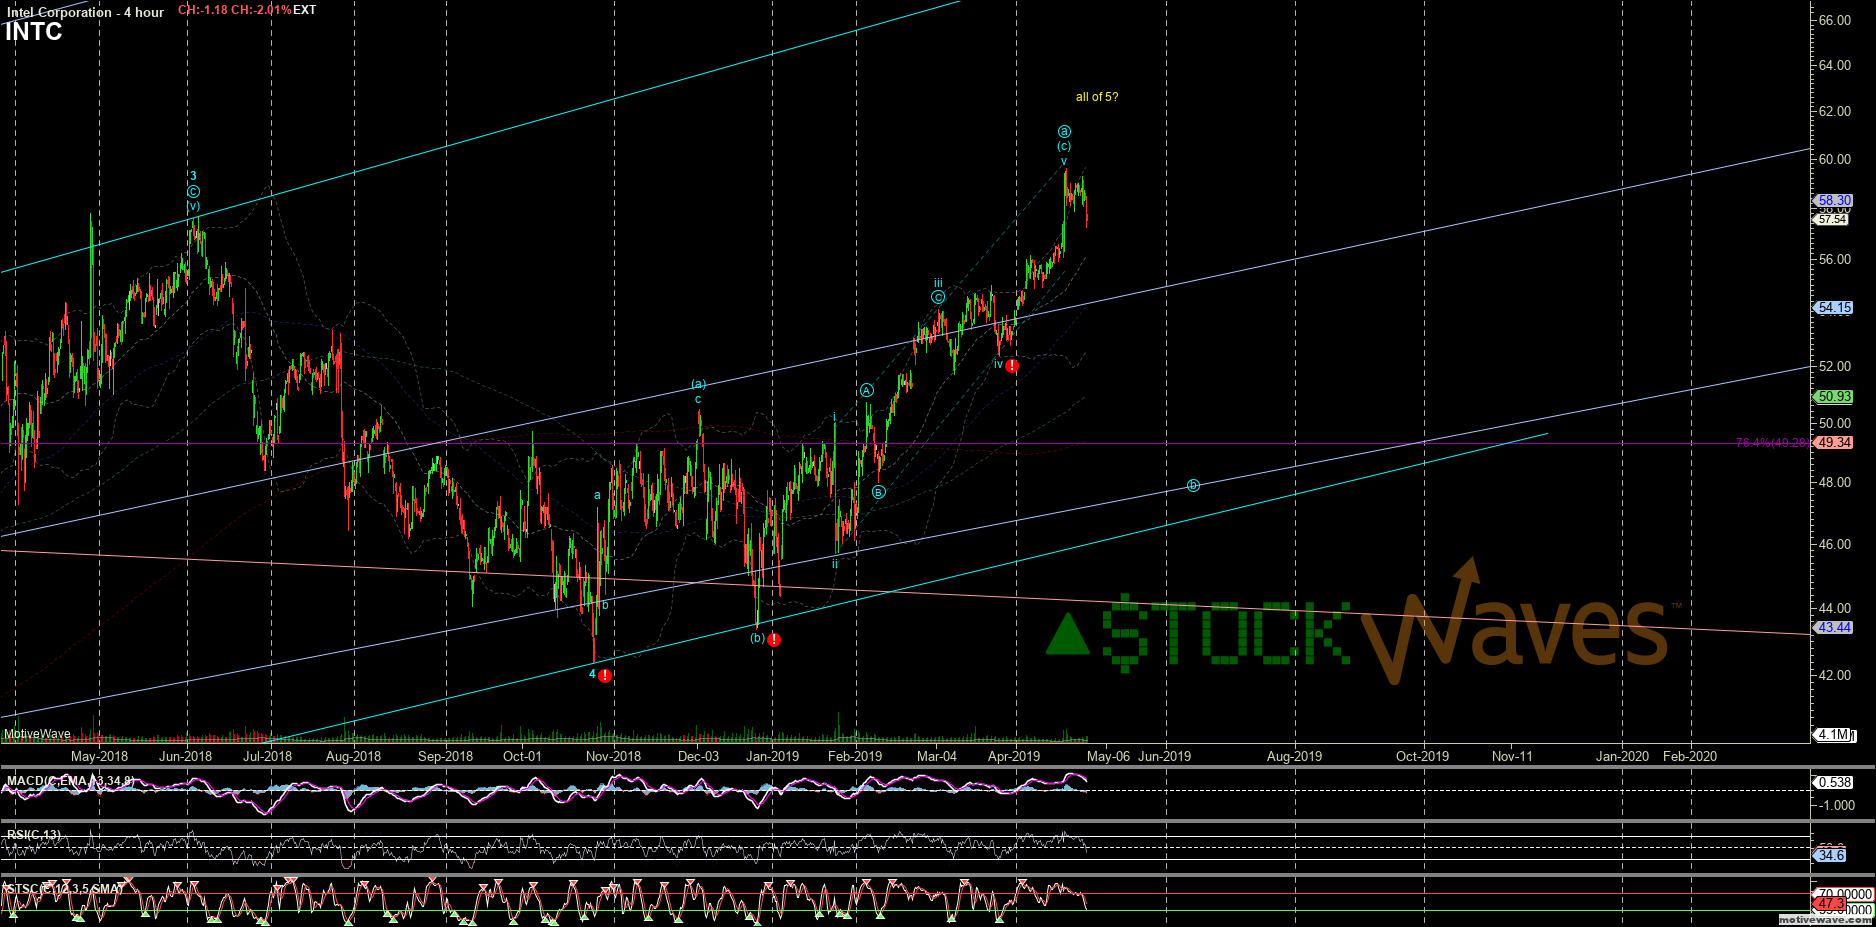
Into the April 25th earnings, we were showing INTC as topping in at least the "a" of a final 5th of an Ending Diagonal, if not all of that 5th. INTC needed to fade correctively into the 52-50 support region for a possible "b". The strong drop and continued weakness below that level make it most likely that the larger Primary 4th in INTC is underway and leading the sector.
TSM counts the same as SMH/SOXX off the 2009 low. Here too, the Primary wave 3 is also hitting the 161.8% extension, but additionally, this has formed a triple-top as internals have weakened significantly.
Qualcomm (QCOM) has a very different pattern as an Ending Diagonal for the C-wave at Primary degree off the 2009 low rather than an impulse from there. It too is close to topping in that pattern, but 75-70 region can be support for a final high.
Finally, we looked at NVIDIA (NVDA), which reports May 16th after the close. After our performing much of the market in a very strong and extended Primary wave 3 off the 2012 low, NVDA got a far more sinister drop from the October high to confirm the start of Primary 4 and has since lagged most of its peers on the rebound from December lows. Failure to hold the 174 level in April greatly decreased chances that this could even get a bit higher in the corrective bounce toward 211 before turning down in the second half of the Primary 4th decline. In the very short term, we do not have a confirmed "1-2" start of the "(C)" with only 3 waves down from the April high, so it could try to bounce a bit this afternoon, but holding resistance in the 180s could set up the next leg down.
