Intel Is At A Pivotal Moment
 By
Levi
By
Levi
By Levi at Elliott Wave Trader; Produced with Avi Gilburt
If you have ever spent any time practicing debate skills, then you may have figured out a few things for yourself. Perhaps you have developed sharpened abilities that would make many fear stepping into the parley parlor with you. Others have become proficient at understanding their particular ‘opponent’ and instead of destroying them, seek to attain at least a mutual respect. In time, this person may even gain the other as a colleague and friend. Take just a moment and seek to understand rather than critique.
We want to share with you how we arrive at conclusions and then project probabilities onto charts like (INTC). You may not yet have a full grasp on this methodology. As well, if you have suffered some unpleasant results with what was deemed “Elliott Wave analysis”, it will create even more skepticism in your mind. That can be overcome if you are willing to try something new. Please allow us to proffer a way of looking at the markets that you may have not seen before; we will use (INTC) as our case study and show you what we are forecasting for the stock as well as key parameters for this scenario.
How We View The Markets And Stocks Like Intel
Avi Gilburt has frequently commented regarding our use of Elliott Wave Theory:
“As an investor, your job is to objectively understand the market in order to maintain on the correct side of the market action. Unfortunately, most investors follow specious market theories because it makes them feel as though they have a certain amount of control over the market if they can come up with a reason for the market move, no matter how contorted that reasoning may be. Yet, you must come to the conclusion that such control is an illusion, in the same way that much of the analysis leading to such false sense of control is intellectually dishonest.
As for me, I simply apply a mathematically-based approach to the market price action, which tells me rather objectively if my analysis is right or wrong and allows me to adjust rather quickly when I am wrong so that I am not adopting and trading false beliefs of the market.” - Avi Gilburt
Using this mathematically-based analysis methodology, we are able to project probable paths for (INTC) but also when we would need to shift our primary scenario and where it even might invalidate. Does your current system allow you to do this? Over many years of keen observation and deep study we have come to appreciate that Elliott Wave Theory, when correctly applied is the only method of analysis that provides us with market context at any point in time. What is this telling us for (INTC) and where is it likely to go next?
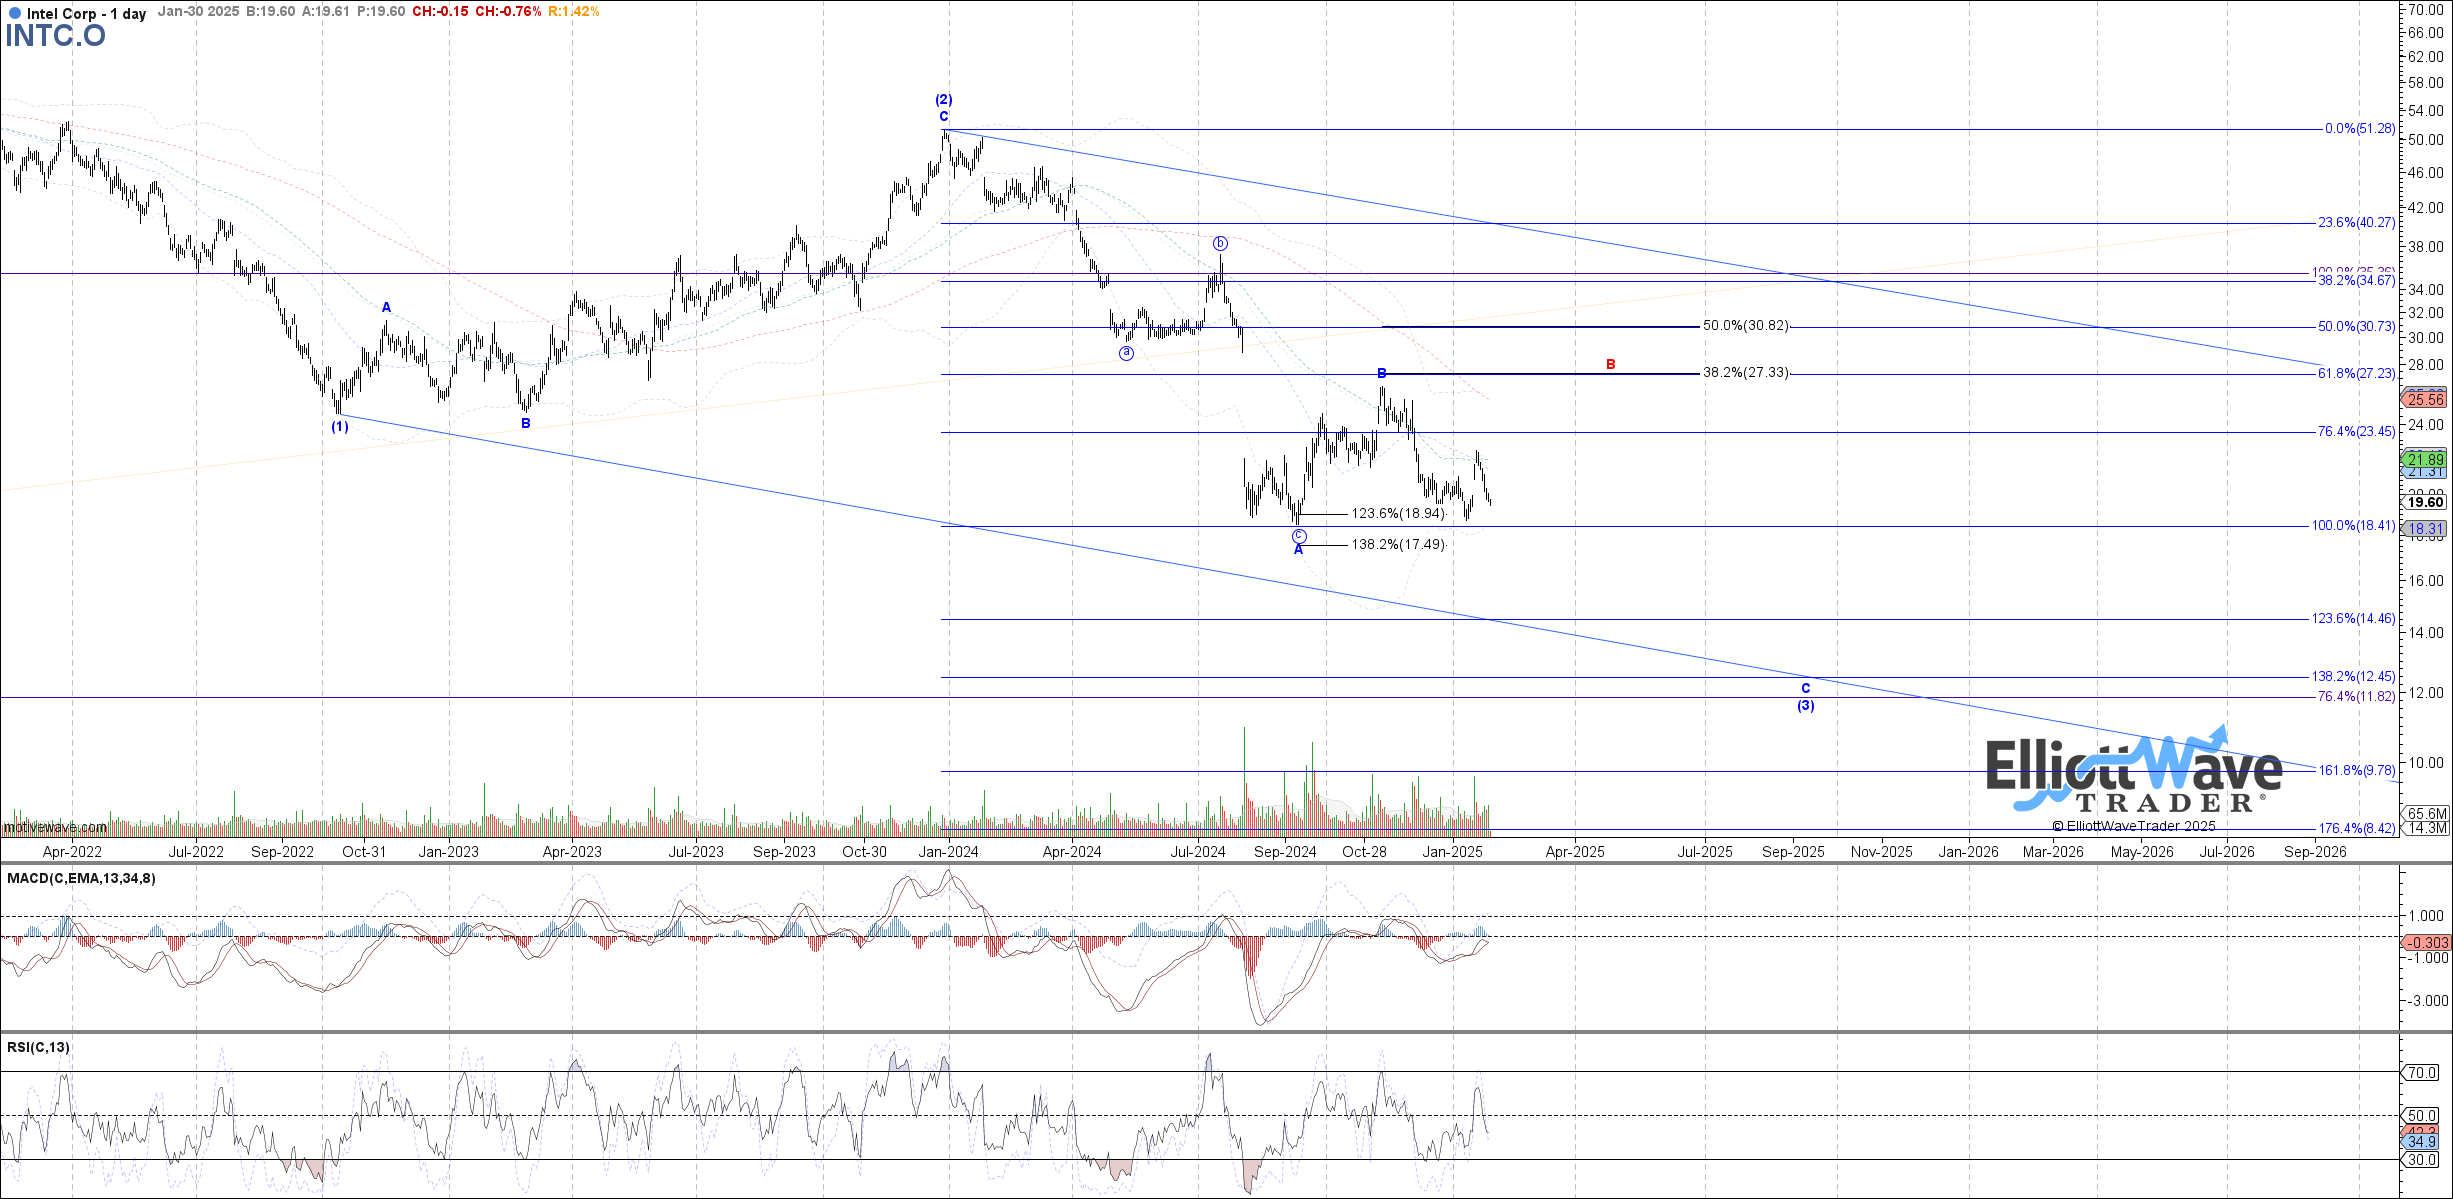
Note that on Garrett’s chart above he has (INTC) in a much larger corrective pattern with two more major lows to come in the next several months. Ultimately, it is plausible that the stock sees as low as $8 - $10. “What did you say? That’s just not possible!”
Well, let’s discuss some parameters for the near term and then see how these might fit into the bigger picture.
Here is Zac’s recent chart showing the immediate bearish potential for (INTC):
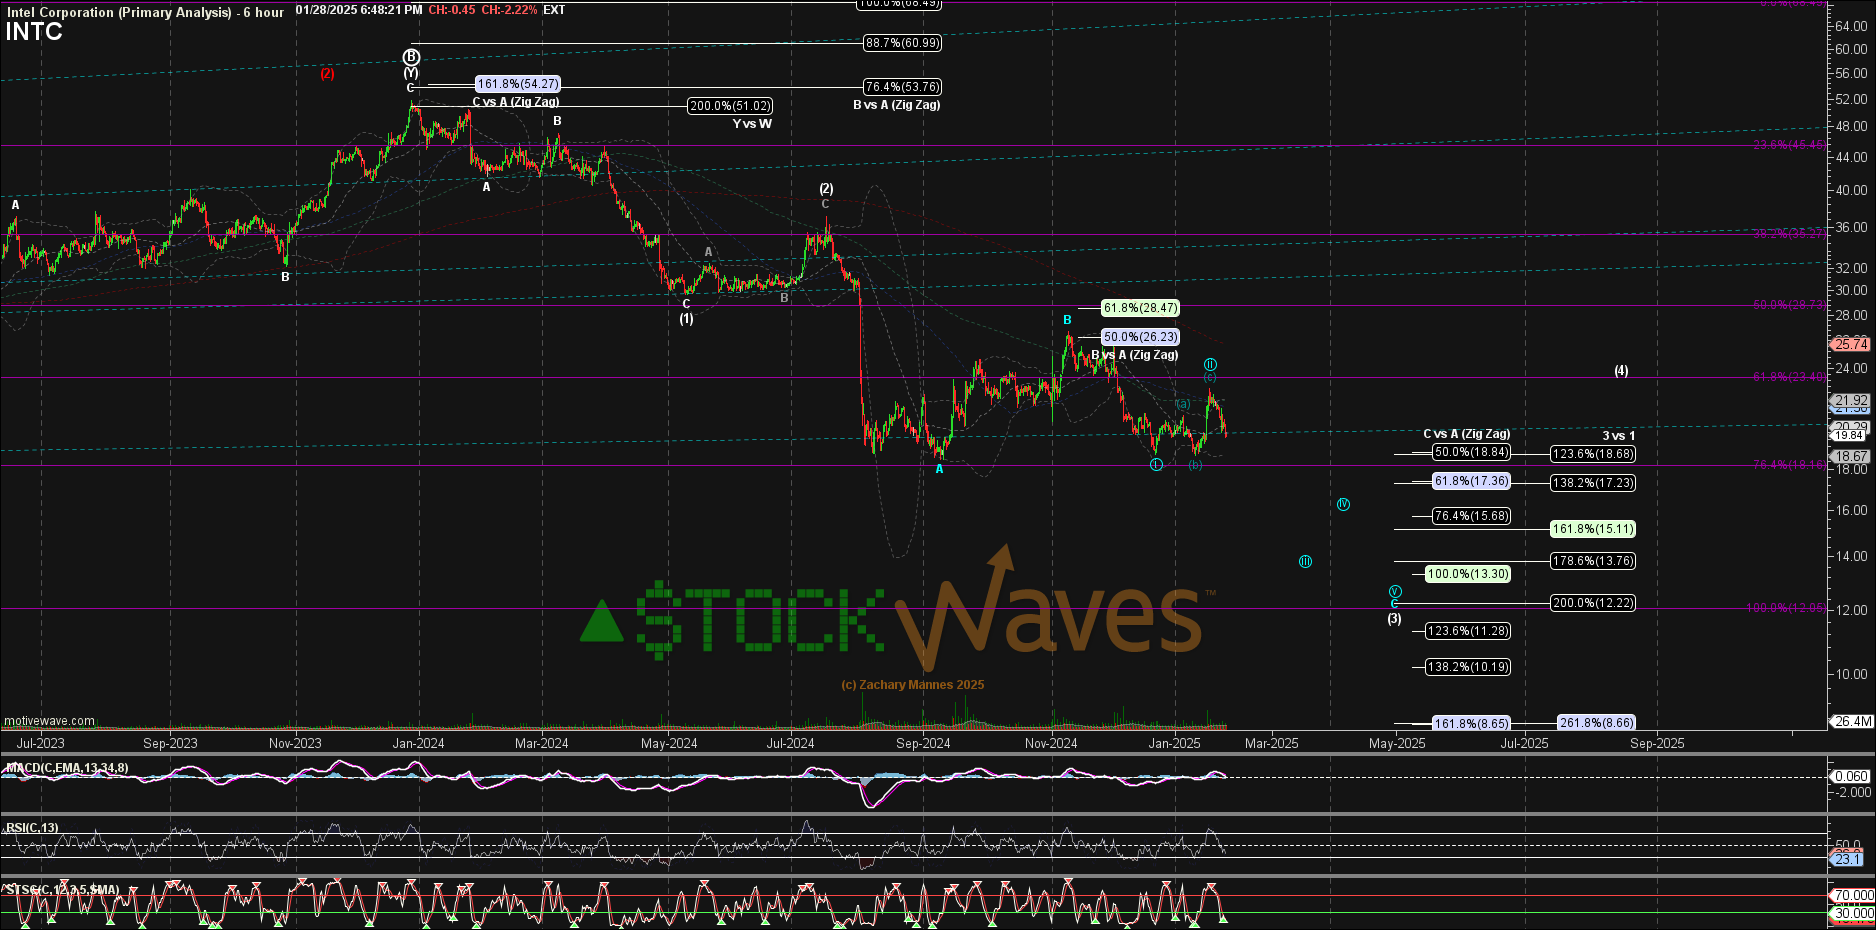
This structure tells us that for as long as price remains below the $26.50 high struck some sessions back that the next swing low may be at the $12 - $14 area. This will become much more likely should near term support at $18 - $19 give way.
Now suppose that this current support at $18 - $19 area holds and price begins to advance; what then? A wider ‘B’ wave bounce is more probable.
Enter here the facetious criticisms like, “So, you’re saying that the market could either go up or it could go down?” Or, “Hey, take a stand, give us a simple ‘Buy’ or ‘Sell’”. Frankly, folks, the markets are not linear structures. They are much like, in fact, they are exactly like human behavior. As such, we use probabilities to project what is most likely to take place.
Presumably, you may even do this yourself. Who is going to win the Super Bowl? The odds makers have percentages carefully crafted and calculated. These can shift right up to game time. Typically, over time, the more favored team or teams will win. And, yes there will be occasional ‘upsets’ and ‘outlier’ results. But the key is that in a world of probabilities, the likely outcomes will dominate over time.
It’s very much the same with the setups that we generate for our members day in and day out. These scenarios will always provide clear parameters that either further confirm their likelihood of coming to fruition or where they need revision and even invalidation.
We have such a setup for (INTC). To be clear, the bigger picture is pointing down. Likely, the stock sees a move down to the $12 - $14 region, a corrective bounce that will take some time to complete and then one final low. Above $26.50 and this scenario needs a slight revision and above $37 then something else other than what is illustrated here is taking place in the bigger picture. For now, probabilities point lower, especially if $18 - $19 is broken.
Conclusion
Markets are emotional. They are irrational. In their wake, they can leave the seemingly most intelligent and logical among us battered, bloodied, and abandoned. Striving to constrain the markets in a linear box of reason and clean geometry will exhaust the brilliant and mercilessly bash the bravest.
This, of course, does not leave us in the lurch. A system is needed to bring structure to the apparent madness. We have such a system in place, it is the very foundation of our methodology.
Please keep in mind that we provide our perspective by ranking probabilistic market movements based upon the structure of the market price action. And if we maintain a certain primary perspective as to how the market will move next, and the market breaks that pattern, it clearly tells us that we were wrong in our initial assessment. But here's the most important part of the analysis: We also provide you with an alternative perspective at the same time we provide you with our primary expectation, and let you know when to adopt that alternative perspective before it happens.
There are many ways to analyze and track stocks and the market they form. Some are more consistent than others. For us, this method has proved the most reliable and keeps us on the right side of the trade much more often than not. Nothing is perfect in this world, but for those looking to open their eyes to a new universe of trading and investing, why not consider studying this further? It may just be one of the most illuminating projects you undertake.
