Initiation? - Market Analysis for May 31st, 2024
 By
Zac Mannes
By
Zac Mannes
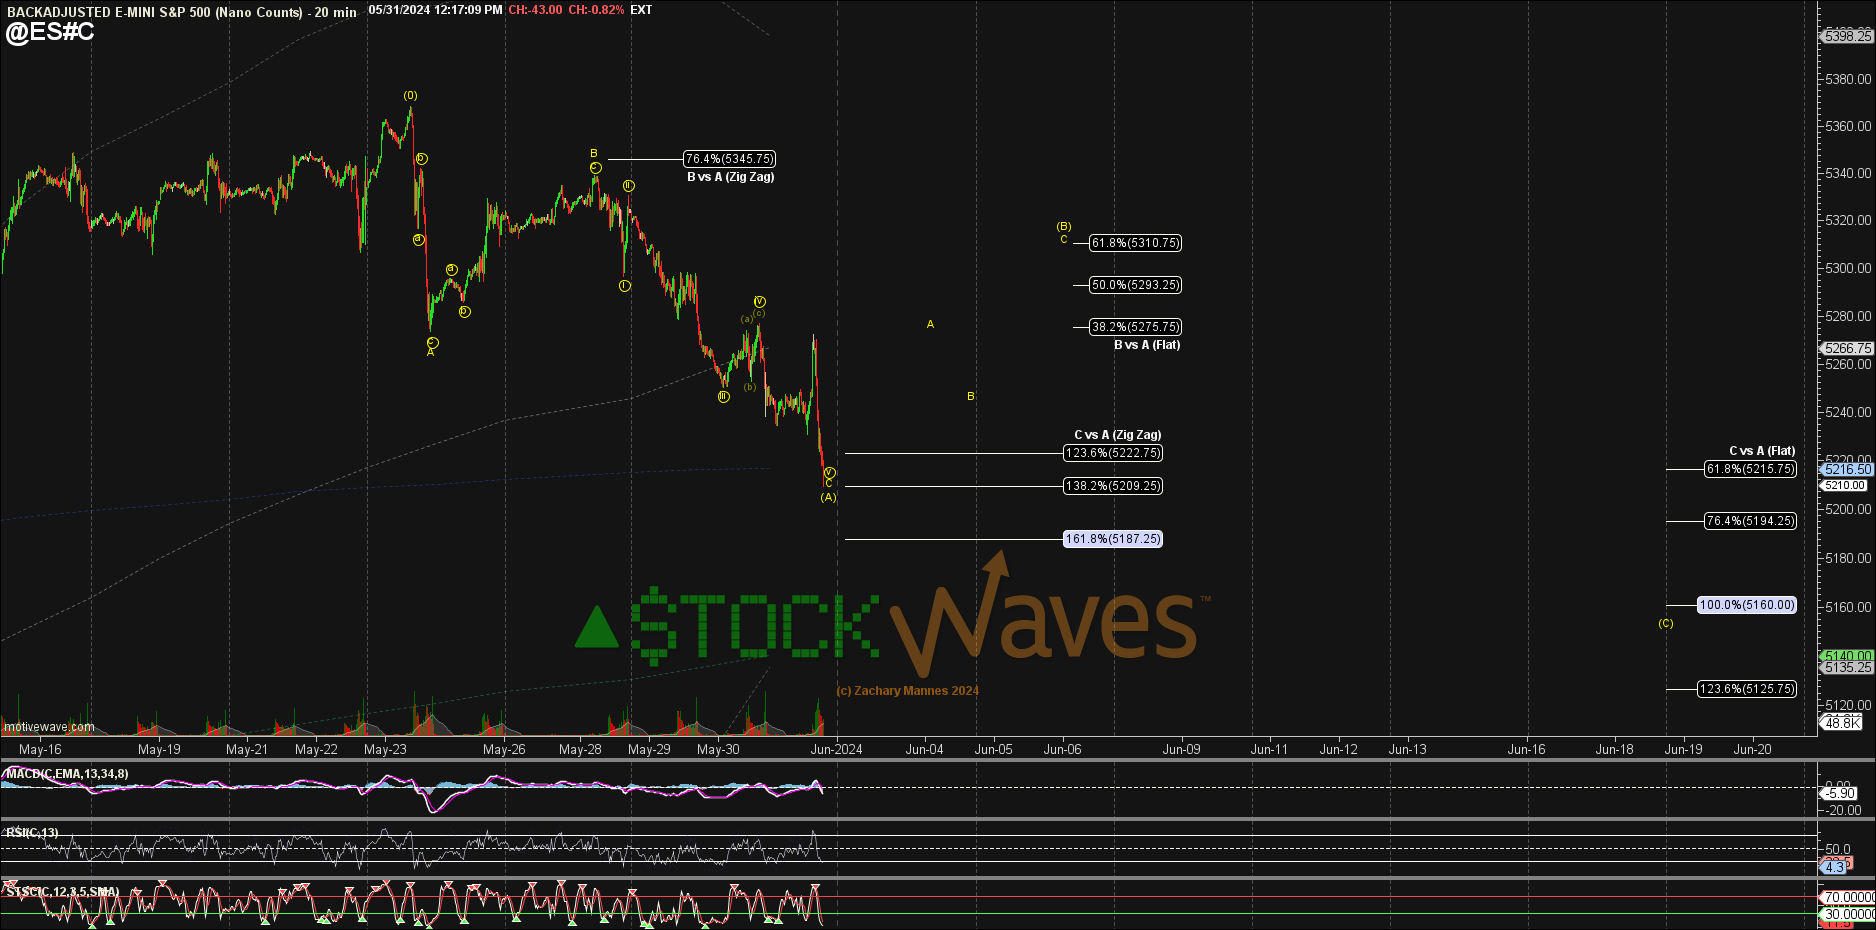
So far we only have a small (Miniscule) ABC down in ES, the vth of C is now stretching to the 138.2%, but it is not clearly anything reliably more bearish given the structure off the new ATH so far.
That said, as discussed other Index chart can be telling a very different story as can many sector ETF that Garrett & I cover in detail in #StockWaves. ⚠️⚠️⚠️
If an ABC down in ES it allows for a bounce and if more bearish any bounce should remain under the 5320 region now. But that does not mean that ES is reliably setup to bounce specifically to 5310.
As we have discussed before sometime in "initiation" moves some smaller degree subwave bounces could get "skipped". We can neither rely on the specific bounces nor rely on that "skipping". We can merely assess #RiskSkew and evaluate the patterns presented.
ES is showing us a three wave move down that can be complete but is stretching rather than starting any possible bounce. ⚠️
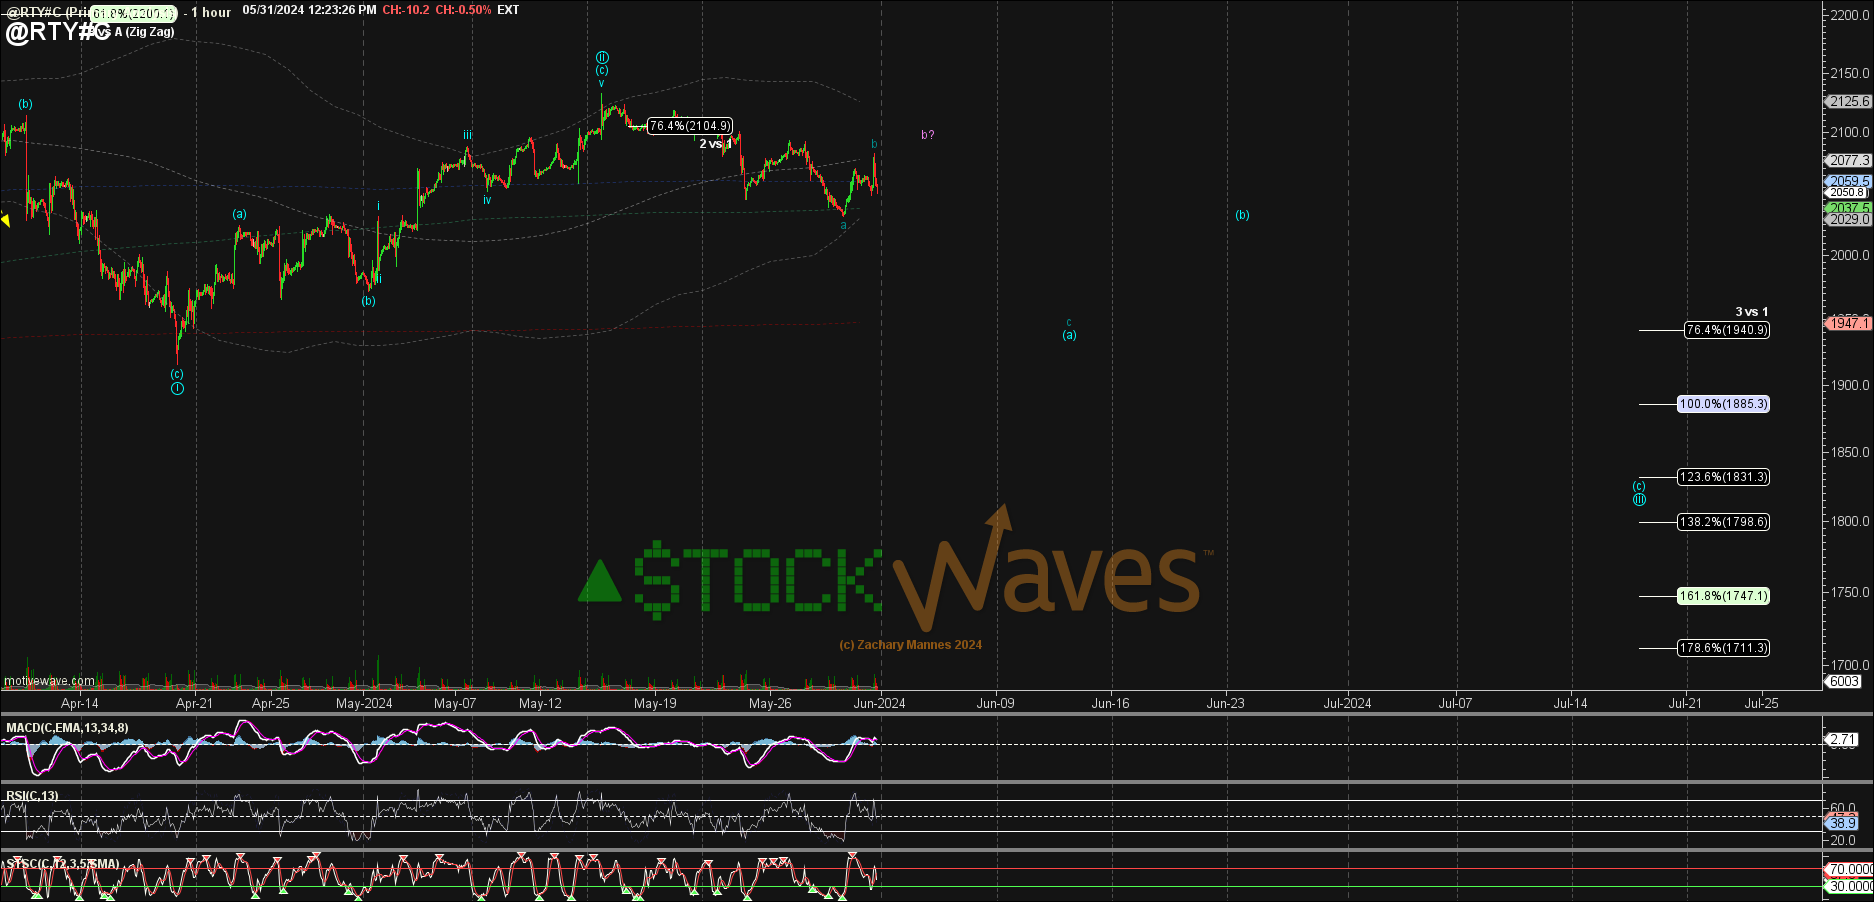
RTY is still not only divergent in that it looks clearly like a top to a (B) wave at a significantly lower high in April, but also clearly held a lower high again in May and seems to be trying to follow-through in a possible Leading Diagonal for wave 1 of (C).
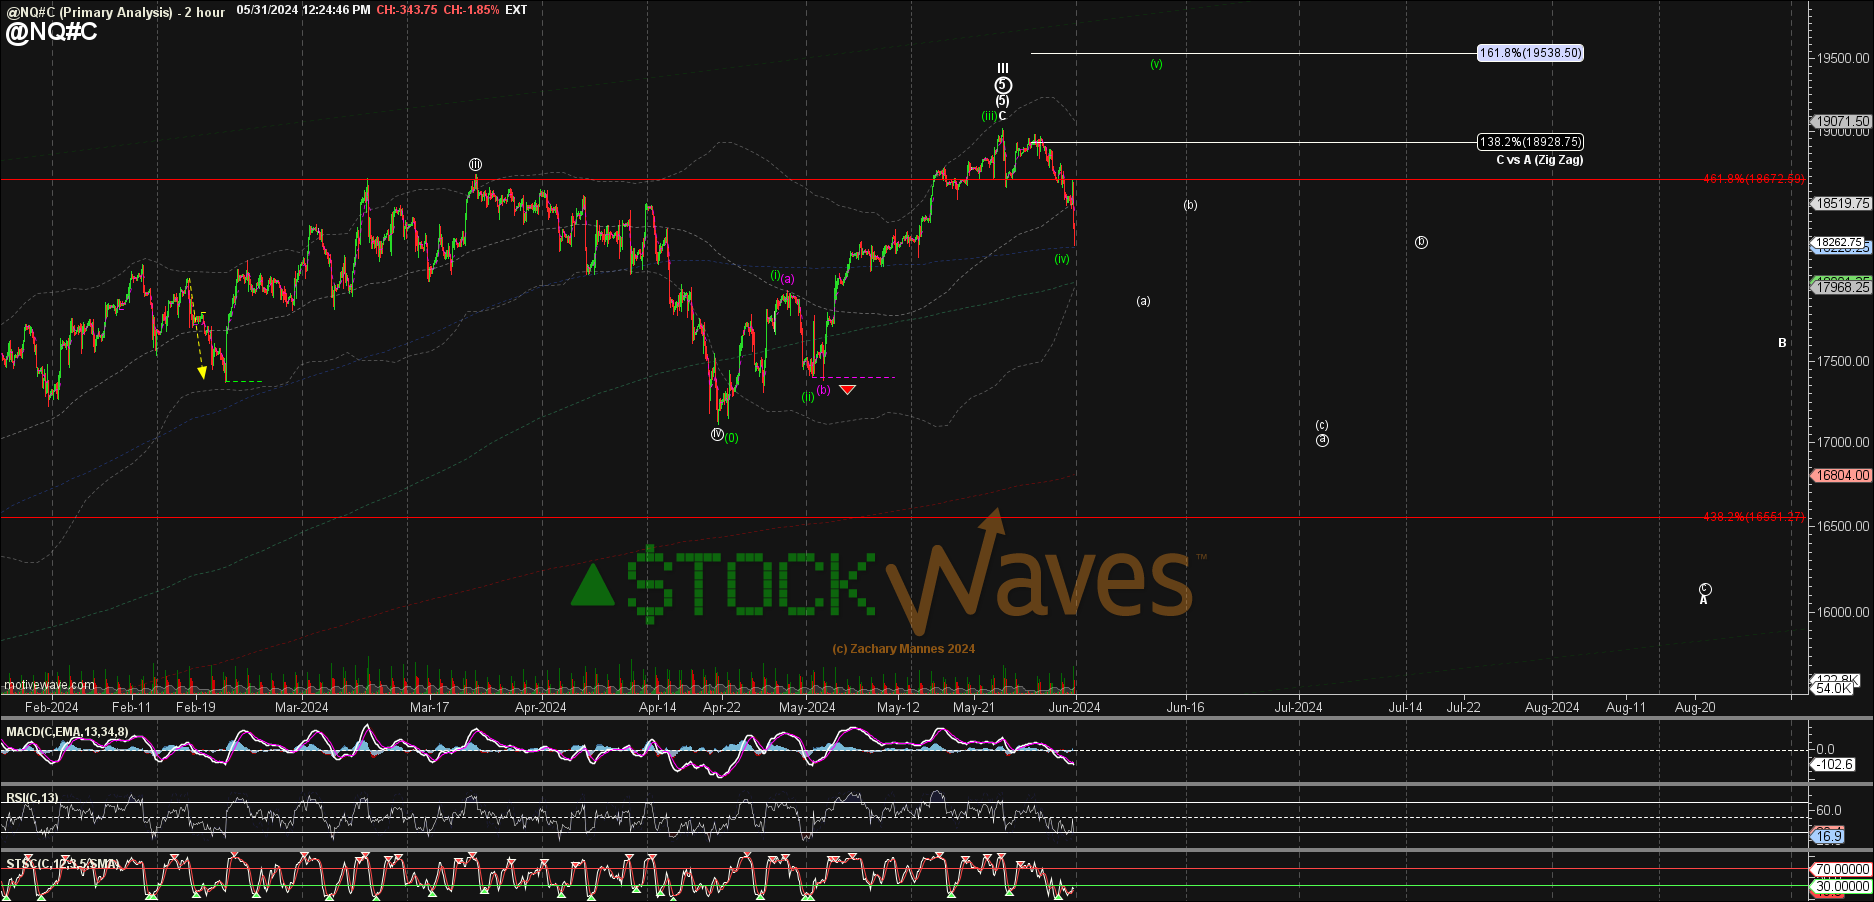
NQ - like ES is (so far) only 3 down, but accelerating... ⚠️ this is the possible support zone for a green (iv) of an ED off April, but a green (v) is certainly NOT reliable.
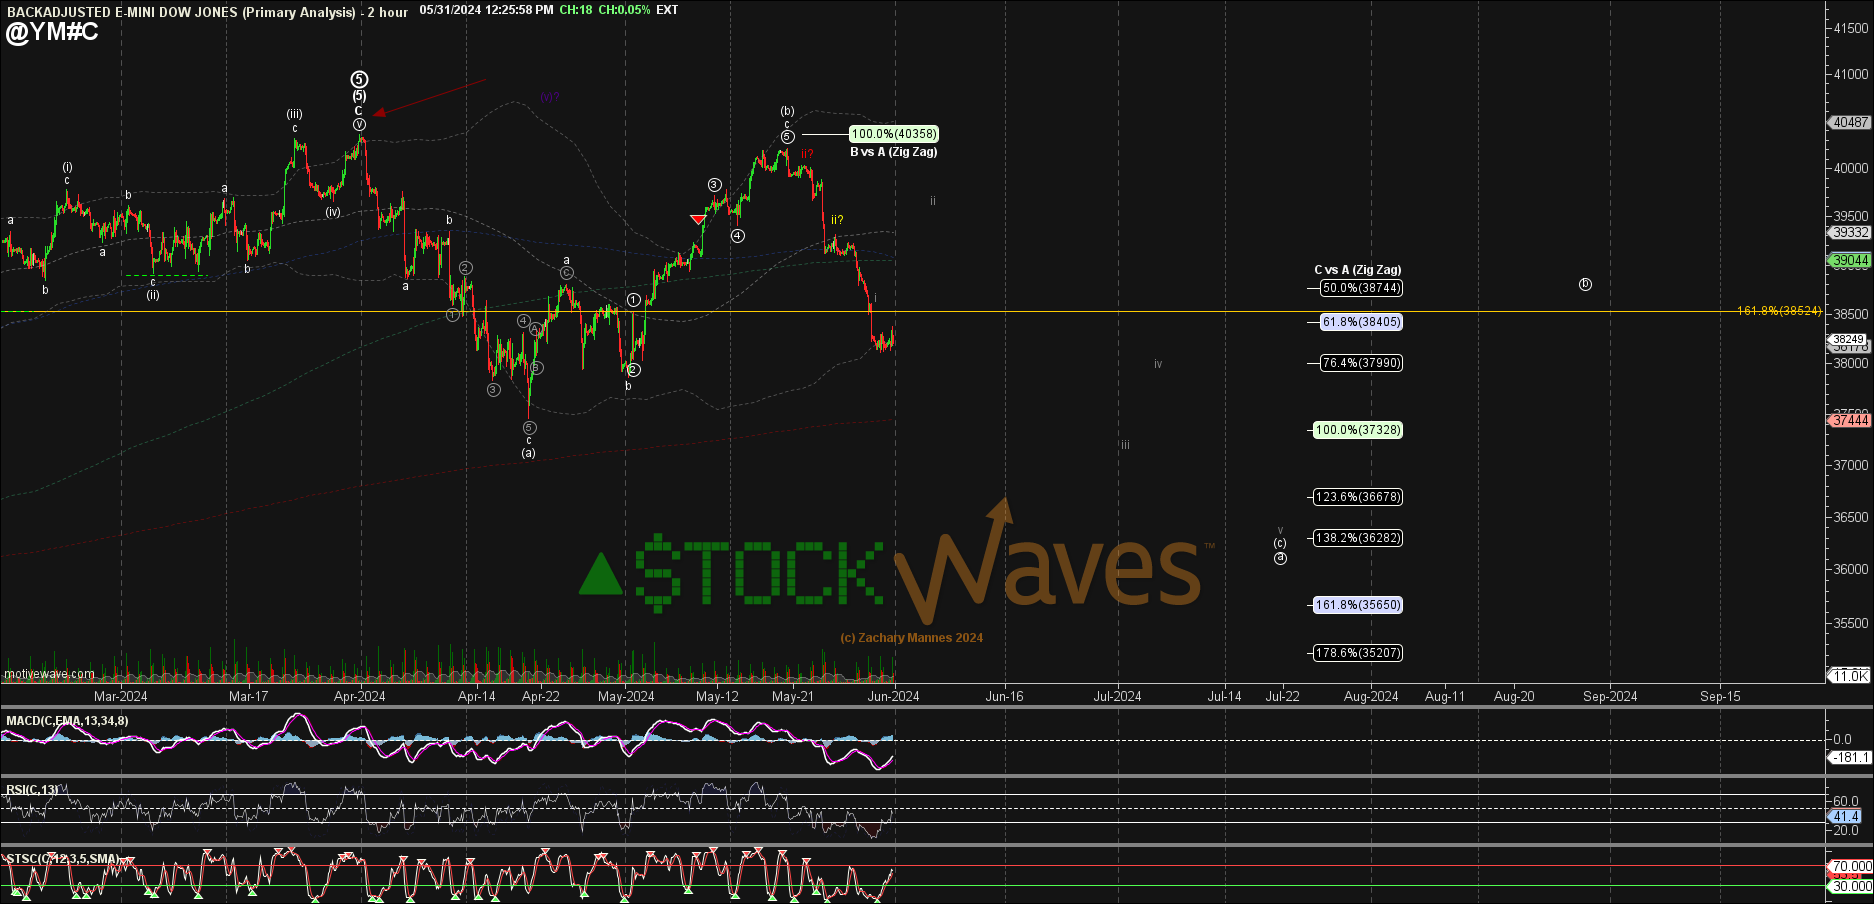
YM is weak-sauce. It held a lower high as a (b) wave, and then could not even bounce in a reliable ii inside the probable (c) down which does not look complete. Technically this could still be just wave i of an ED and allow for another attempt at a ii, but easily further along in the (c).
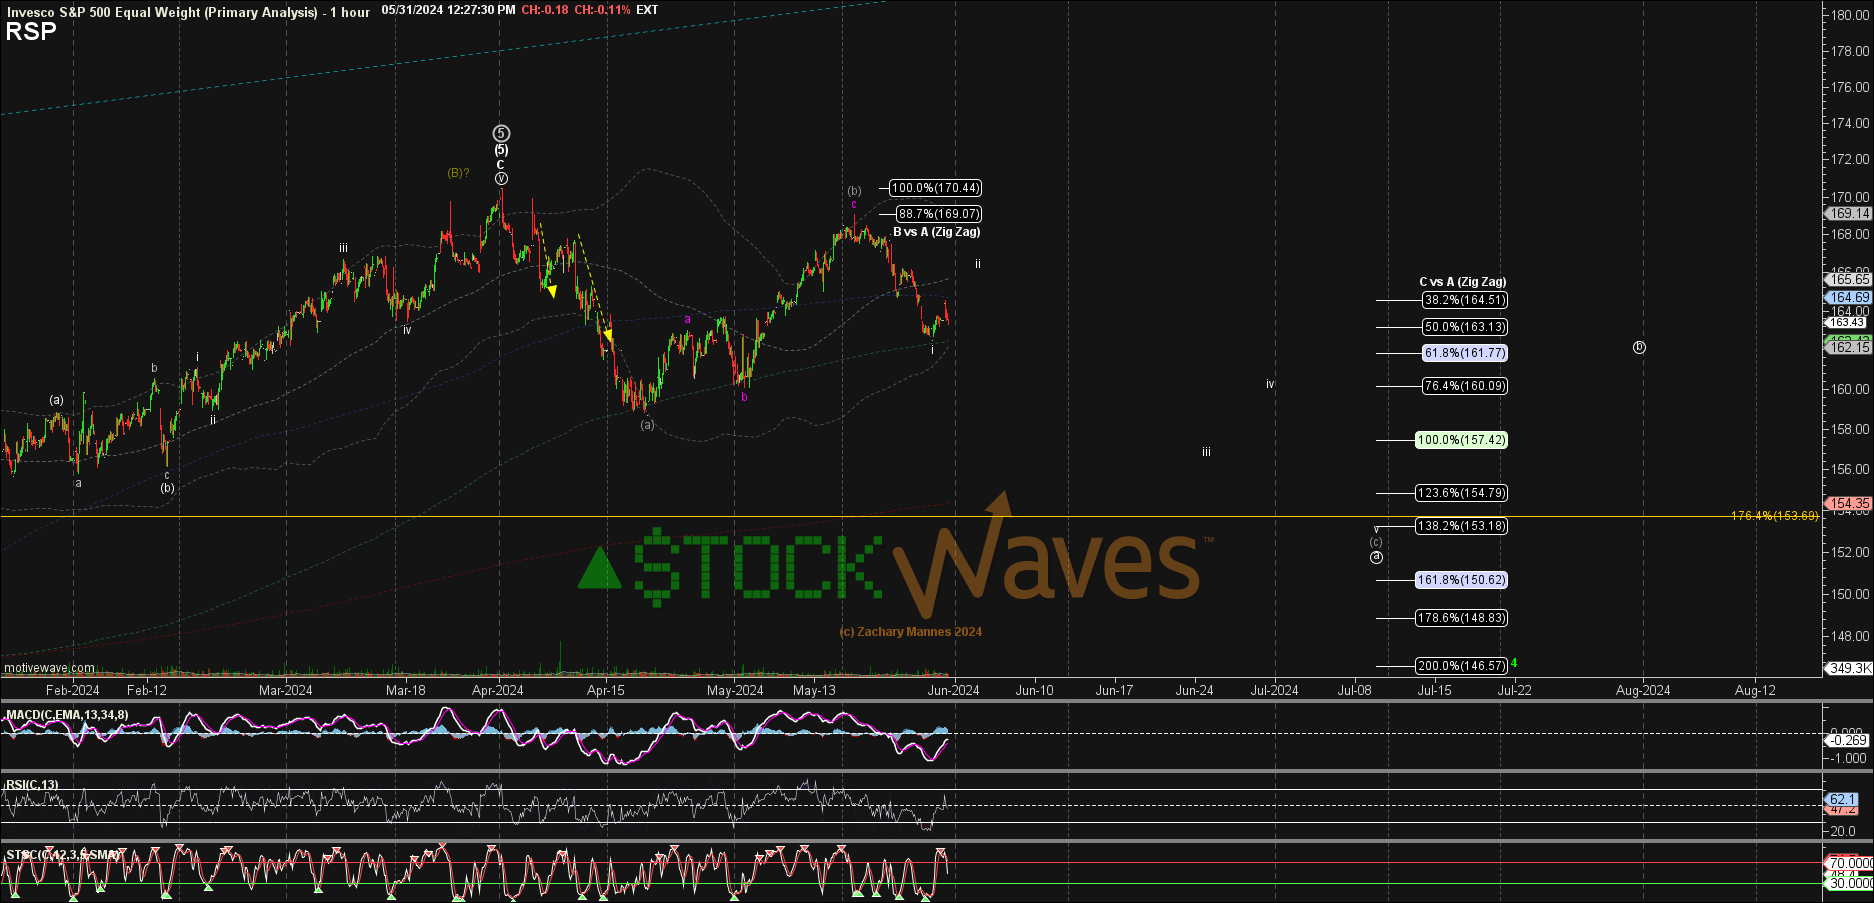
RSP held a lower high for a (b)-wave and has a pretty reasonable 5 down as i of (c). It allows for more of a consolidation as ii, but certainly does not look reliably bullish here.
If you are focused only on ES, you are doing it wrong and missing key information the broader market is trying to tell you. Like-wise if you are only looking at the broad Index charts and not closely at the individual secotrs and the key stocks within you probably need to come check out Stock Waves. 😉