Initial Indications Of a U.S. Dollar Top
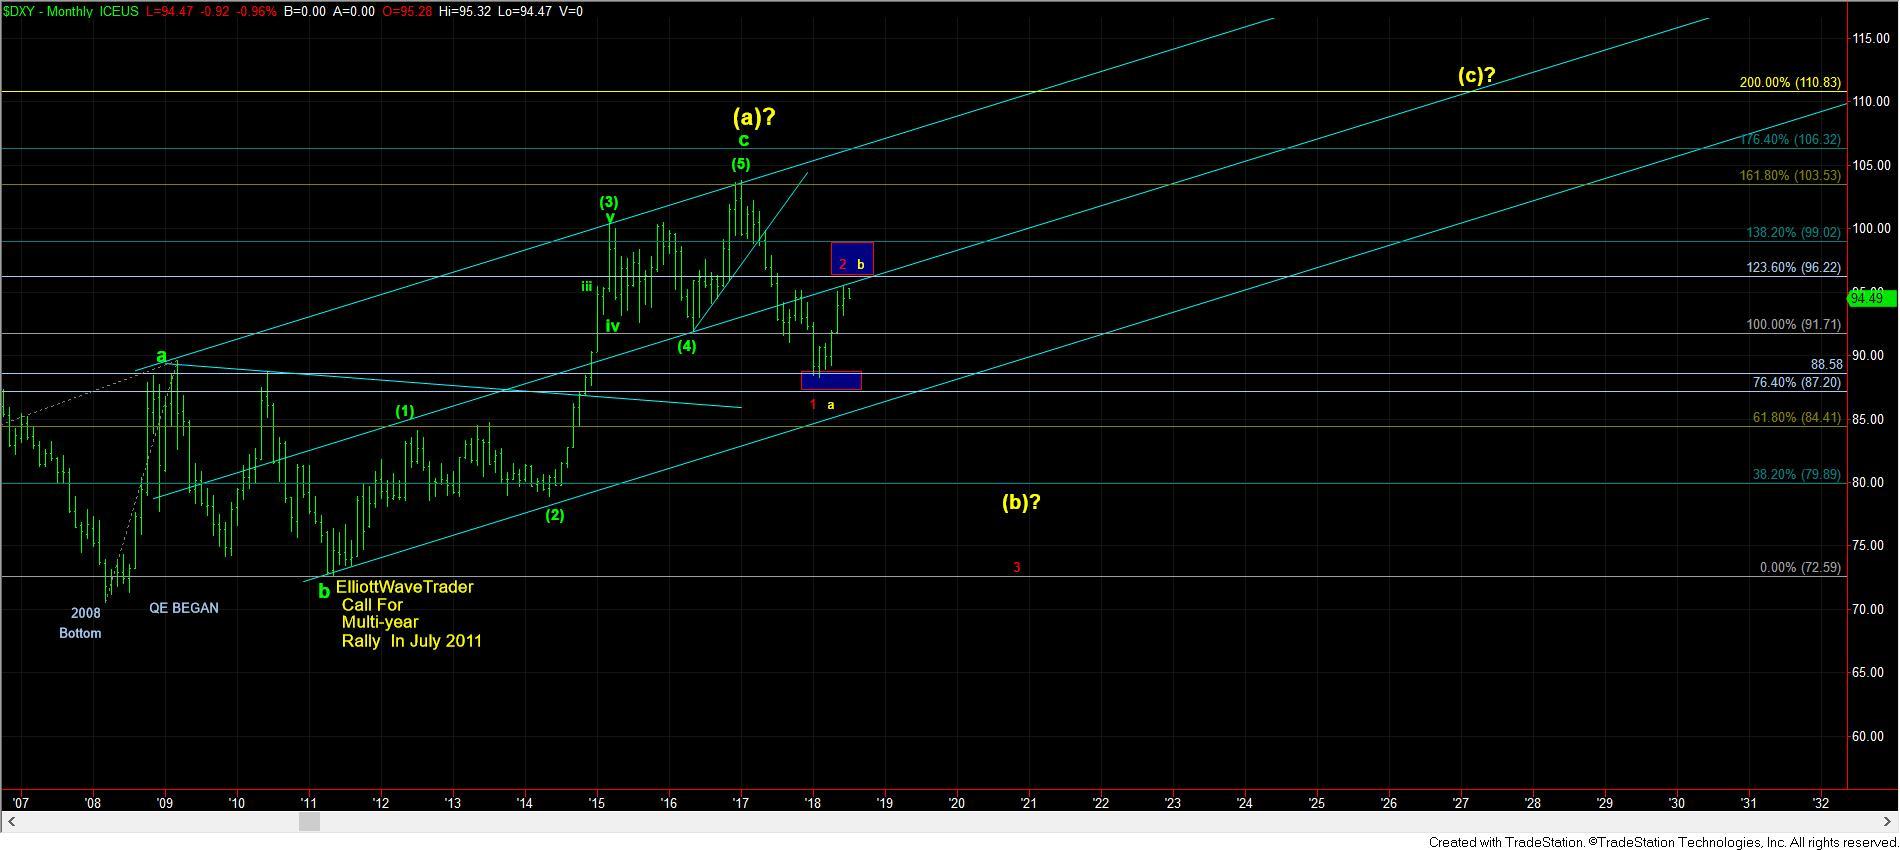
As I outlined in my longer-term U.S. Dollar Index (DXY) analysis, my preference would be for us to be topping out in a wave labeled "(c)" on the chart very soon in the DXY. And, I think we may have seen an initial signal of that potential this past week.
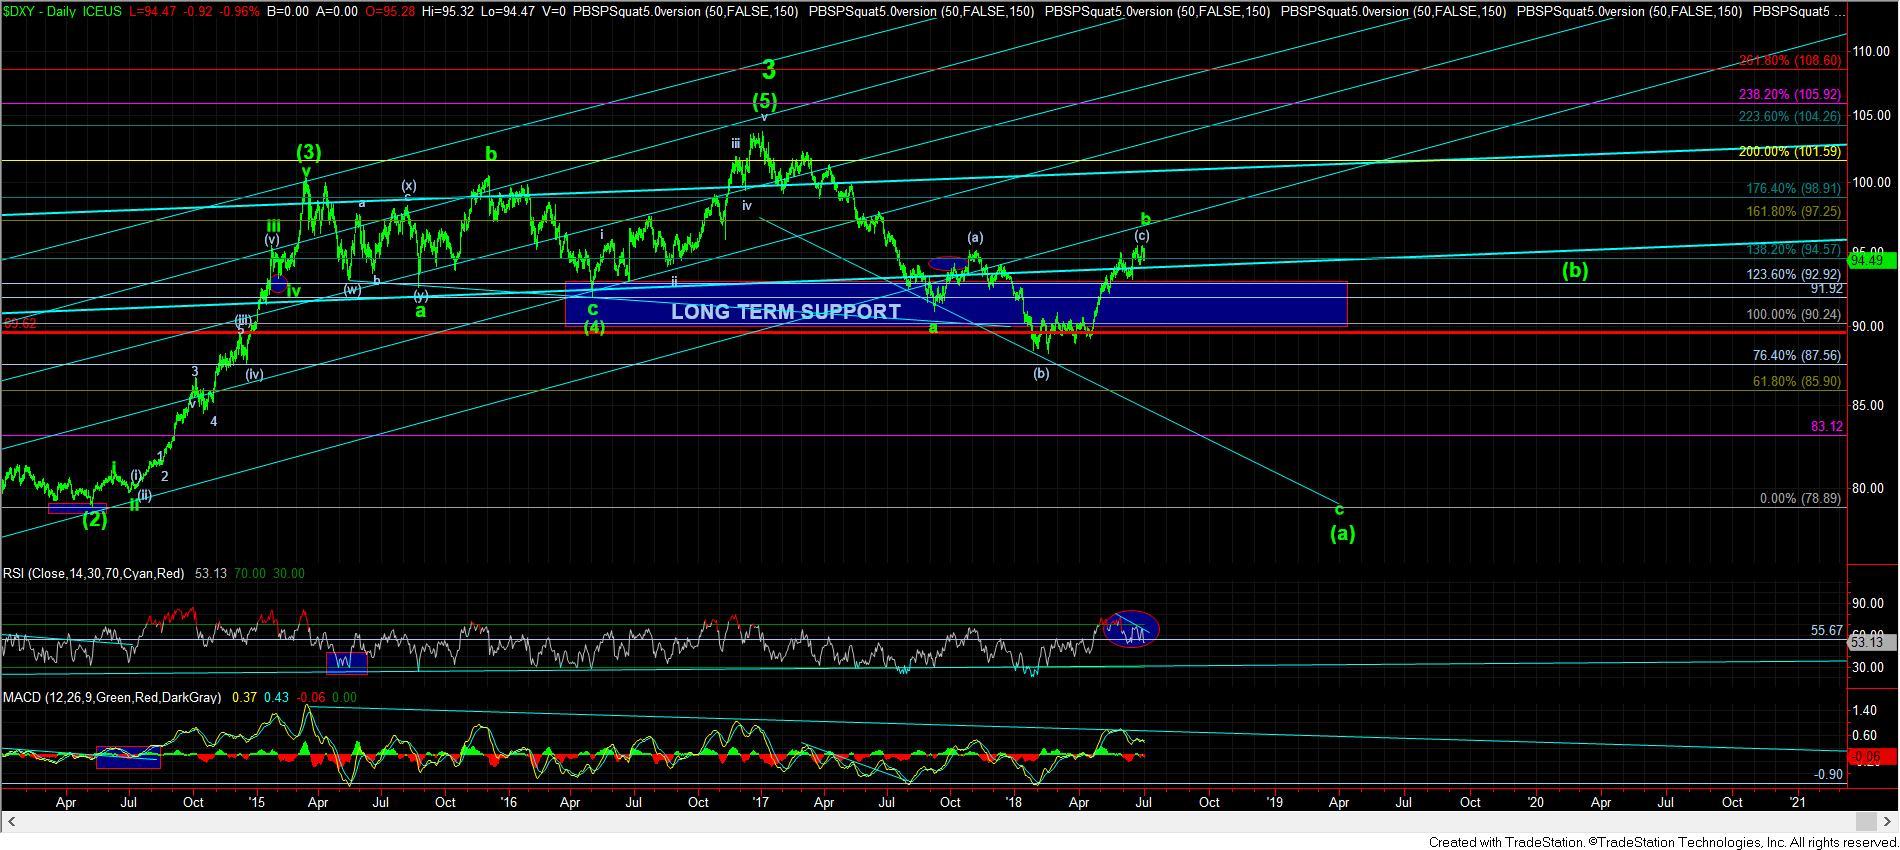
As I noted several weeks ago, the larger degree structure has become much more complex every since the market broke its impulsive structure off the 2008 lows. At this time, my primary expectation is that we are in a very large (b) wave, after topping out in the (a) wave a year and a half ago.
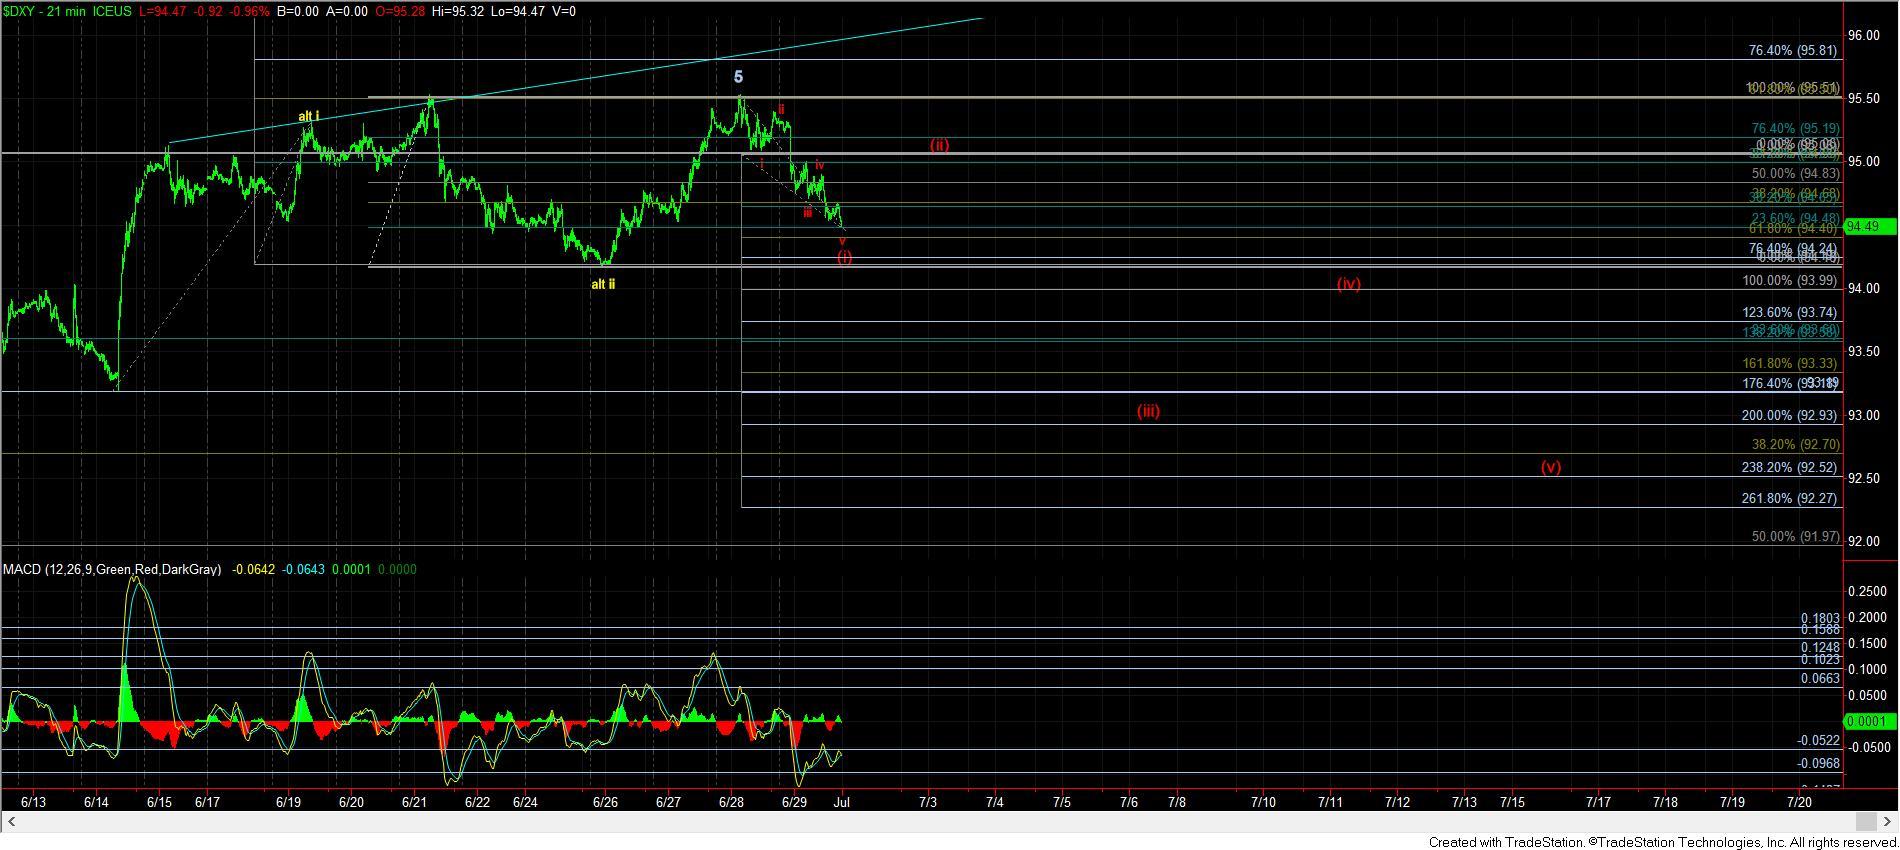
With the smaller degree structure, I have been looking for this (c) wave to top out. And, this past week, it would seem the 5th and final wave of that (c) wave may have provided us with the top we were looking for, which is supported by the negatively diverging technicals on the daily chart.
Moreover, since we struck that double top last week, the DXY has now dropped in what seems to be a nicely structured 5-wave move down. Clearly, I will be looking for waves (iii), (iv) and (v) to fill out in the red count on the 21-minute chart to be confident that we have begun a drop down to the 80 region in the DXY.
Alternatively, if the market should rally back through the highs we struck this past week before we complete the larger degree 5 waves down towards the 92.90/93 region, it opens the door to an extension pointing as high as the 98 region.