Inflection Point Continues - Market Analysis for Apr 15th, 2020
 By
Ricky Wen
By
Ricky Wen
Tuesday was a gap-up and grind up session. If you followed us in the ES Trading Room at ElliottWaveTrader, we demonstrated how it was very important to wait for the higher lows setup during the RTH session to board the northbound train into higher high targets. Essentially, it was just a typical bull flag continuation pattern that played out for the entire day as the bulls accomplished their goal by closing around the dead highs of the session.
The main takeaway remains the same: If you recall, Monday’s session was that the bears failed miserably to break down 2700 or close around the low of the day. This means that the entire 2820-2700 range in the Emini S&P 500 (ES) is just a bull flag/high-level consolidation/feedback loop squeeze setup given the trend above the daily 8/20EMA alongside with price action being above our 2635/2700 key levels. Hence, Tuesday was all about the continuation to the upside targets/resistances.
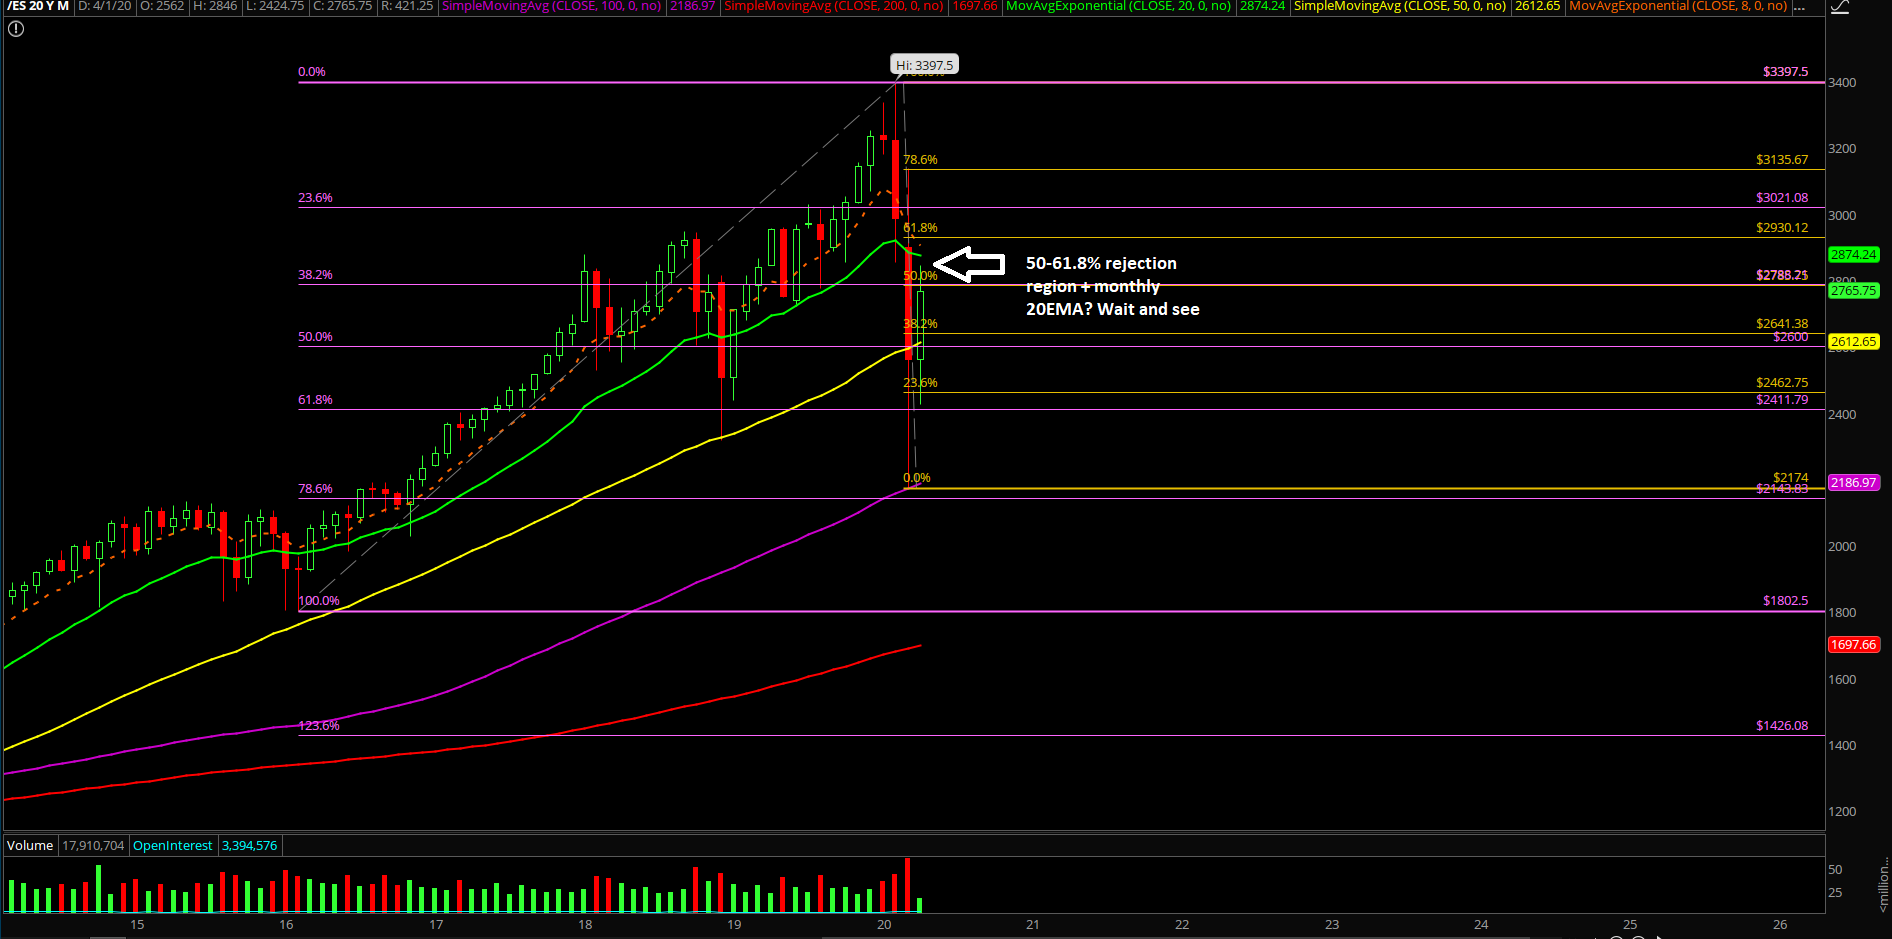
Now, during Tuesday night’s temporary double-top in the 2840s, the market has shown another very good bearish setup for the intermediate picture. Wait and see whether this develops into lower highs or it morphs into a bull flag/high level consolidation again.
What’s next?
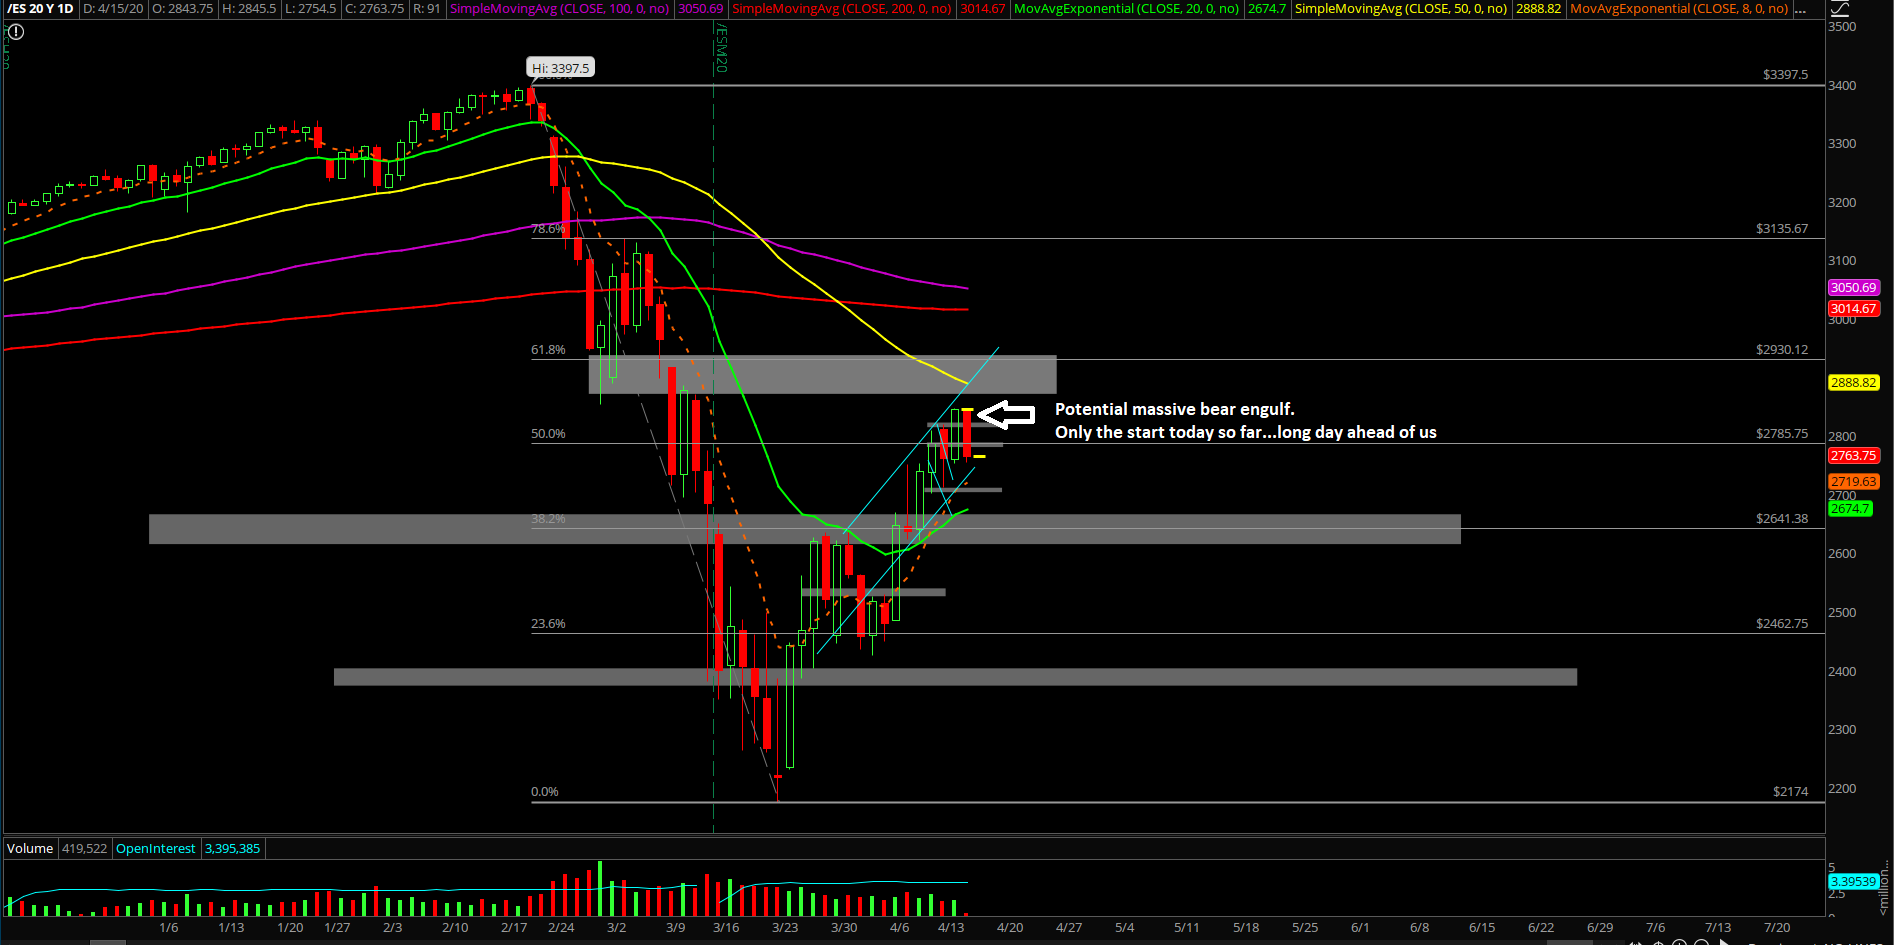
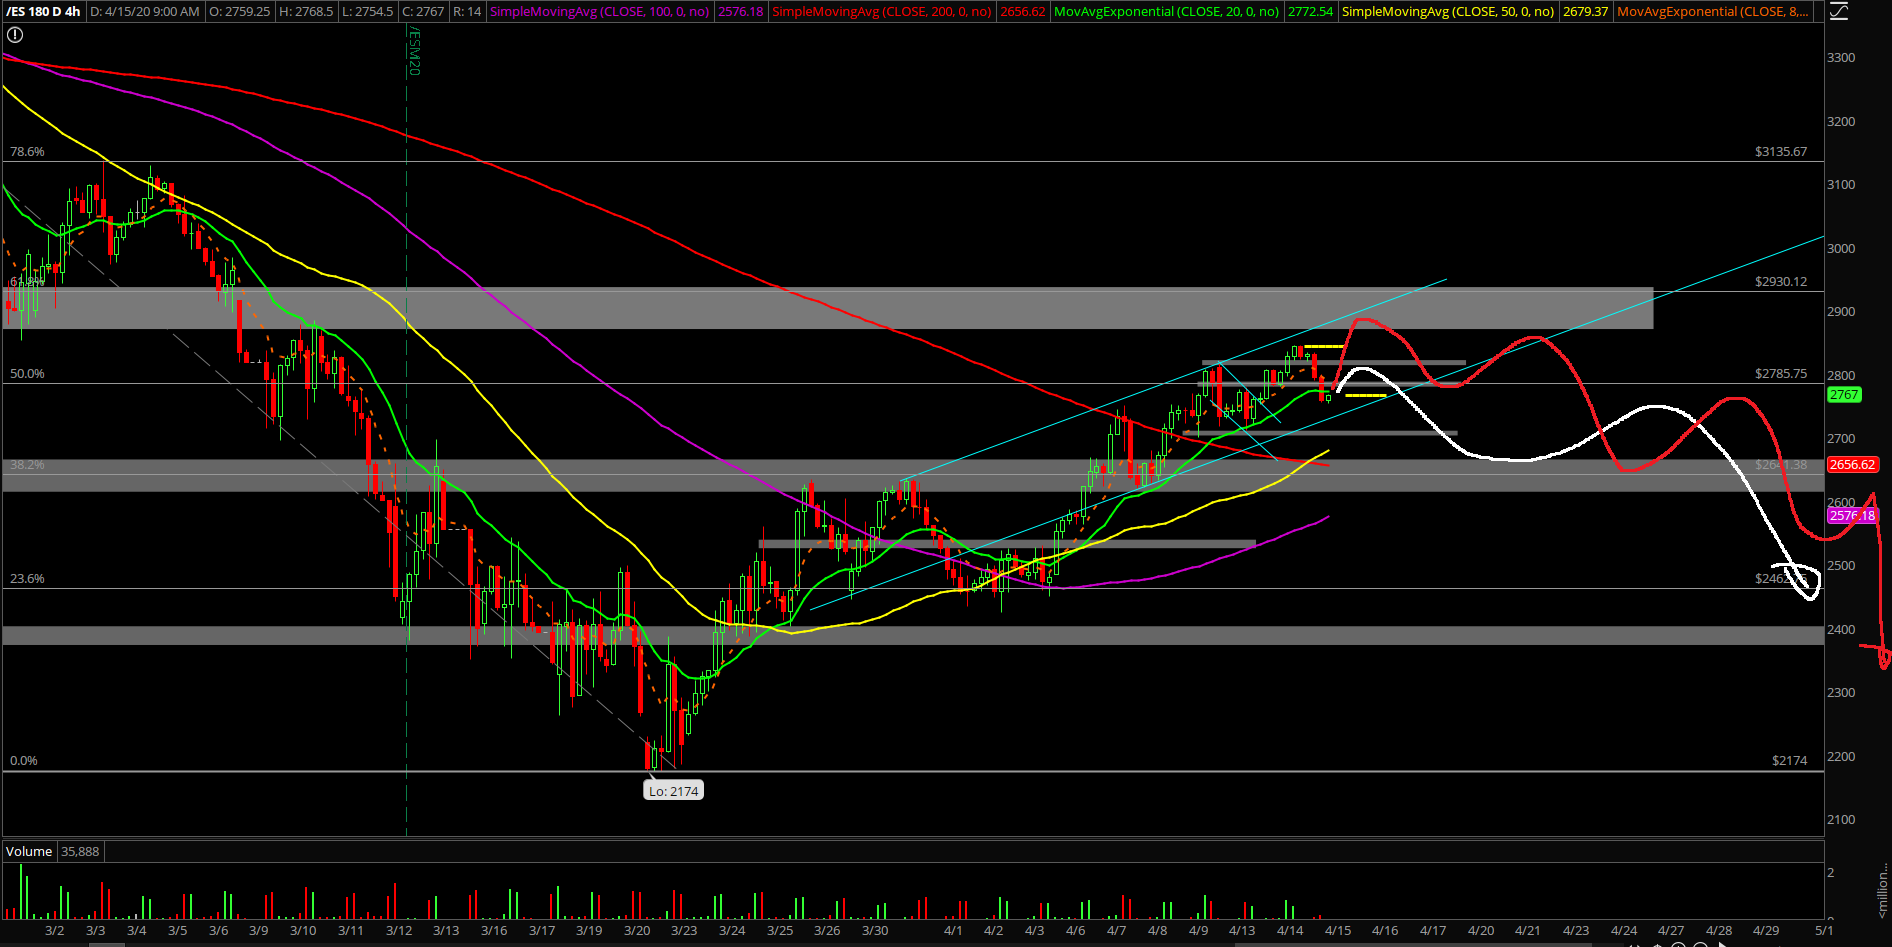
Tuesday closed at 2844.5 in the ES, around the dead highs of the session, which was also above the 50% Fibonacci retracement of this entire drop, 3397.5-2174. The battle lines have been drawn for both sides.
Highlights from our premarket game-plan report:
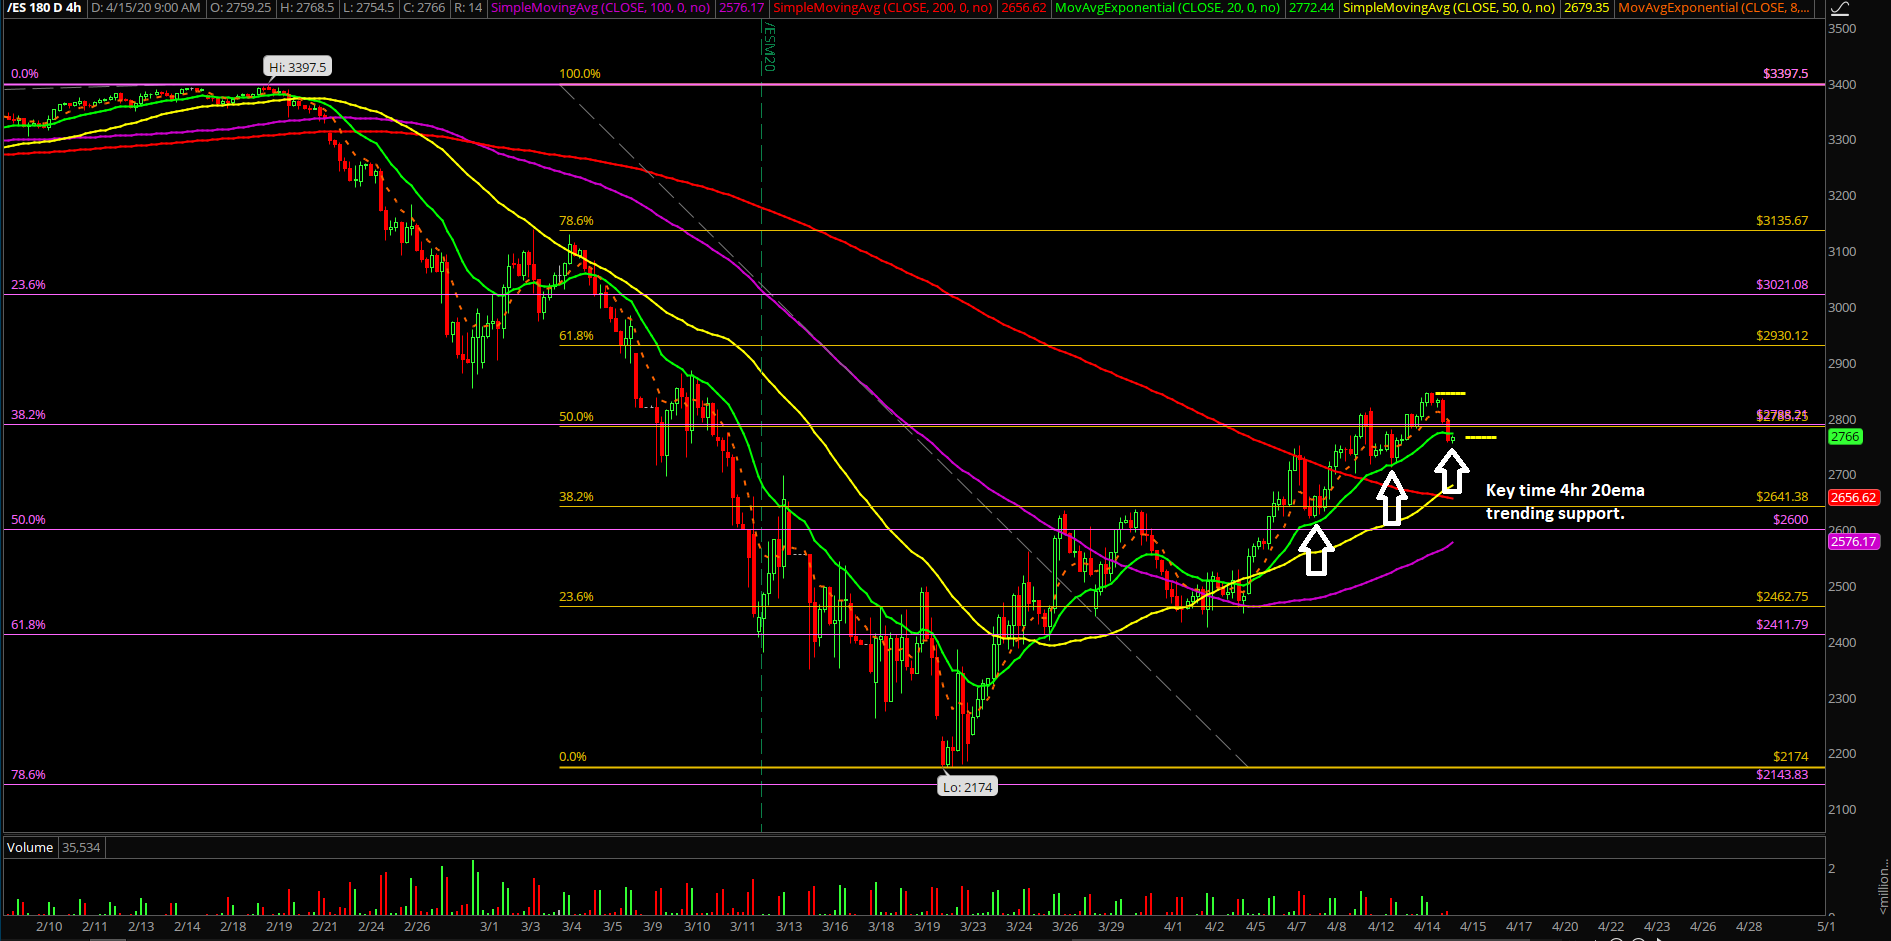
- 4hr white line price projection is primary thesis, red line is alternative. Ignore the dates.
- For now, when price action below 2845, we can effectively treat all setups below 2845 as a lower-high formation until further notice. 2752 is key support now and the battleground for now.
- If you recall from our prior analysis, the first clue or confirmation of a turnaround/temporary top would be breaking below 2750 followed by an immediate breakdown below 2700 key level, which is also the low zone of the past 2 sessions.
- Intermediate bias of 200-500 pts downside from 2840s and maximum upside 100-150 points.
- Continue to utilize level by level approach as we’ve been outperforming almost everybody.
- As explained previously in our ES trading room, we’re still watching this development closely to see if our rough game plan plays out as we work with this mental framework if price action confirms.
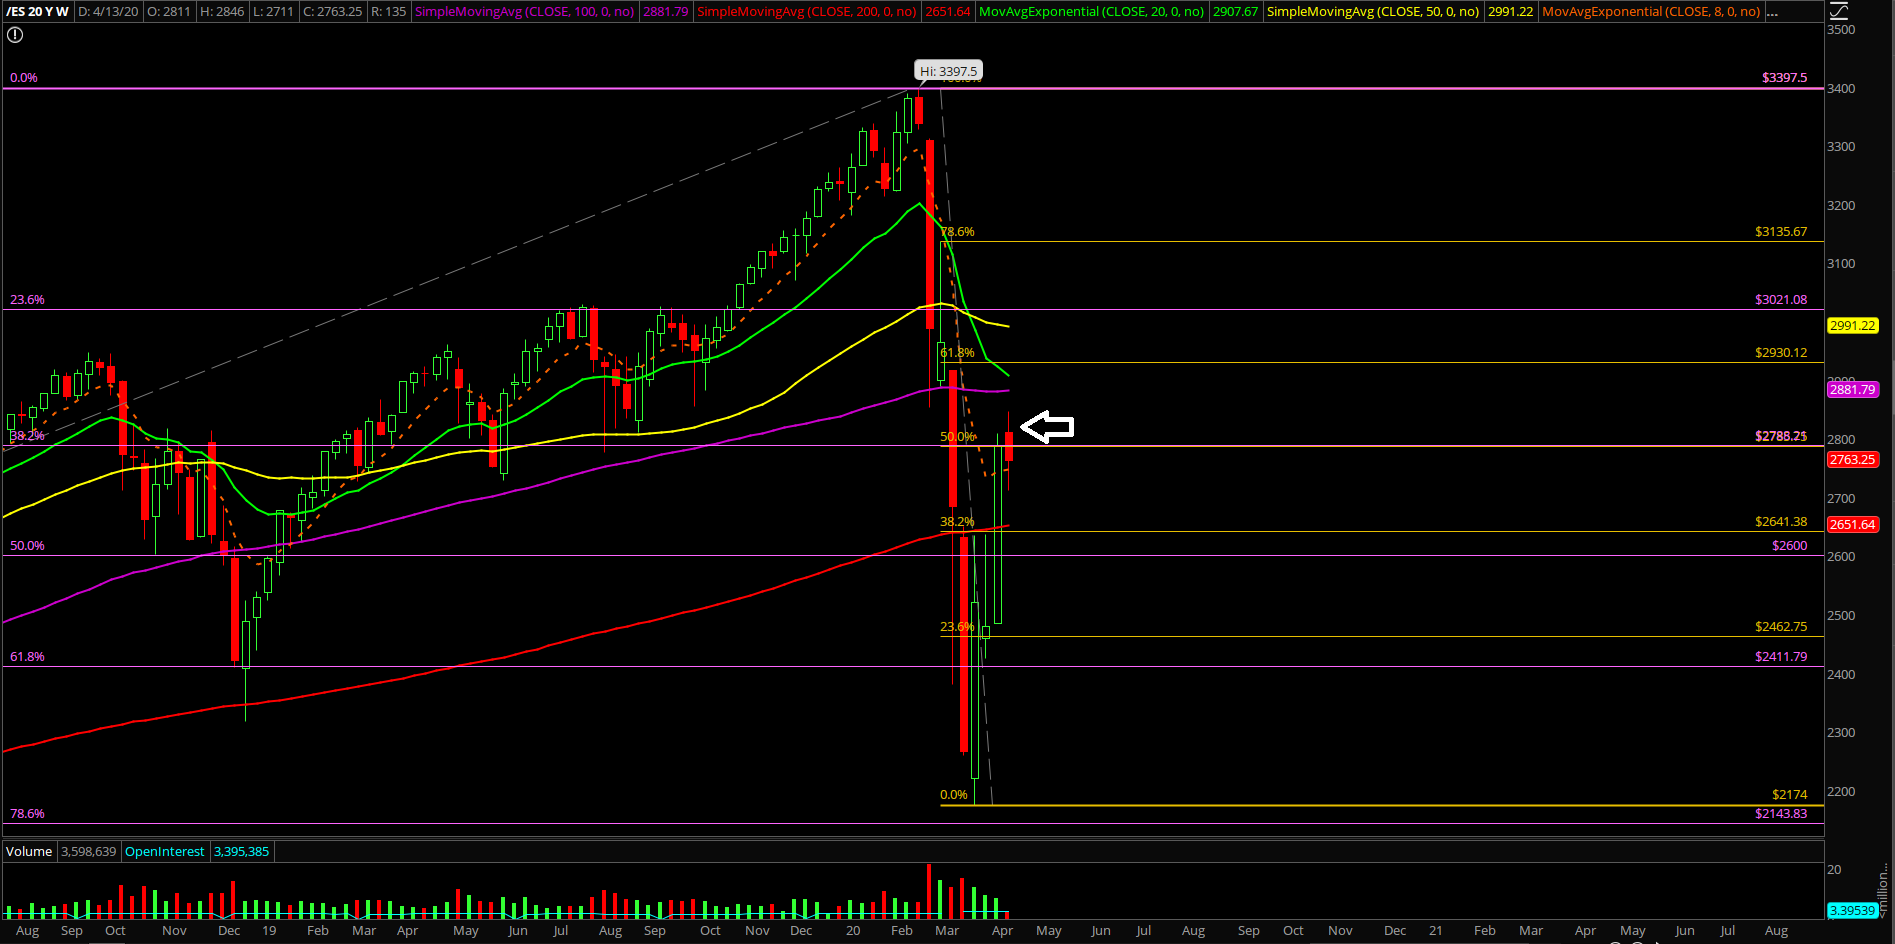
- Zooming out, continue to watch daily closing prints of 2316.75 versus the 2650 battleground given the current situation of the market backtest against the Dec 2018 lows (March 20+23 closed below 2316.75, then from March 24-April 9th closed back above 2316.75…confirming the temporary bottom setup in development. See if we get a complex W pattern on daily chart)
- Dec 2018 lows to Feb 2020 highs range: 61.8% fib = 2729, 78.6% = 2548, 100% = 2316.75
- Feb 2016 lows to Feb 2020 highs range: 50% fib = 2600, 61.8% = 2411, 78.6% fib = 2143, 100% = 1802.50
- There’s some real panic in the global markets and it is greatly appreciated because we’ve been lacking that extra juice in the first week of March as it was relatively easy or a bit too calm like we demonstrated in real-time.
- We’ve been fully prepared with lots of cash on hand to re-deploy into long-term investment accounts in case the shit hits the fan, and it looks like we may get our wish for fire sales across the globe.