If You Love GDX In 25s, You're Really Going To Love It At 23 Or 21
 By
Zac Mannes
By
Zac Mannes
Summary:
-Recent price action in gold and the Miners is screaming "breakout".
-They are coming into a targeted resistance region for the next local top.
-We are still in the early phases of a long-term bull market.
Whether this recent price action accelerates as a full on breakout or sets up for some more consolidation soon, this is the perfect time to come and join us in the Mining Stocks service as we wade through over a hundred individual miners charts; from the big guys like Barrick (GOLD) and Newmont (NEM), all the way down to some of the nano caps we follow, like Vista Gold Corp. (VGZ).
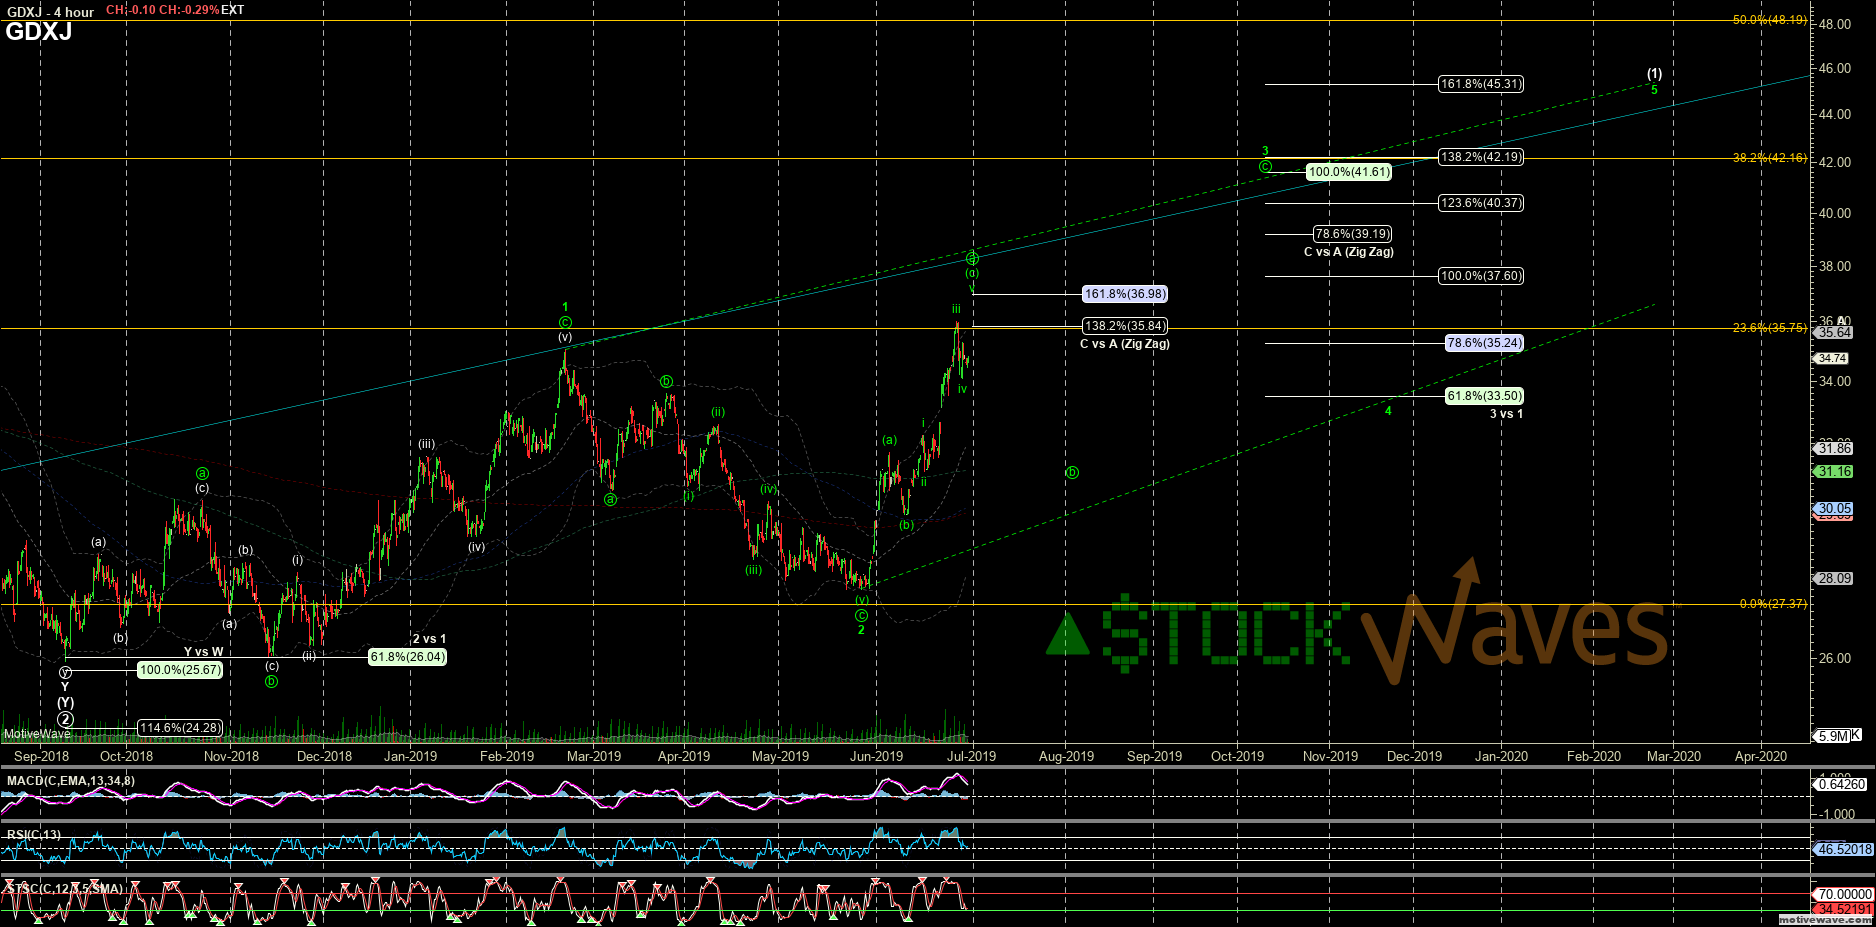
In this video, we discuss our wave counts on the Precious Metals (and copper) as well as the VanEck Vectors Gold Miners ETF (GDX), the Market Vectors Junior Gold Miners ETF (GDXJ), but we also contrast that with The S&P TSX Global Mining Index (TXGM) listed on the Canadian exchange.
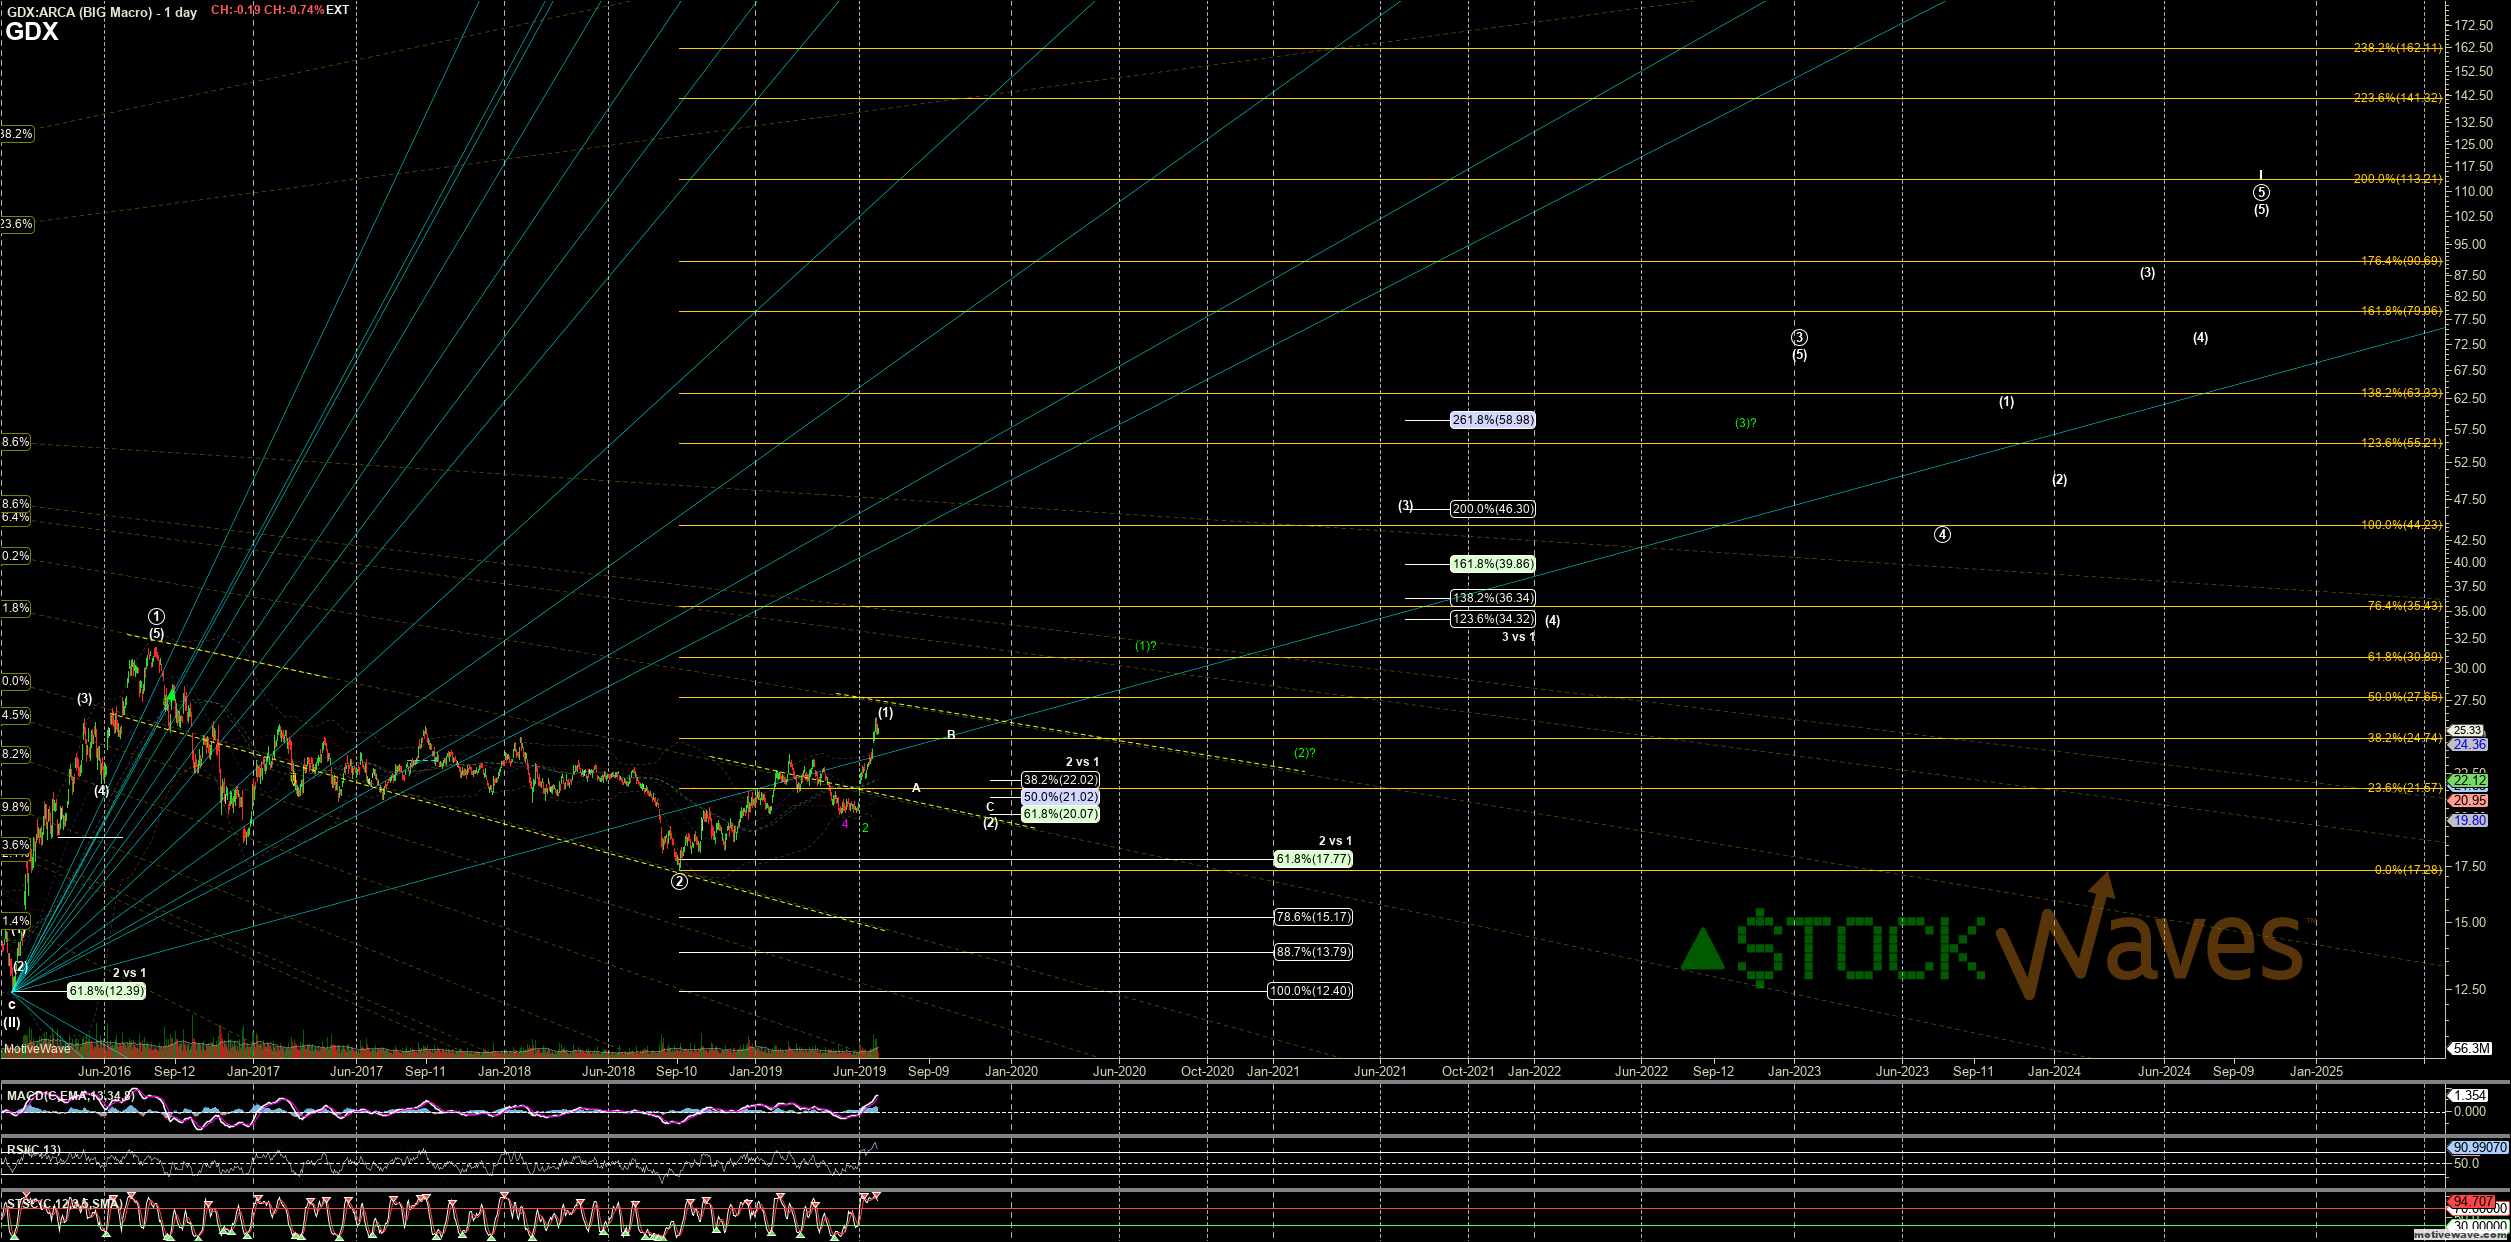
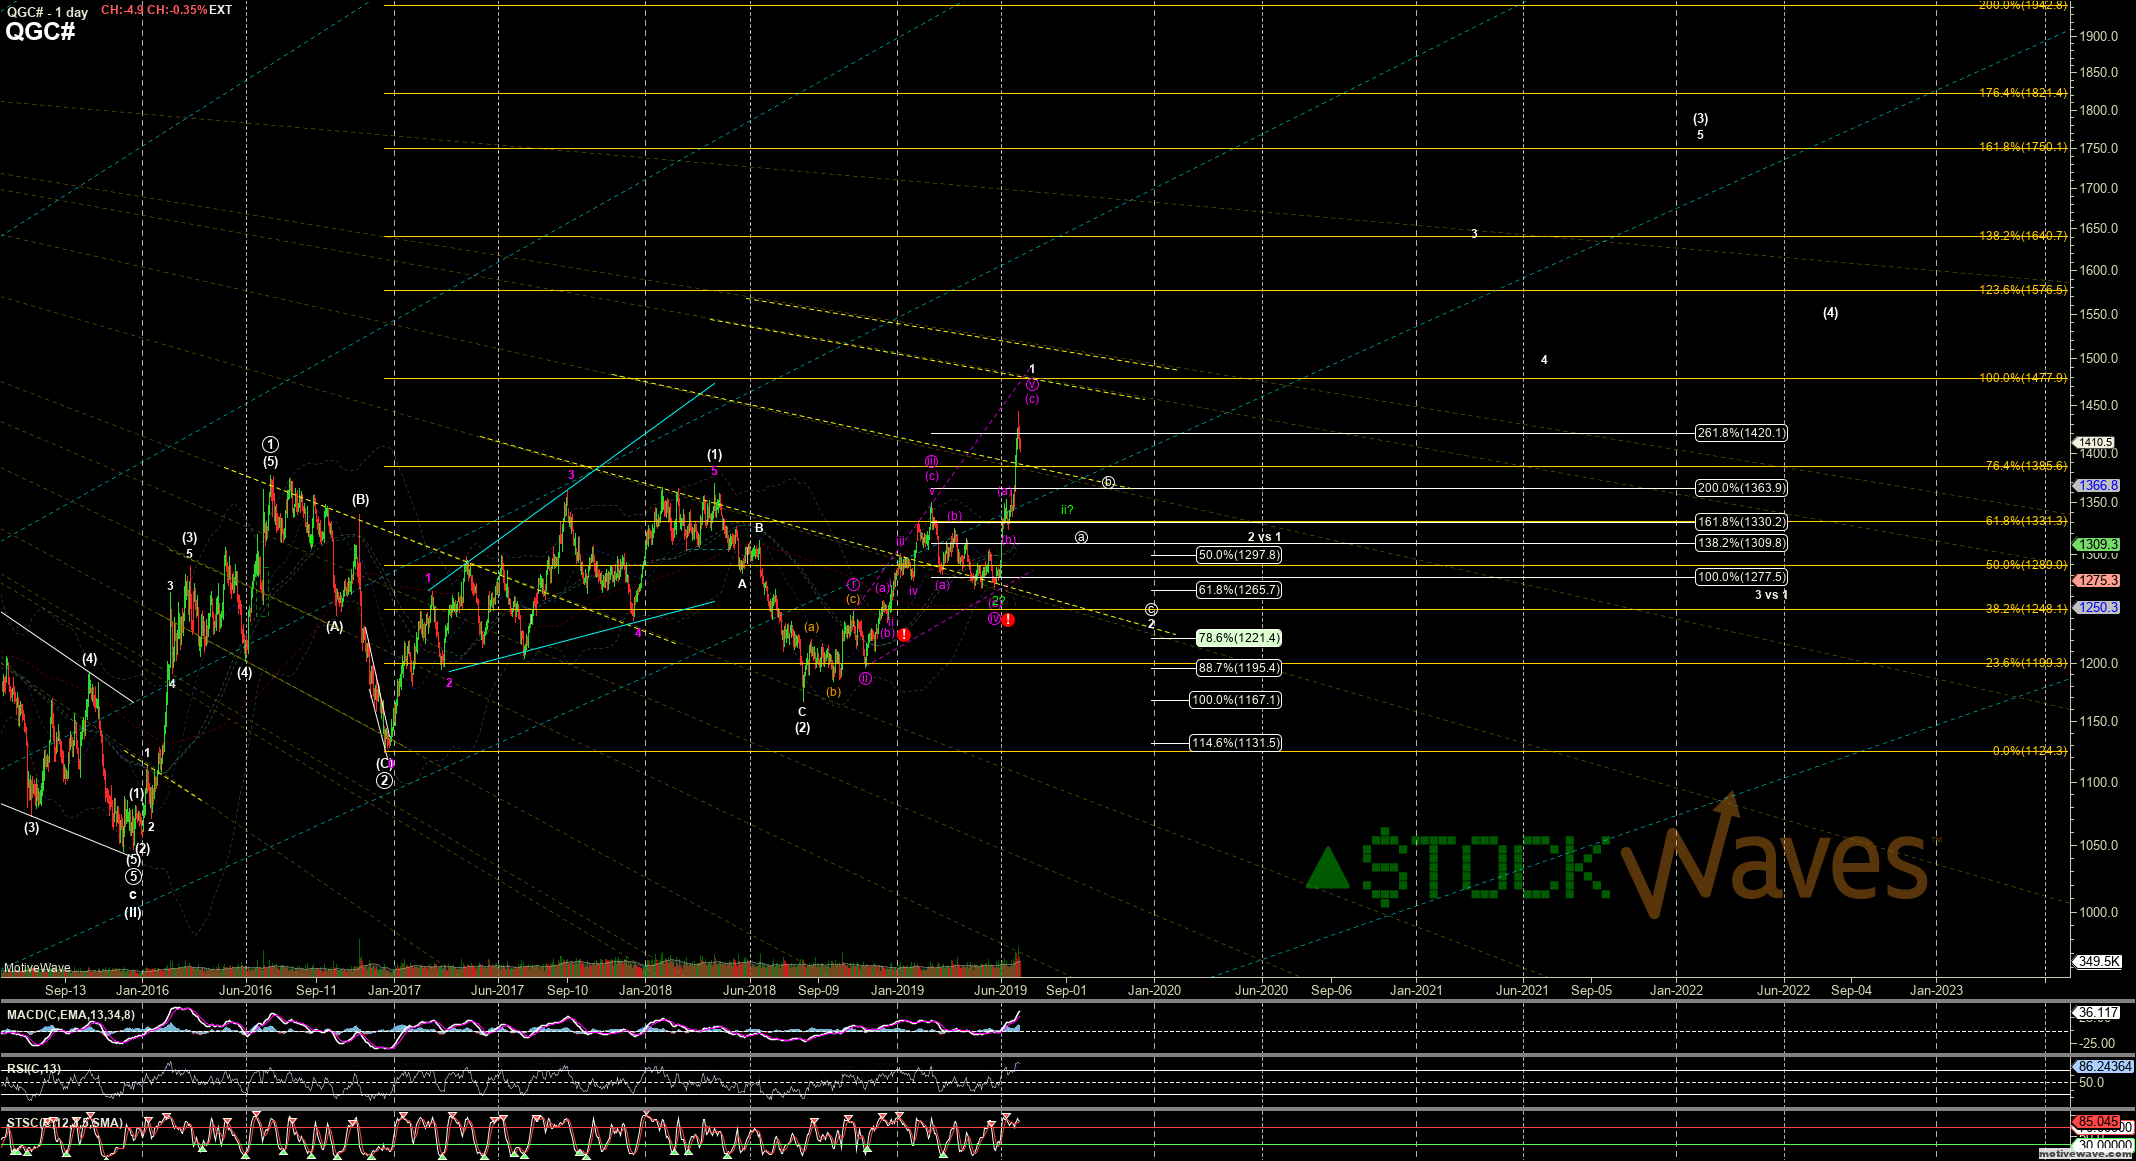
As discussed in the webinar, our ideal counts are coming into the next resistance regions: 26/27 GDX, 1400 on GC, 36/37 on GDXJ, and 78/80 on C.TXGM.X. These can count as the fifths of LDs off 2018 lows for wave one of the three, or as the a wave in the 3 of a larger LD for (1) in GDX/J and a possible i of 3 of (3) in GC. SOME consolidation from those regions is expected, but depending on which path they decide on, it will either be one degree smaller or one degree larger than the recent February to May consolidation.
GDX is just now passing the failed breakout levels from 2017. We attribute much of that past failure to internal issues within the allocations of GDX and GDXJ. In April 2017, it was brought to light that GDXJ which was supposed to be focused on small and medium cap miners was heavily weighted in many of the same top 10-12 names as GDX and even had a large holding of GDX itself. The underlying reasons for this were actually positive, investors wanted small-cap miner exposure. However, the allocation was not within the charter of the ETF, and it would need to unwind and re-allocate. This forced sell-off can largely be blamed for the route GDX and GDXJ took into deeper Primary wave 2 consolidation into 2018 lows.
GDX is a good barometer of the sector, as are the top holdings. These leaders can certainly drag on smaller names. But at the same time, GDX, GDXJ, and many of the larger miners we stuck filling out the larger pattern into the new Primary wave 2 lows counts elsewhere began to solidify.
We also spend a fair amount of time discussing the TXGM. The benefit of TXGM is that, by being less heavily weighted to the top 10 miners and included over 70 different ones, we feel it can provide a better picture of the underlying strength in the sector. It is one of the reasons we were very bullish at the end of 2018 and again in May.
Barrick was an early clue that we would see many names for a larger Leading Diagonal for waves (1) of the Primary 3 starting off the late 2018 lows. Even before it drifted into a wider flat for wave 2 off the March high, the structure up from September to December was not a clean five waves up. The 16/17 region should be local resistance as just the a of the 3 in the larger wave (1) as discussed. Long term, the Primary wave 3 targets 64 or even 90.
One of the individual names we discuss is Royal Gold (NASDAQ:RGLD). RGLD has a more traditional "nested" Elliott Wave setup. Having held a Primary wave 2 low back in 2016, it has a complete (1)-(2) of P.3 already and even a complete 1-2 of the (3) of P.3, the strong impulsive move off the recent May low looks like 5up as i of 3. Ideally, it would get a small fade back toward 90 region as the ii, but it is very near the HEART of the iii of 3 of (3) of P.3. One of the strongest names with continued breakout potential. Just the 3 of (3) of P.3 targets the 145 region.
One of our favorite long-term names is Freeport-McMoRan (FCX). It has not yet confirmed the bottom of a Primary wave 2 low and could even fade toward 7s still, if the recent low at 9.60 fails. The Primary wave 3 in FCX projects toward the 80s, so the long-term risk:reward is phenomenal.
One of the names that we think has a high probability of significantly outperforming many of the miners is Coeur Mining (CDE). This name made a new low for a deep Primary wave 2 bottom into May. It hit the exact 76.4% retrace of the strong initial move off the 2016 low. It has not yet confirmed the start of Primary wave 3, but it looks good off the lows so far, and we will continue to track its progress closely. Since EW works strongly with Fibonacci ratios to prior moves, the fact that the Primary wave 1 on CDE was over 900%, the Primary wave 3 projects (conservatively) to an astonishing 1,600%.
We remain VERY bullish long term the entire sector and see a tremendous amount of upside ahead. Many individual names are still just starting waves 1 of (1) of larger P.3, so there is plenty of meat on the bones. As discussed, some of the ambiguity seen in the GDX can be explained by looking at the various "factions" within. Some of those individual names clearly argue for the 3 of the larger LD for (1), while some say 5th of (1) completing, and a few others can be more immediately bullish. The benefit of the Mining Stocks service and MP is that you can optimize your own portfolio to take advantage of the nuanced clarity of those charts while maintaining broad sector exposure.