If Cool Heads Prevail...
 By
By
Where We've Been:
Today's mood pattern reflected the busyness of preparing for a holiday and possible travel. MMI was up. There was a caution to watch the level of yesterday's low should this pattern show up negatively, as it would likely be intense. However, the market managed to stay above it and closed the day slightly higher.
Where We're Heading:
Thursday's mood pattern can accompany serious or destructive events. Hopefully this is simply reflecting normal holiday travel frustrations related to Thanksgiving in the U.S. as well as having to deal with the serious considerations of navigating the ambient Covid-19 situation. However, it does point to an added risk of violent incidents Thursday and/or Friday. Friday's mood reflects a continuation pattern. Friday will continue where Thursday leaves off. Can cool heads prevail over the next couple of days? We'll see.
MMI for Friday open is down. MMI for Friday is the same direction the market opens unless there is ambiguity such as futures being down but in a strong rally in the half hour prior to RTH open or vice versa which would make it a no call. CDMS for Friday will be either a buy or No Trade depending on the MMI for Friday.
MM Trend Trader remains full on bullish. A break below the bull / bear trend line would imply the resumption of a temporary sell-off which may or may not be sizeable, but likely short-lived.
Internet search theme source data for MMI inputs (for Thursday and Friday): car, crash, injuries, death, police, grief, man, sport, sickness, resting, fight, injury, penalty, TV, dance, competition, woman, music, clothes, internet, name, meaning, winners, losers
Next 3 Days (days 2 and 3 are considered preliminary):
Date | Daily MMI | MMI 2* | CDMS** |
11/26 (open) | Down | Up | X |
11/26 | Same as 11/26 opens | Down | Buy or No Trade |
11/29 (open) | X |
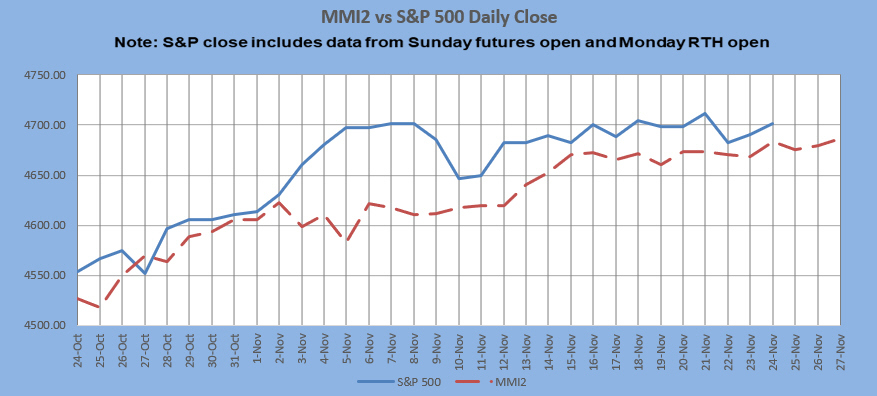
*MMI 2 uses an alternate dynamic algorithm to convert the same sentiment source data to S&P direction as the original MMI algorithm.
**Composite Daily Mood Signal (CDMS) combines the MMI daily signal and the various MM trend and trading indicators into one overall daily trade signal. Possible signals are buy, strong buy, no trade, sell, and strong sell.
Latest charts follow the summary table.
MM Indicators and Trading Parameters Summary:
Indicator | Scope | Direction |
LTTI | Longer Term Trend | Bullish |
MMTT (main) | Medium Term Trend | Bullish |
MMTT (HP) | Medium Term Trend | Bullish |
MMTT (b/b) | Near Term bull/bear Trend Line | 4696 SPX (cash) |
MM MACD | Swing Trade | Neutral |
Note: Medium term is roughly 1 week to 2 months. Longer term is roughly 1 month to a year or more.
Base case, Friday opens down, Friday MMI down
Alt case, Friday opens up, Friday MMI up
Either way Friday opens:
Intermediate Term Forecast:
The larger market trend remains up, with a pullback that may still be in progress. The remainder of the year, the market should continue in its topping process, getting ready for what could be a substantial pullback for early 2022.
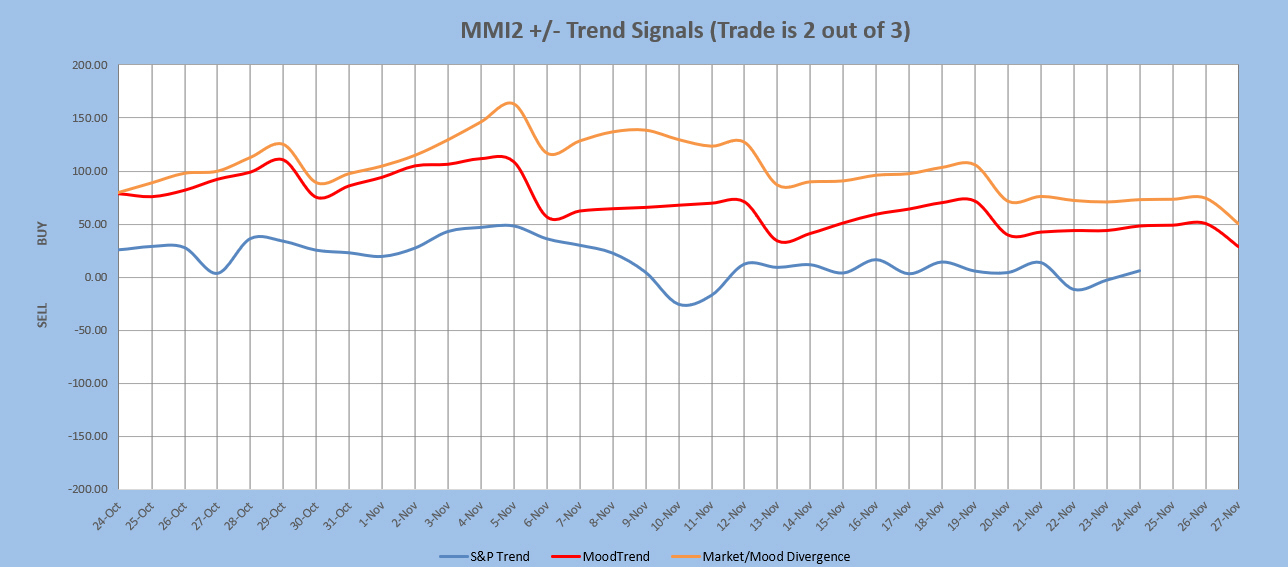
MarketMood Trend Trader
The chart below uses three sentiment trend lines to generate a swing trade signal of BUY if 2 out of 3 are greater than 0 and SELL if 2 out of 3 are less than 0. Trade length averages 9 days, but can be as short as 1 and has been as long as 60. The signal is updated each day after market close. Back-testing shows this signal averaging about 12 SPX points per trade over the last few years. Back-testing a higher probability signal derived only from the two mood related trend lines averages 33 SPX points per trade, but only initiates trades about once every 3 weeks. Note: past performance does not guarantee future results.
Current signal: Buy since 15 Oct. HP signal: Buy since 24 Oct.
MM MACD signal is SELL and the intermediate trend is UP. There is no swing trade signal.
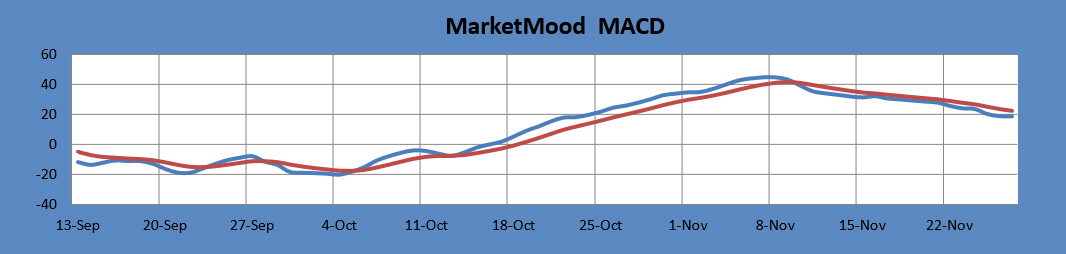
The MM MACD is similar to a standard MACD, except that it uses the MMI signal data to extend several days beyond today, while the standard MACD relies solely on historical market data.
Long Term Forecast:
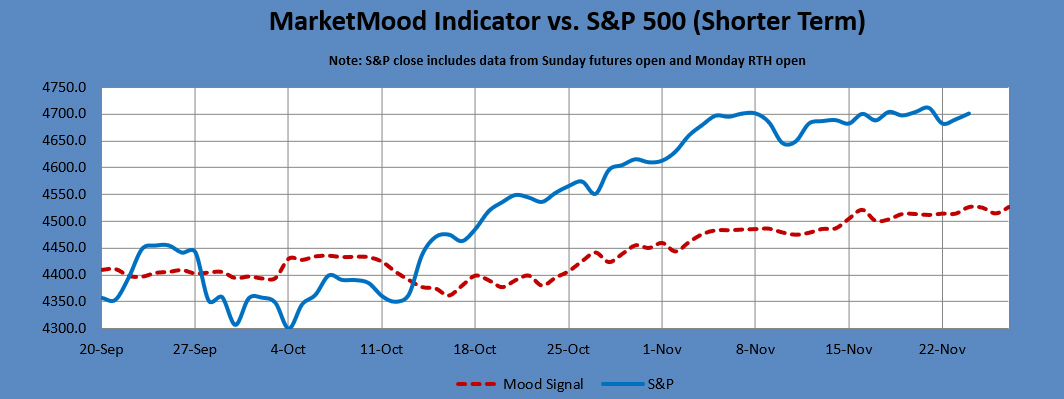
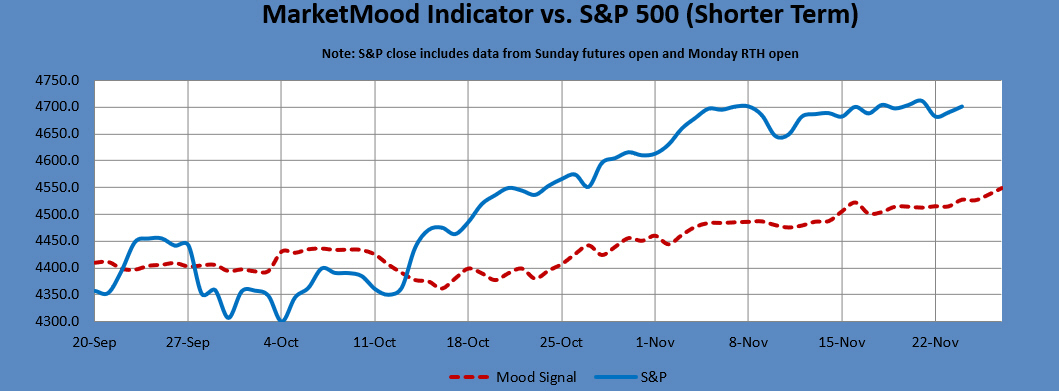
The long term trend is indicated by the general divergence between the stock market and the mood generated forecast (see long term chart below). The MM Long Term Trend Indicator (bottom chart) which is derived from this divergence, indicates: "Bullish Trend, hold long long-term positions." The MM LTTI has had this indication since 4 Nov 2020.
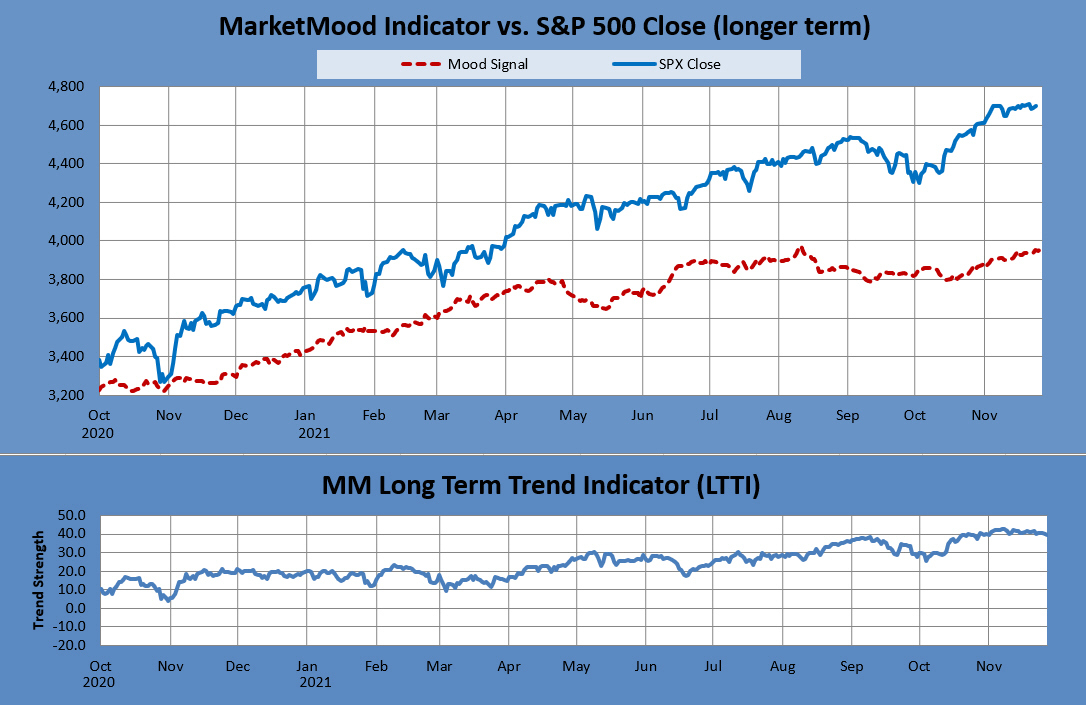
The MM LTTI measures trend strength using the divergence between the market trend and the forecast trend.
Note: Changes to next day MMI signals occur about 5% of the time, and will be announced in updates as well as the daily report should they occur. Same day signals will not change. Day 2 and 3 signals reflect the most current information, and are subject to change. The default trade per the daily signals is executed at market on close. except on Mondays, as there is a signal for Monday open (i.e. "weekend close") and Monday close. Historical data implies that the daily MMI signals tend to be correct as daily direction calls about 63% of the time over the long term.
