Identifying the Twists & Turns In Energy
 By
Zac Mannes
By
Zac Mannes
Identifying the Twists & Turns In Energy
By Zac Mannes
Stock Waves follows energy stocks very closely and has for years. While the sector is closely tied to oil and largely ebbs and flows in unison with oil, there is a lot of room for nuance between individual names, and there are some fantastically juicy dividends in many. We even came close a few times to launching a dedicated service on energy much like our Metals, Mining & Agriculture service. Instead, we highlight the energy sector within our Stock Waves service, following XLE and XOP very closely along with dozens of names in our energy basket.
Let’s examine the chart history on energy, represented by the XLE chart, and our calls since its move off the lows in 2020.
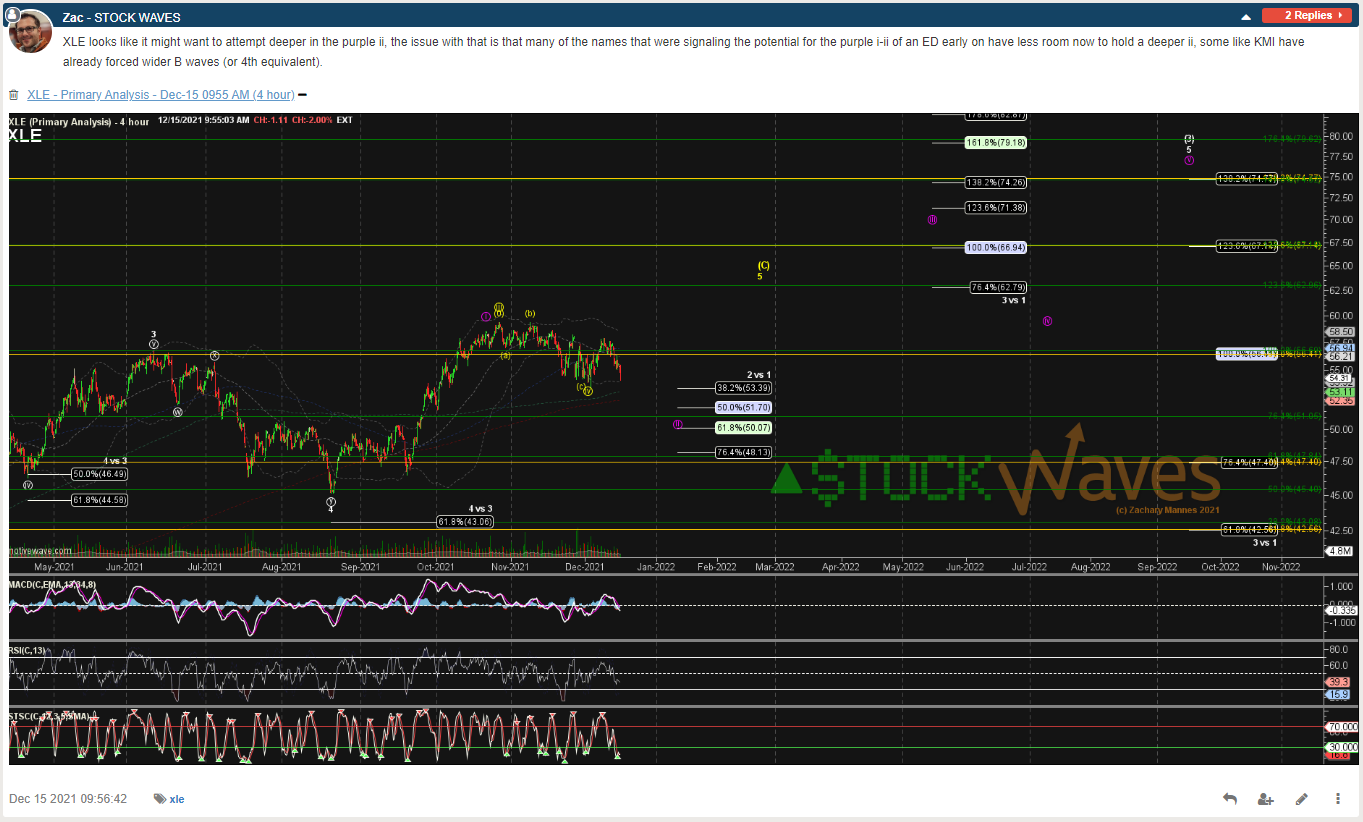
After following a bullish move in energy off the April and Oct 2020 lows and getting a consolidation into Aug 2021, we again became very bullish on energy names in late 2021 and early 2022. We posted many new Wave Setups as the charts on energy stocks were filling out a i-ii for the next swing higher, as outlined in the purple count on the XLE chart below.
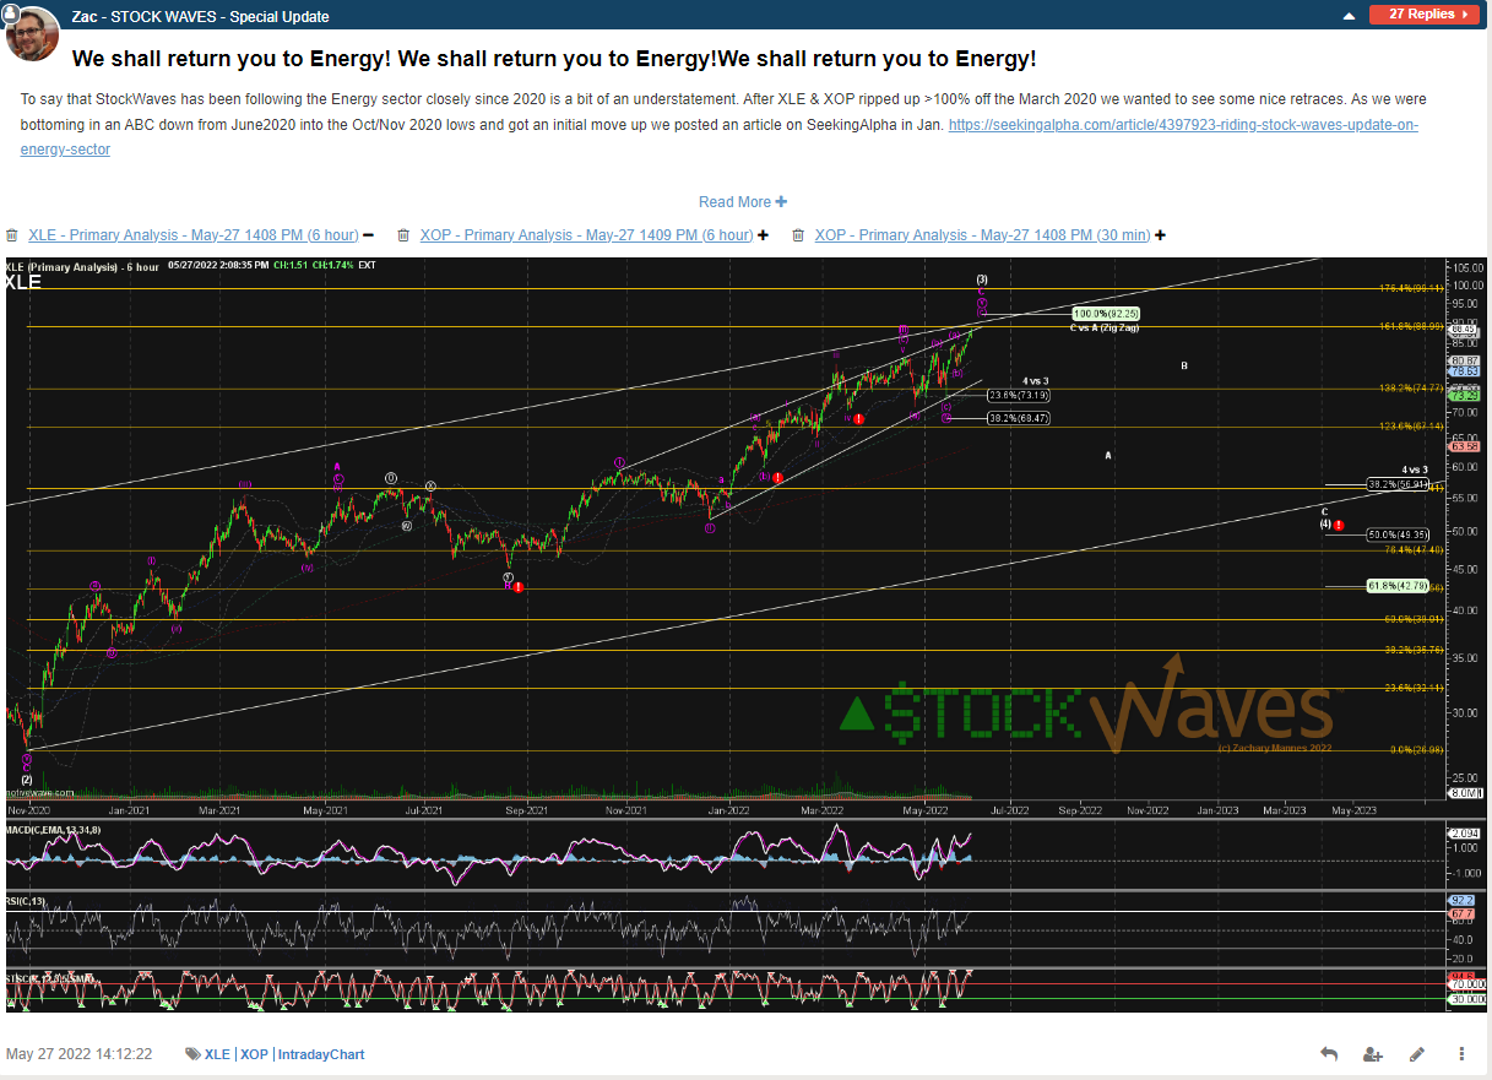
The sector followed that purple count closely in an ending diagonal structure up to a very extended top to that wave (3). However, as shown in the chart below, by May the upward pattern was looking very near complete and the risk of squeezing more out became less desirable for all but the most die-hard dividend collectors.
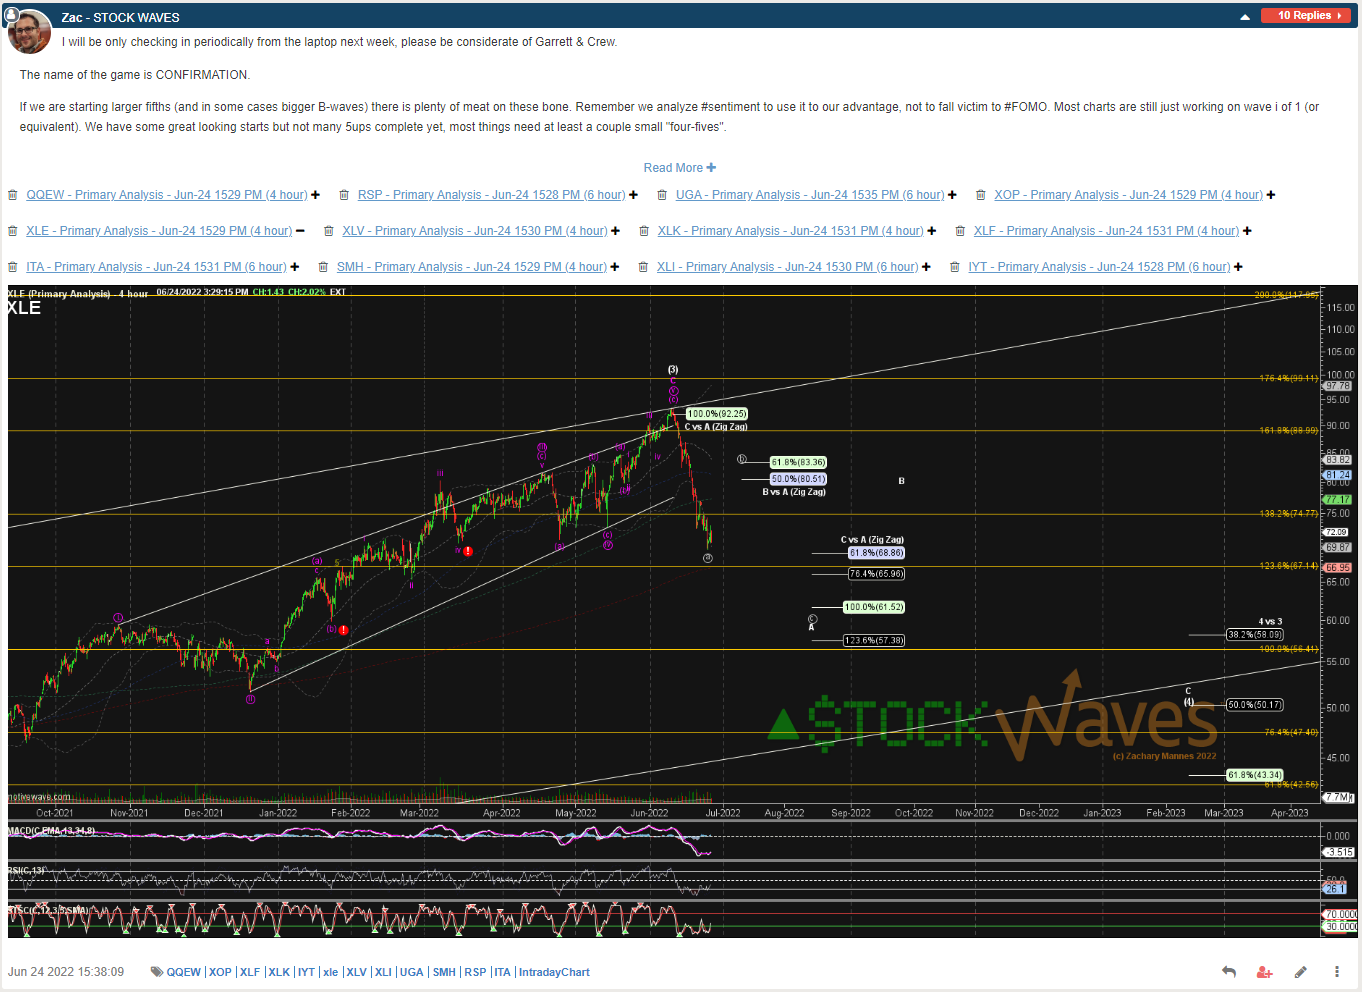
So, we published the following update at the end of May warning of the start of a larger (4)th wave correction, while also noting that these would once again be a great trade to the upside when that (4) was reliably complete.
In June 2022, XLE dropped nearly -25% (from June 8 to June 30), but we know in Elliott Wave that nothing moves in a straight line and the (4) should at least have an ABC in it. So, at the end of June, we called for a bounce in XLE toward the 83 area.
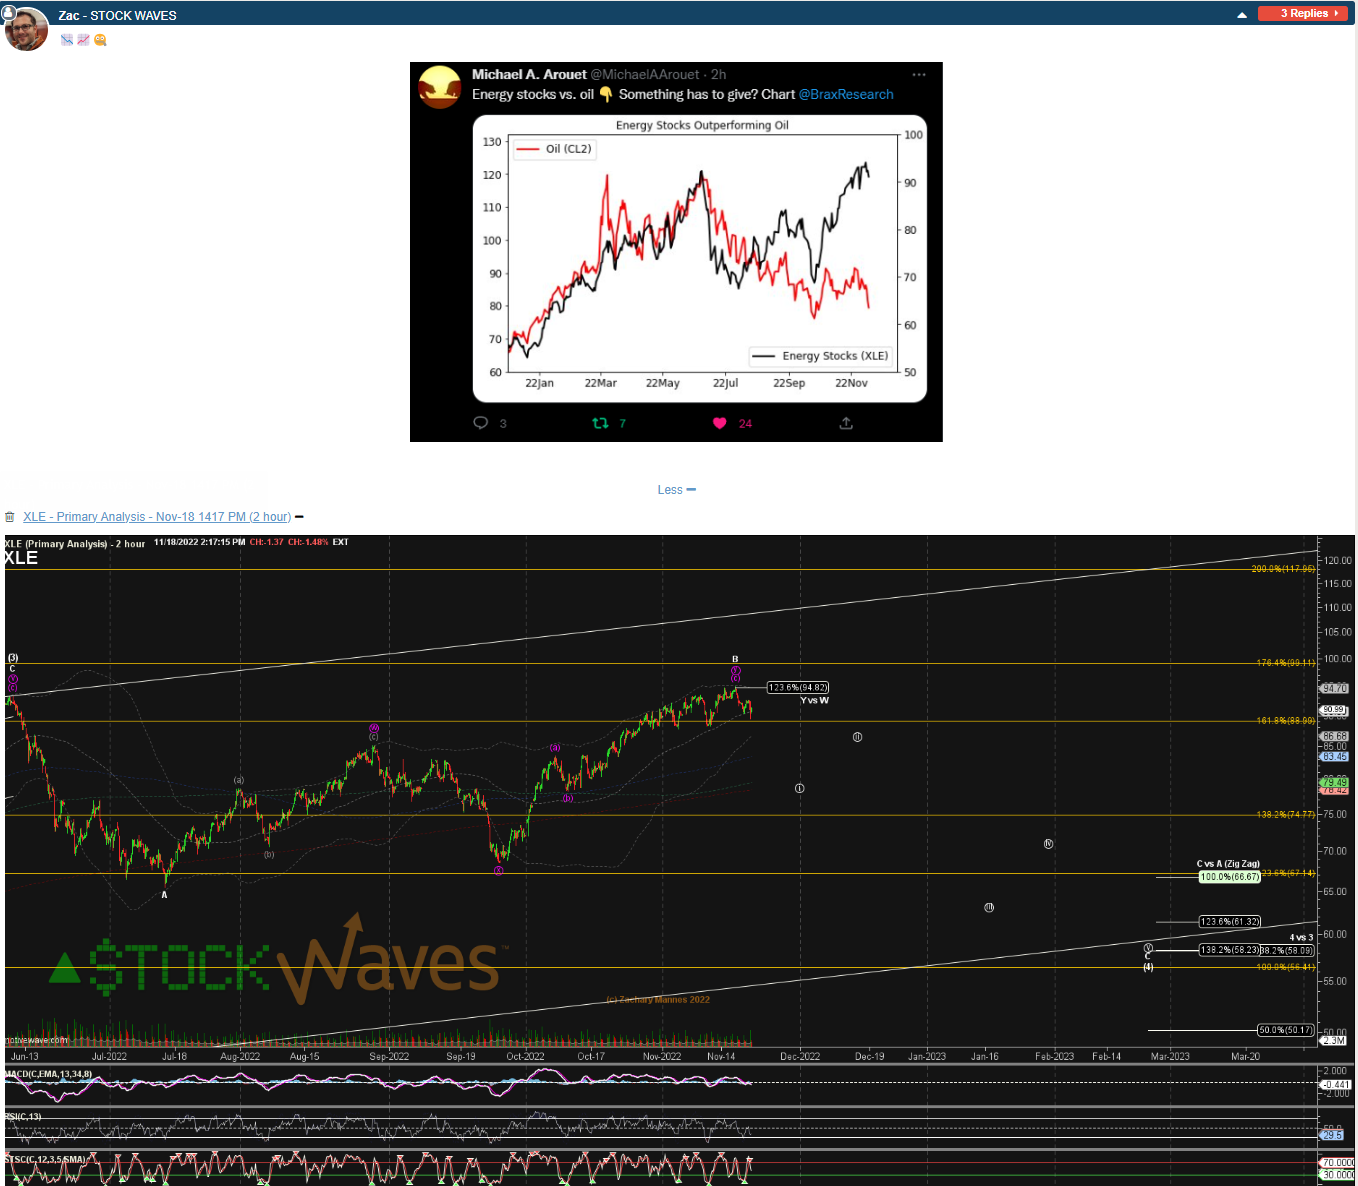
Into the end of August 2022 XLE had a perfect abc bounce to the 83 area before declining sharply again, by nearly -20%, into a low in September of that year. From there XLE got over resistance for any immediate setups to continue lower in a C-wave and filled out a much higher alt B. But into mid-November there was a growing disconnect between the “sticky” energy stocks and oil prices, which continued to “slip.” Something had to give.
We got a really good fade down -19% in XLE into May/June 2023, but could not quite get the final “One More Low” to reliably complete the C of (4) in a more traditional ABC flat.
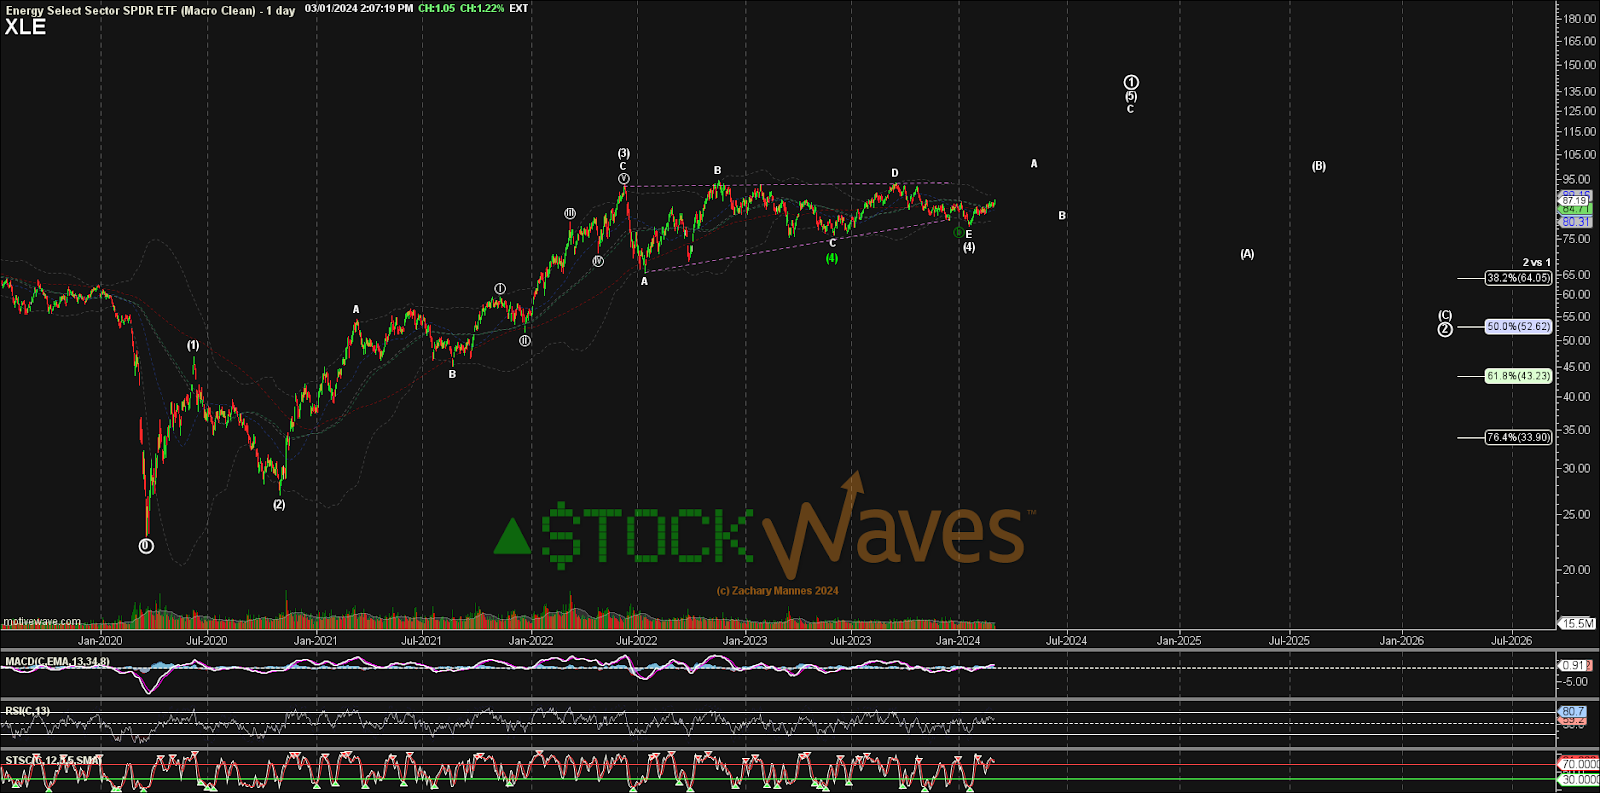
Into August 2023, though, while still valid as an alt iv of C, we introduced the potential for a triangle to be completing the (4), allowing for another fade as an E-wave.
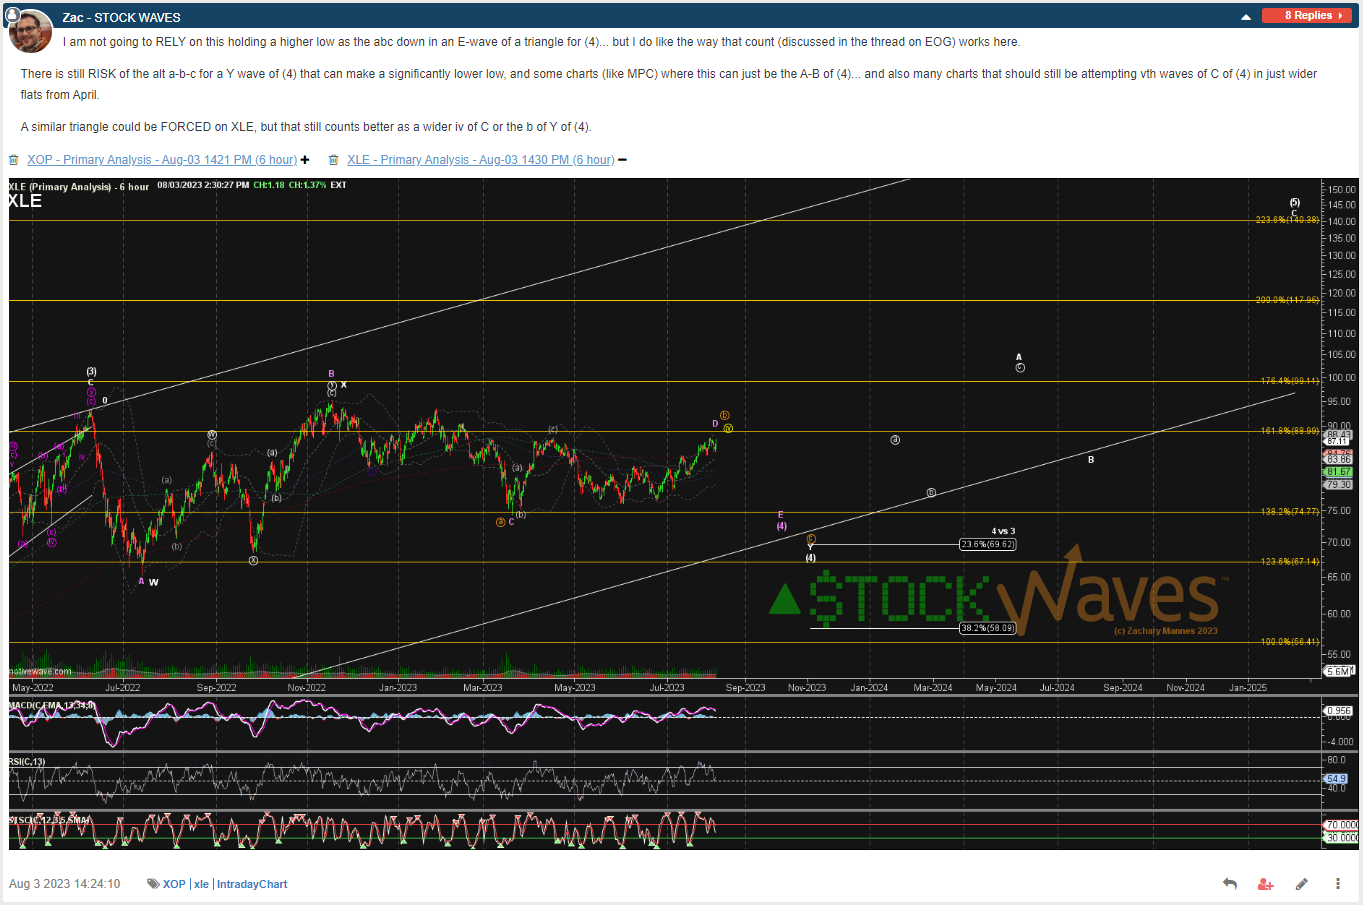
Some things did count well as being complete in wave (4) in their March or May 2023 lows, and we had added some 'early" Energy Wave Setups then, but into September even those looked like 5up for a start to the (5)th and in need of a corrective consolidation. Interestingly, whether they were a corrective fade of a start to (5) or the E-wave of a triangle, we knew that both should hold a higher low.
That fade as a retrace started to get deeper than ideal, but held exactly as expected for E on January 19, 2024.
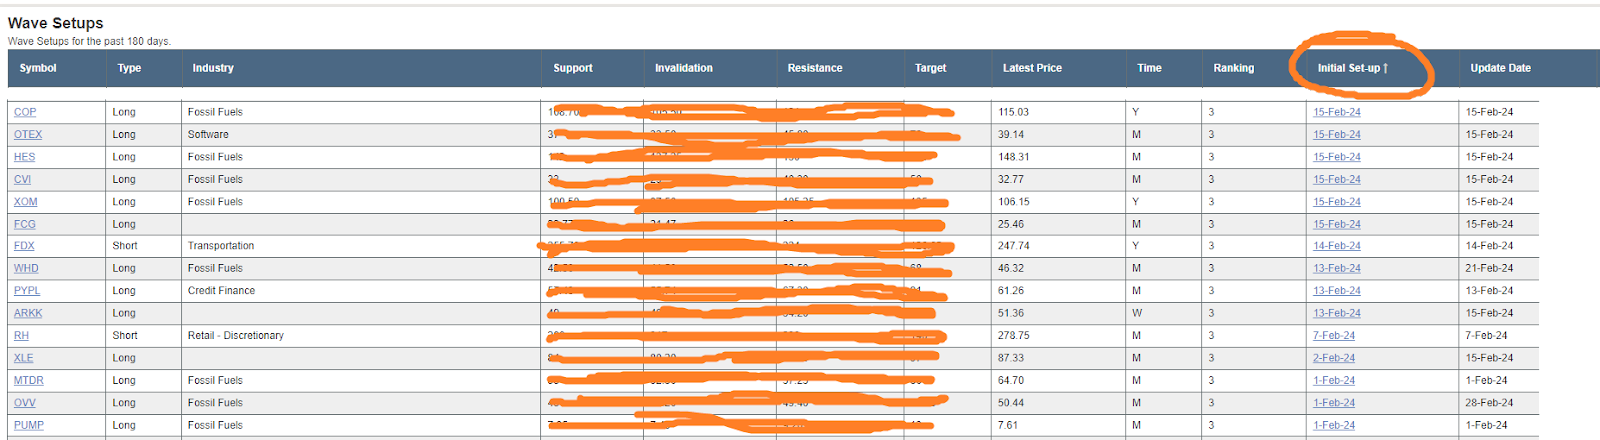
With a nice little move up and some micro consolidation, we got VERY bullish in energy names again and added several new Wave Setups. See table below.
Supporting our perspective, in December 2023, crude oil futures also held what I deemed a significant nominally higher low versus May. Since it was such a deep retrace, it represented a very good risk/reward opportunity in-and-of-itself.
On January 25, member Jenn wrote: “Zac, your QCL charts have been right on the money! Thanks and please keep posting!”
On February 28, member genoj added: “You’ve been all over the most hated oil rally in a LONG time!”