Ideally, Still Seeking A Lower Low In SPX
If you have been following the path we have been laying out for several weeks now, you would know that the market has been following along relatively well. But, within that path, it suggests that a 5th wave down should be seen before this [c] wave decline completes, at least in an ideal sense.
The question that the market is going to answer early in the coming week is if the wave 4 rally is done, and wave 5 has already begun, or if we still have one more push higher before wave 4 is done?
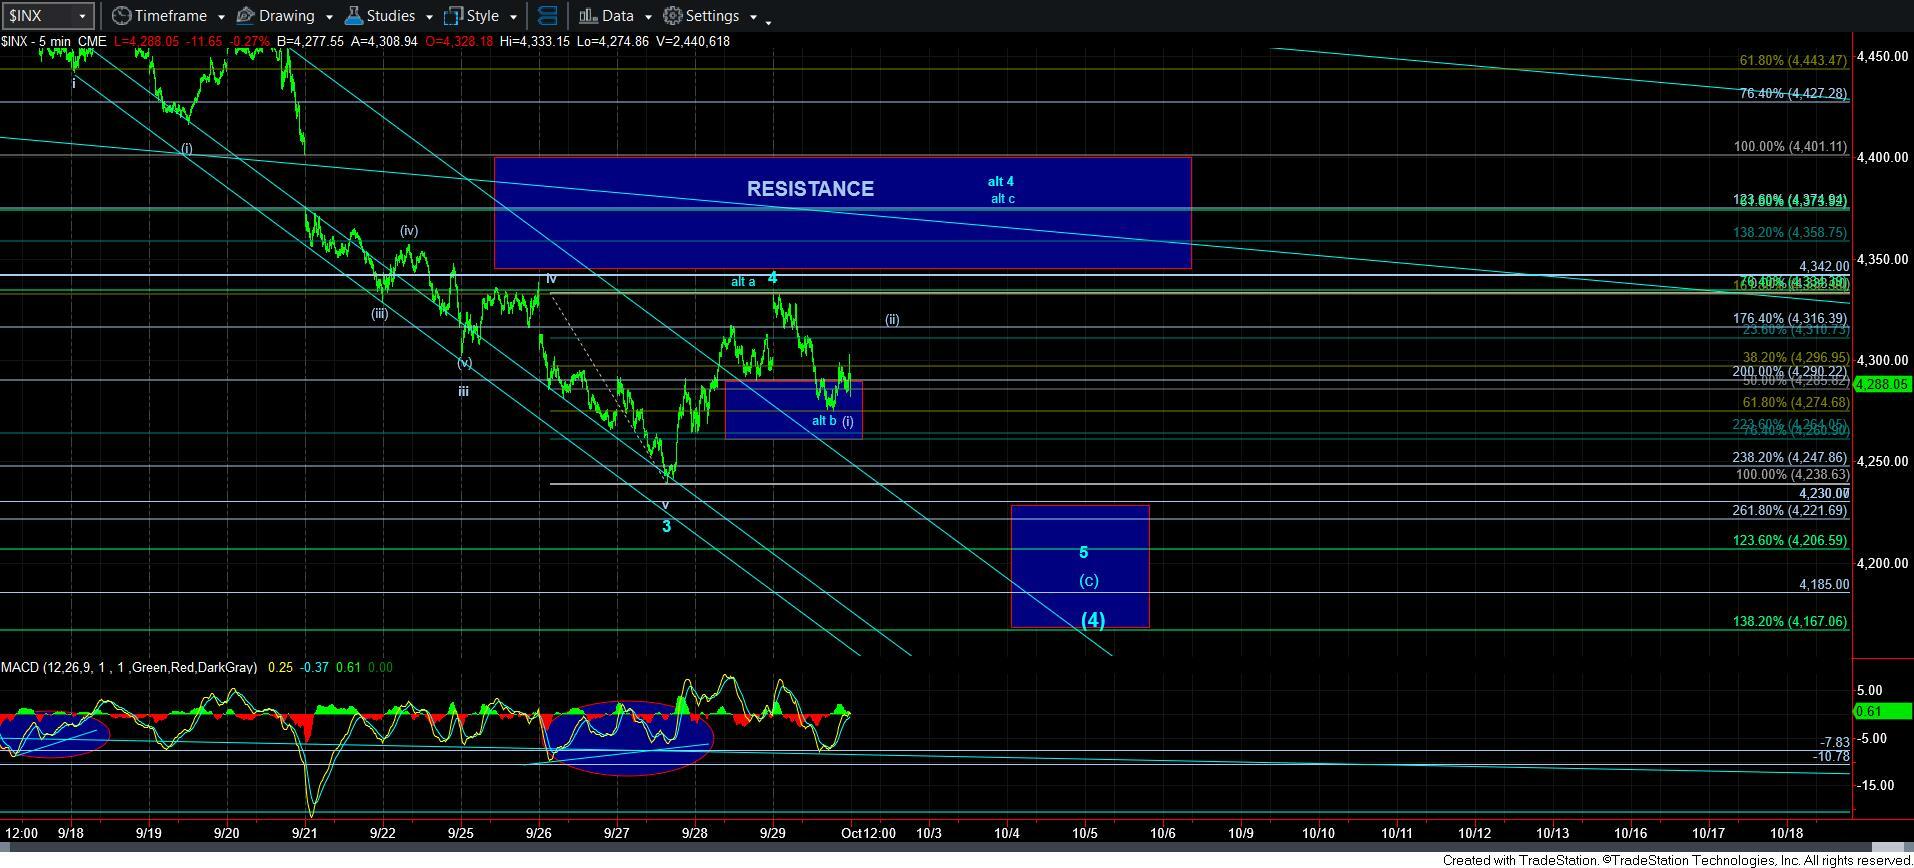
The rally that we completed on Friday morning came up a bit shy of the ideal target for wave 4, which is the .382 retracement of wave 3. That level is the 4342SPX region.
Not only did we come up shy of that target, but what would be considered the c-wave of that wave 4 did not even reach the .618 ratio of the a-wave. And, that is quite unusual. This had me initially considering that we could see one more rally back up towards the 4370/75SPX region. That represents the a=c target if the b-wave bottomed on Friday afternoon, as well as the 1.236 extension to the downside of the 1-2 downside structure.
As an aside, normally, the 4th wave retraces back to the 1.00 extension of waves 1-2 to the downside. In our case, that is the 4401SPX region. However, since the 3rd wave went beyond standard extensions, as I outlined the other day, then it is not likely that the 4th wave will travel back to the 1.00 extension. Therefore, the 1.236 extension becomes a reasonable alternative.
Of course, should the market begin to break down below Friday’s pullback low early in the coming week, then it likely means that wave 5 to the downside is already in progress.
As far as wave 5, assuming wave 4 is already in place, I have had to lower the potential target for wave 5 based upon the current downside micro-structure in place. Before we began this decline, I set our target for this [c] wave down to the 4230-4274SPX region as a standard target expectation. However, when wave 3 extended down into that support already, it forced me to adjust the support for this potential [c] wave. So, as you can see, I have the bottom of support at the 4167SPX region, which represents the lower end of support I have been outlining over these past several weeks.
Moreover, we often see equality between waves 1 and 5. And, since wave 1 was approximately 110 points, it gives us an ideal target for wave 5 at the 4220SPX region. But, should we see larger than standard extensions, as we have been seeing, then it could easily take us below that support.
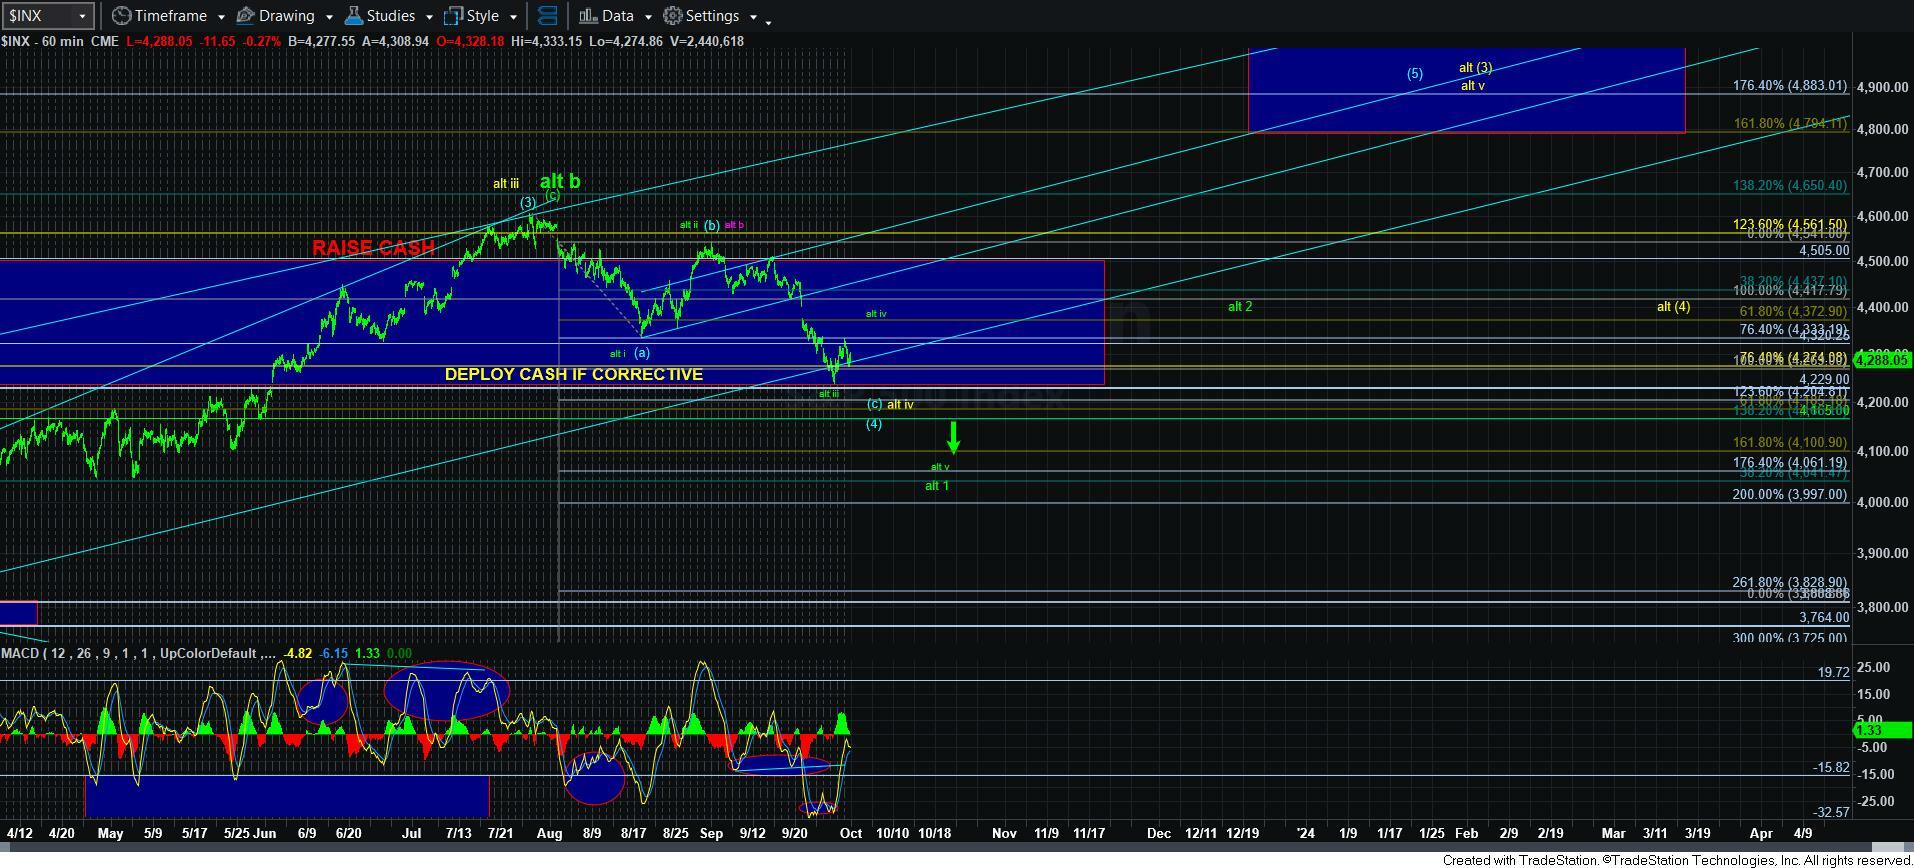
Therefore, as long as the market maintains over the lower end of our support region in the 4165SPX region, then I am maintaining my primary count that this is a [c] wave pullback, setting us up for a rally next to the 4800SPX region.
On the upper end, should the market be able to exceed our resistance which tops out at 4401SPX, that will likely be a strong indication that this downside has completed, and that the run to 4800SPX has begun. But, for now, I am still expecting one more decline before that is seen. Yet, I still need to outline where we must give up the expectation for the lower low to be seen.
In summary, Friday’s pullback low of 4274SPX is the near-term support we have to be watching carefully. A break of that low points us down in wave 5 towards the blue box on the 5-minute chart. As long as the next 5-wave structure for wave 5 completes within that box, that will likely be a buying opportunity for those who want to trade the move in the SPX to 4800SPX.
Our initial resistance is clearly Friday’s high, followed by 4370/75SPX, and then followed by 4401SPX. As long as we remain below 4370/75, I am still confidently looking down. However, should the market be able to exceed 4401SPX before striking a lower low, then we have a strong signal that the low is in place, and we likely have begun the rally to 4800SPX.
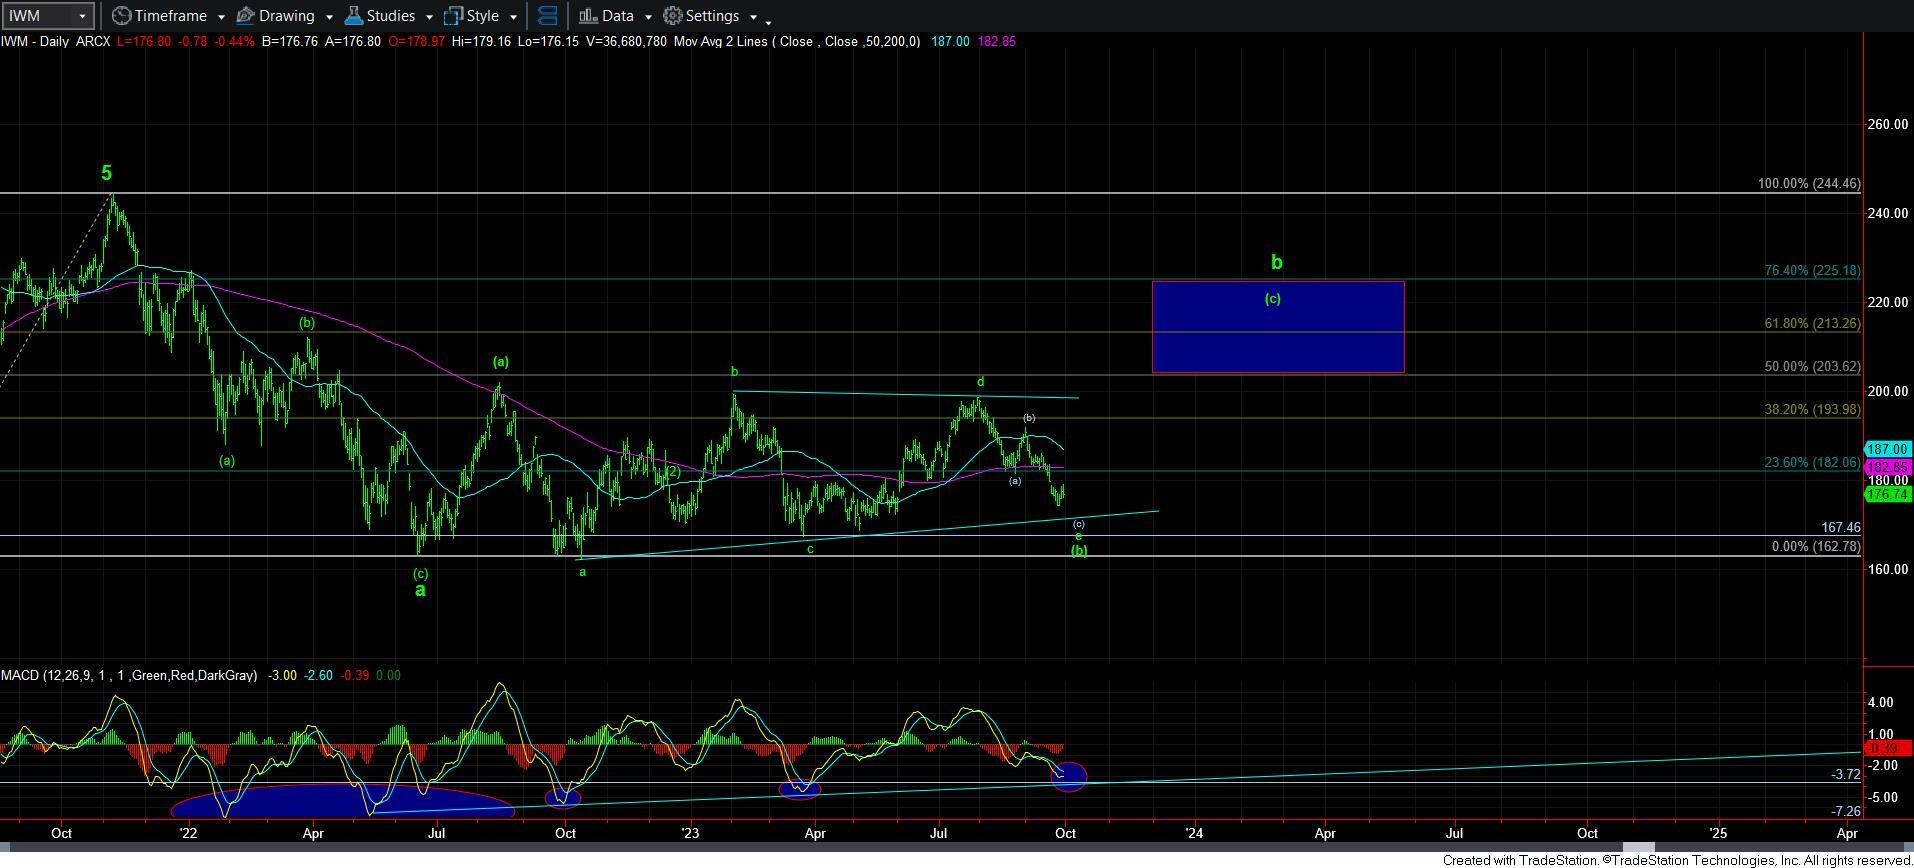
Lastly, I want to add a bonus perspective on the IWM, which I highlighted in the room this past week. I have included a daily chart of the IWM to outline my view. Whereas before we were viewing the IWM as completing a b-wave triangle and then pointing us to much lower lows relative to the one struck in October of 2022, I am now changing the focus of this triangle to a potential [b] wave triangle within a larger b-wave, which would then be pointing us higher in a [c] wave rally to complete the larger b-wave, as you can see from the chart.
When you review the chart, you will see that we are likely in the [c] wave of the e-wave of that [b] wave triangle. Ideally, there is still a 5th wave lower low to be seen in the coming week or two before the [c] wave of the e-wave completes, assuming we do not see a move through the 181/182 immediate resistance first. I believe that a lower low that holds the 170/172 region could be a good buying opportunity for those looking for a long position for a potential rally in the coming months.
What this chart offers is not only a low-risk entry point, but it also suggests that the IWM may outperform the SPX on the next rally attempt.
Therefore, should we see that lower low in the coming week or two, you can choose to enter your positions, and set stops below the level of the c-wave of the triangle, which is 167.46. Again, this gives you a relatively low-risk long attempt, as your stop out potential is approximately 2-3%, which is not a lot of risk to take for what could be a 15%+ potential move higher, as there is potential for the IWM to rally as high as the 213-225 region. Once waves 1-2 of the [c] wave are in place, we can better identify the target for that rally.
Taken together, I think both the SPX and IWM still suggest that we have one more rally to come in the coming months. But, clearly, if we see a break-down below the levels of support noted for both these charts, it would open up a potentially large downside move over the coming year in the equity markets. So, we have very strict parameters for looking to the long-side in the near term.