
IREN: Graded on CoreWeave’s Curve
 By
Levi
In October the market graded the whole neocloud class, and CoreWeave’s paper set the curve. The fear started in CoreWeave’s bonds, spread to its stock, then reached companies that don’t have its debt. Over the month to October 22, IREN Limited (IREN) fell close to 46%, deeper than CoreWeave’s 35%.
This seems to be more of a sector sell-off, a carry-over contagion effect. The baby went out with the bath water.
The setup for a move to as low as the $20 to $22 area was already there. That’s the larger .382 retracement support from the prior rally, and it was the alternate scenario should upper support give way, which it did. So was IREN graded on its own paper? It doesn’t appear so. It’s plausible a pivotal low is already in place at $23.72, but price needs to clear resistance to better confirm. The crowd will hand in its answer soon.
Who Sets the Curve
Plenty of voices weighed in. On October 14, Gartner, the technology research firm, forecast that more than 80% of neocloud providers will cease independent operations by 2030. In June, the same firm had neoclouds capturing a fifth of the AI cloud market by 2030. On SpaceX’s October 20 earnings call, Elon Musk said hyperscalers were hounding the company for compute. Within a week, he said more than 200 neoclouds face “guppy-level death,” and the neocloud group fell at Monday’s open as sentiment again soured.
Forecasters, whether they like it or not, are still part of the crowd. And it’s always the structure of price, no matter who’s talking.
Debt was in the conversation from the start. Bonds are highly sensitive to any risk-off environment, and the contagion continued from CoreWeave’s credit into the stocks. On October 21, IREN announced a new campus in Spain and rose about as much as bitcoin miners with no news of their own. Sentiment set the grade that day, not the news.
We do look at sectors, but each chart has its own voice. Likely not all of the neoclouds bottom in sync. Some won’t survive in their current form or model. It’s a thinning of the herd.
The Student’s Own Paper
IREN’s co-CEO, Daniel Roberts, pushed back publicly, saying customer demand still outruns what the company can build. Management has all the available information, yet they too are affected by sentiment. They must shore up, defend, protect. Ultimately, the crowd casts its vote by what shows up on the chart, and that is what decides the outcome.
The risks are real. IREN’s newest convertible notes don’t convert until the stock trades far above here. The capex runs alongside funding from the bigger players, and the company is well capitalized. But if the entire sector sinks, overriding sentiment is powerful.
IREN Has Sat This Exam Before
In November 2022, Iris Energy defaulted on loans tied to some of its bitcoin miners, and by December the stock had bottomed at $1.02. From that low to the November 2025 top, it rose roughly 75-fold.
The miners pivoted with the group. It was either that or wither into nonexistence. Not every company that pivoted will survive, but the cream will rise.
The all-time closing high of $76.41 came on November 5, 2025, two days after IREN announced its Microsoft contract. That’s typical of the sentiment curve. News is usually at its best near or at tops.
What the Chart Says
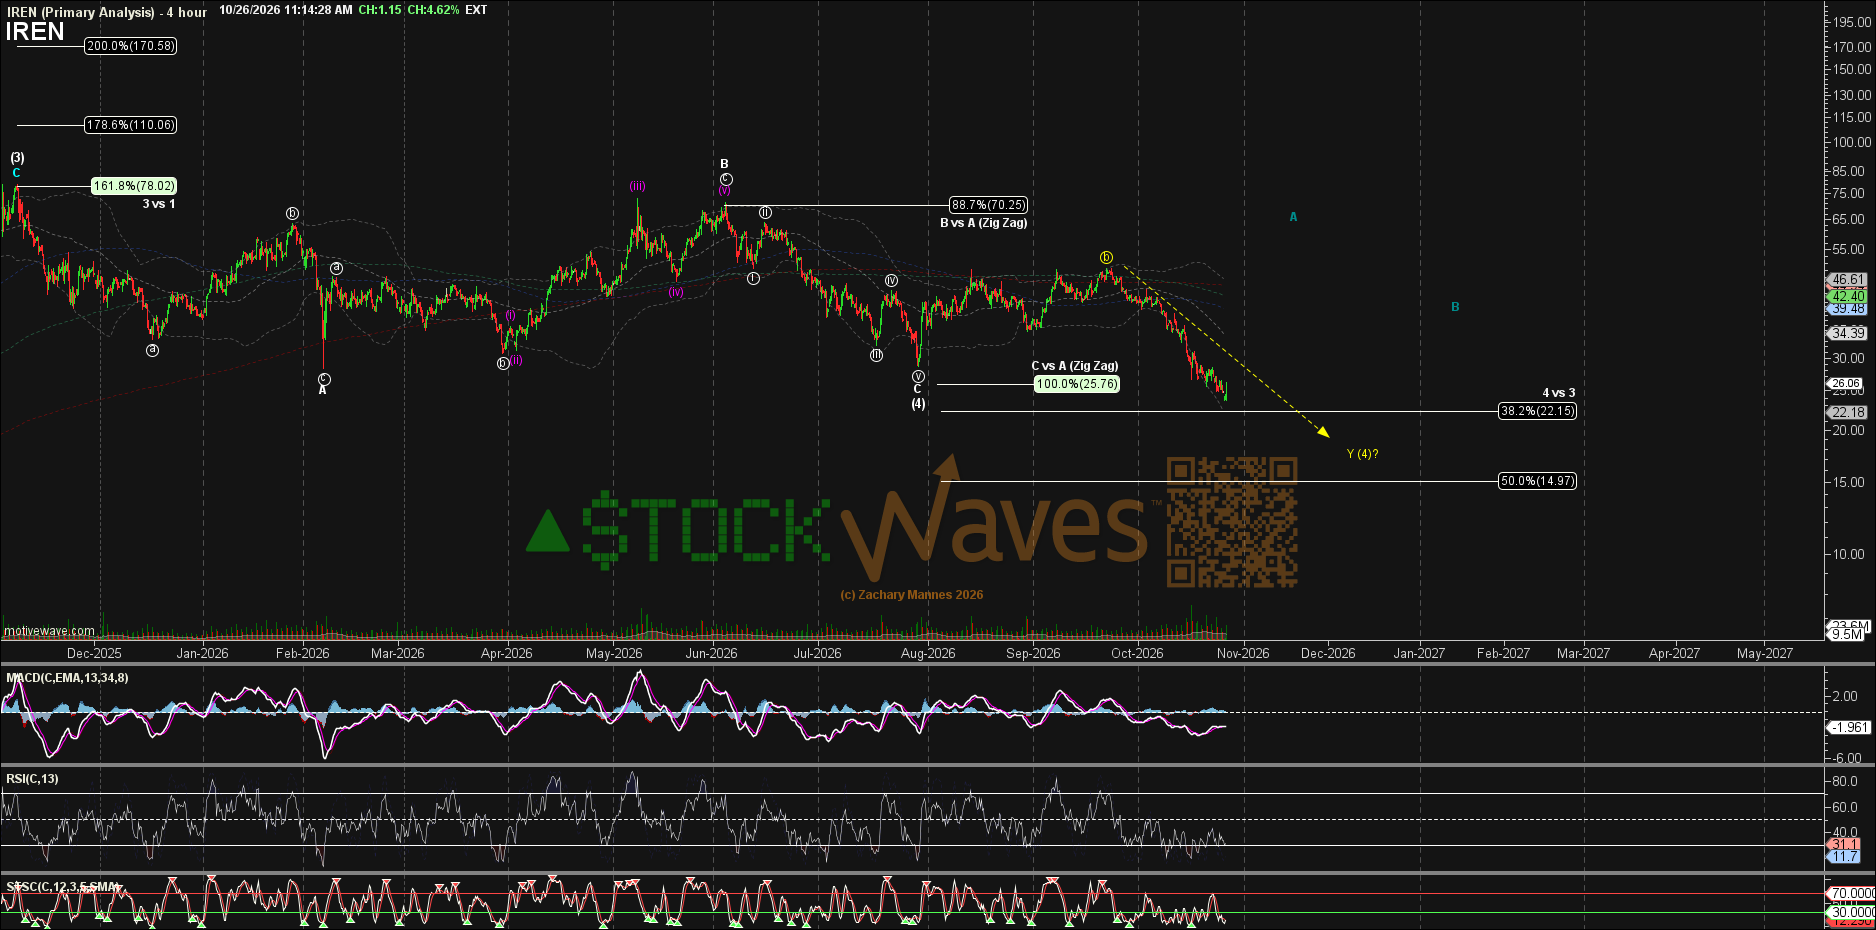
The chart above is Zac Mannes’ four-hour view of IREN, covering the year since the November 2025 high. He is showing an intermediate fourth wave in progress, meaning a fifth wave higher should be in the offing. True, price is a far cry from the all-time high.
Stated in plain words, this has been a massive sentiment reset.
Key resistance now sits at $28.50 and then $31.50. There’s no clear setup until resistance is cleared. After that, if seen, pullbacks become buying opportunities. For someone willing to assume current risk, a long here is a potential option as well, with the understanding that the last low is key to hold and that resistance yet remains.
The alternate is that $23.72 gives way and price continues under the $20 to $22 area. That opens up to as low as the $17.50 area.
If support holds and we see a clear setup, it’s one to consider, with specific parameters and invalidation in mind before clicking send on the buy order. Risks remain elevated here as they do at the major turns.
IREN reports its fiscal first quarter on November 5, a year to the day after that top. The crowd is always grading. But the crowd is also usually wrong at the turns. It was most certain IREN was finished at $1.02. We stick to the structure of price on the chart.
