IBKR: Who Holds Your Portfolio?
By Levi at Elliott Wave Trader; Produced with Avi Gilburt
More and more this question will likely become quite relevant. Who is the custodian of your hard-earned capital and investments? Fundamentals plus crowd behavior as displayed on the stock charts can give us an early indicator of just how well a company is performing.
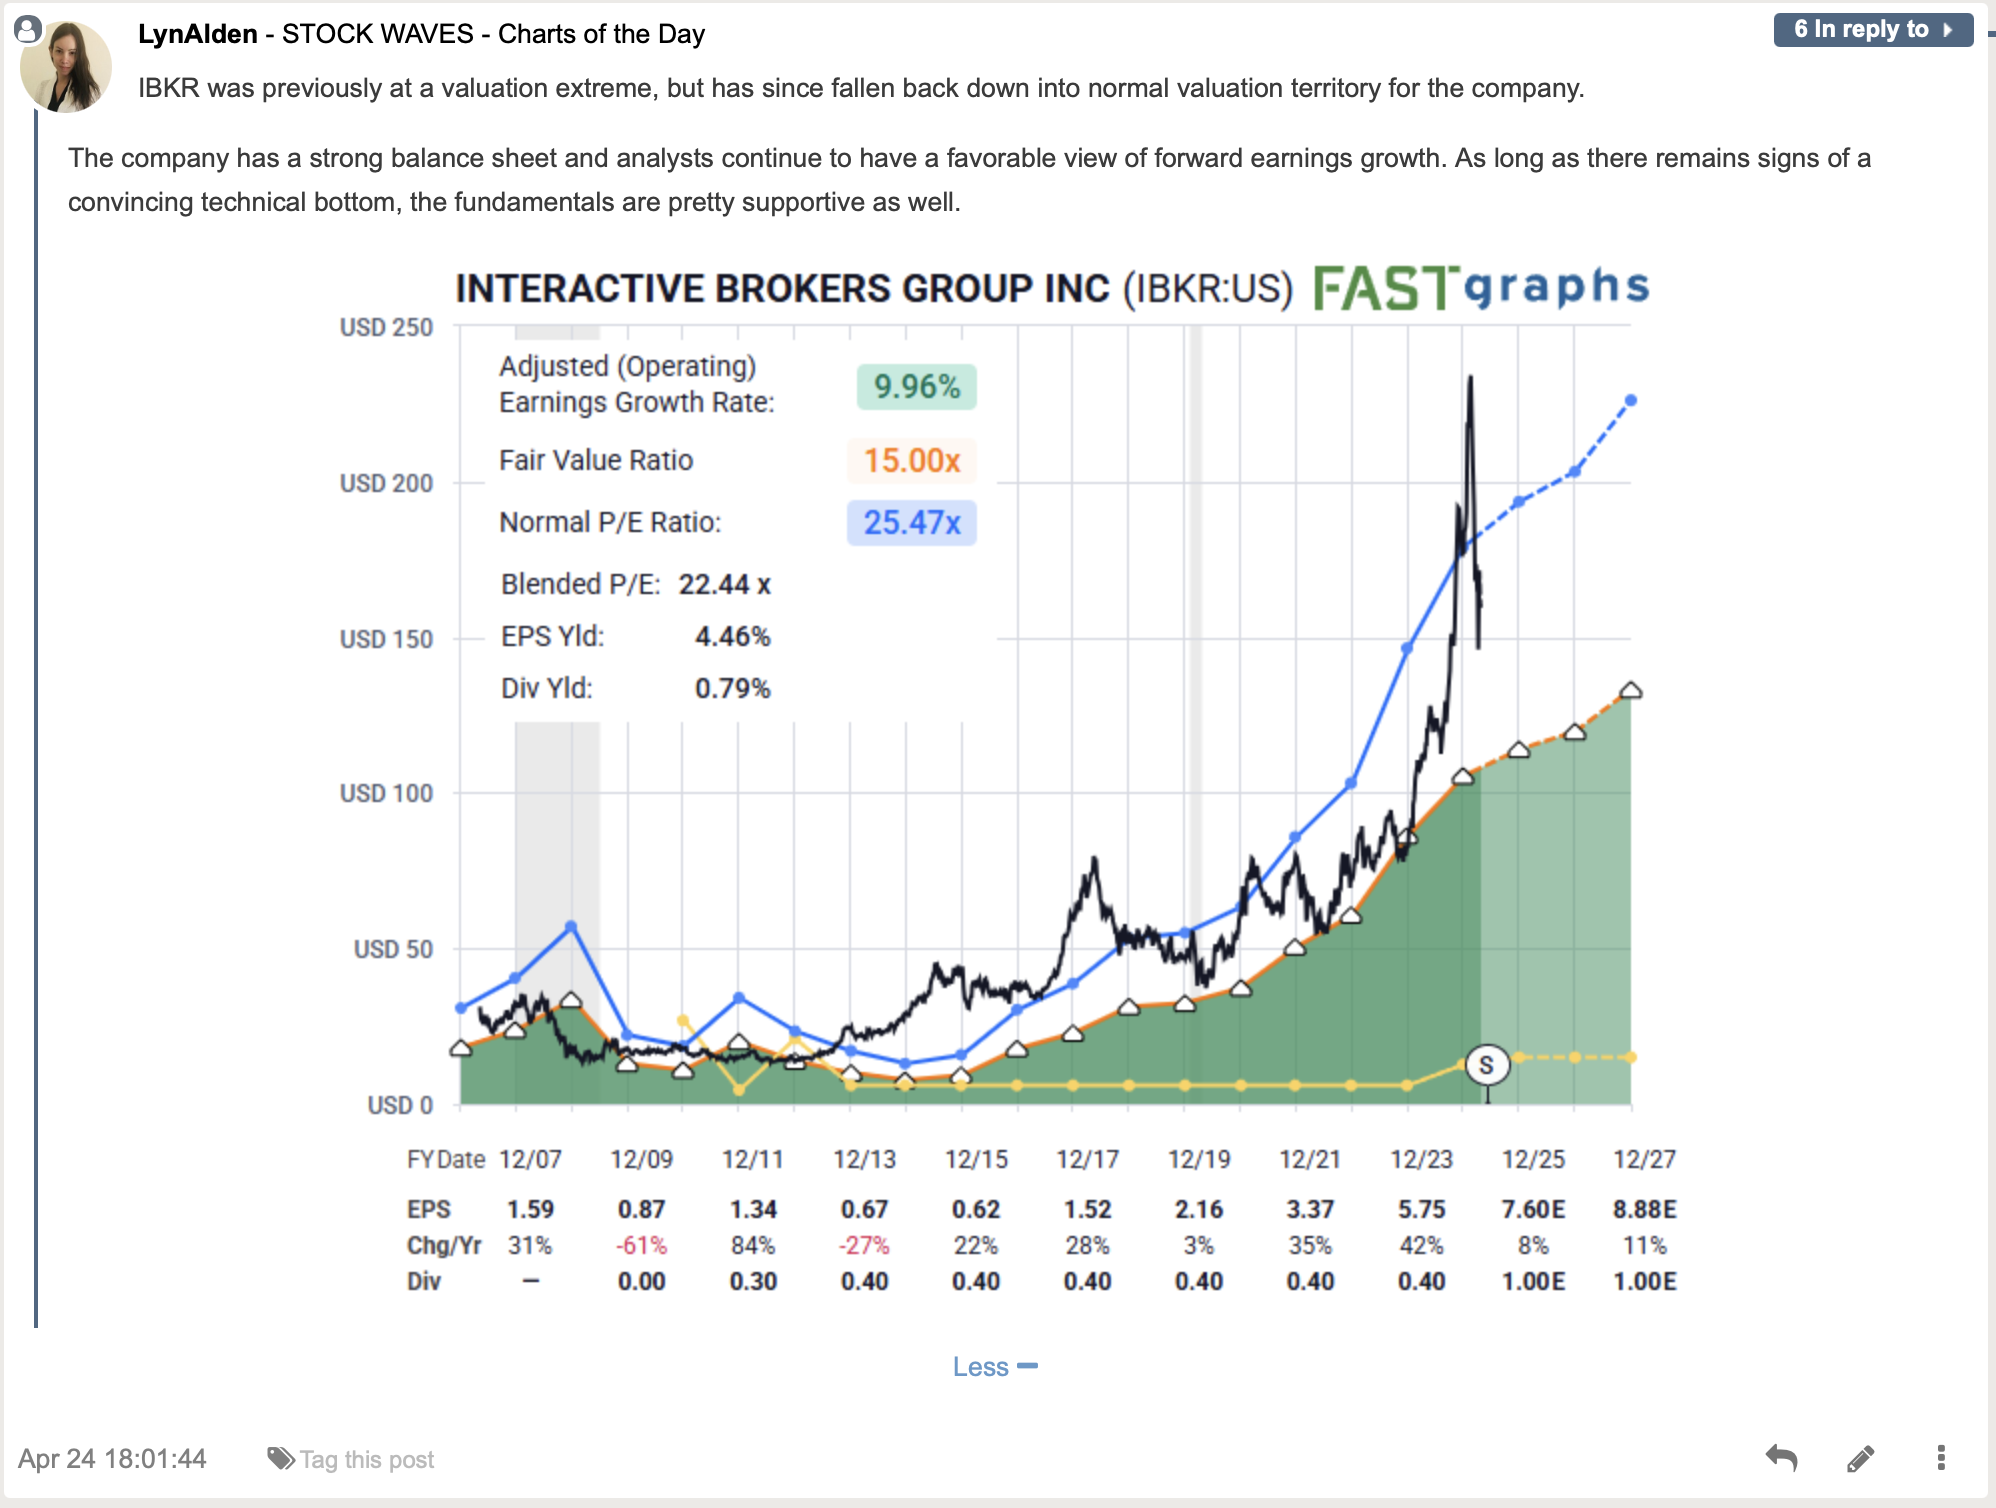
For (IBKR) we have a bullish bias based on the current snapshot as provided by Lyn Alden and the study of sentiment with Zac Mannes and Garrett Patten.
First Lyn's take, and then let’s examine one of the more powerful utilities that Elliott Wave, when properly applied, gives the user.
The Current Fundamental Snapshot With Lyn Alden
How can we find the synergy between the fundamentals and what the structure of price is telling us? Note this next key point.
This Methodology Provides Context
What do we mean by context? The literal definition is something like this:
“The surroundings, circumstances, environment, background or settings that determine, specify, or clarify the meaning of an event or other occurrence.”
Now, let’s take that and color in the literal lines to give this a bit more understanding when it comes to the markets. Elliott Wave is based on the fact that markets are fractal in nature. These structures are self-similar at all degrees. This means that the smaller structure should agree with the larger structure and vice versa. In fact, this is a way that a technician can ‘check’ their own work by making sure the subwaves agree with the larger context.
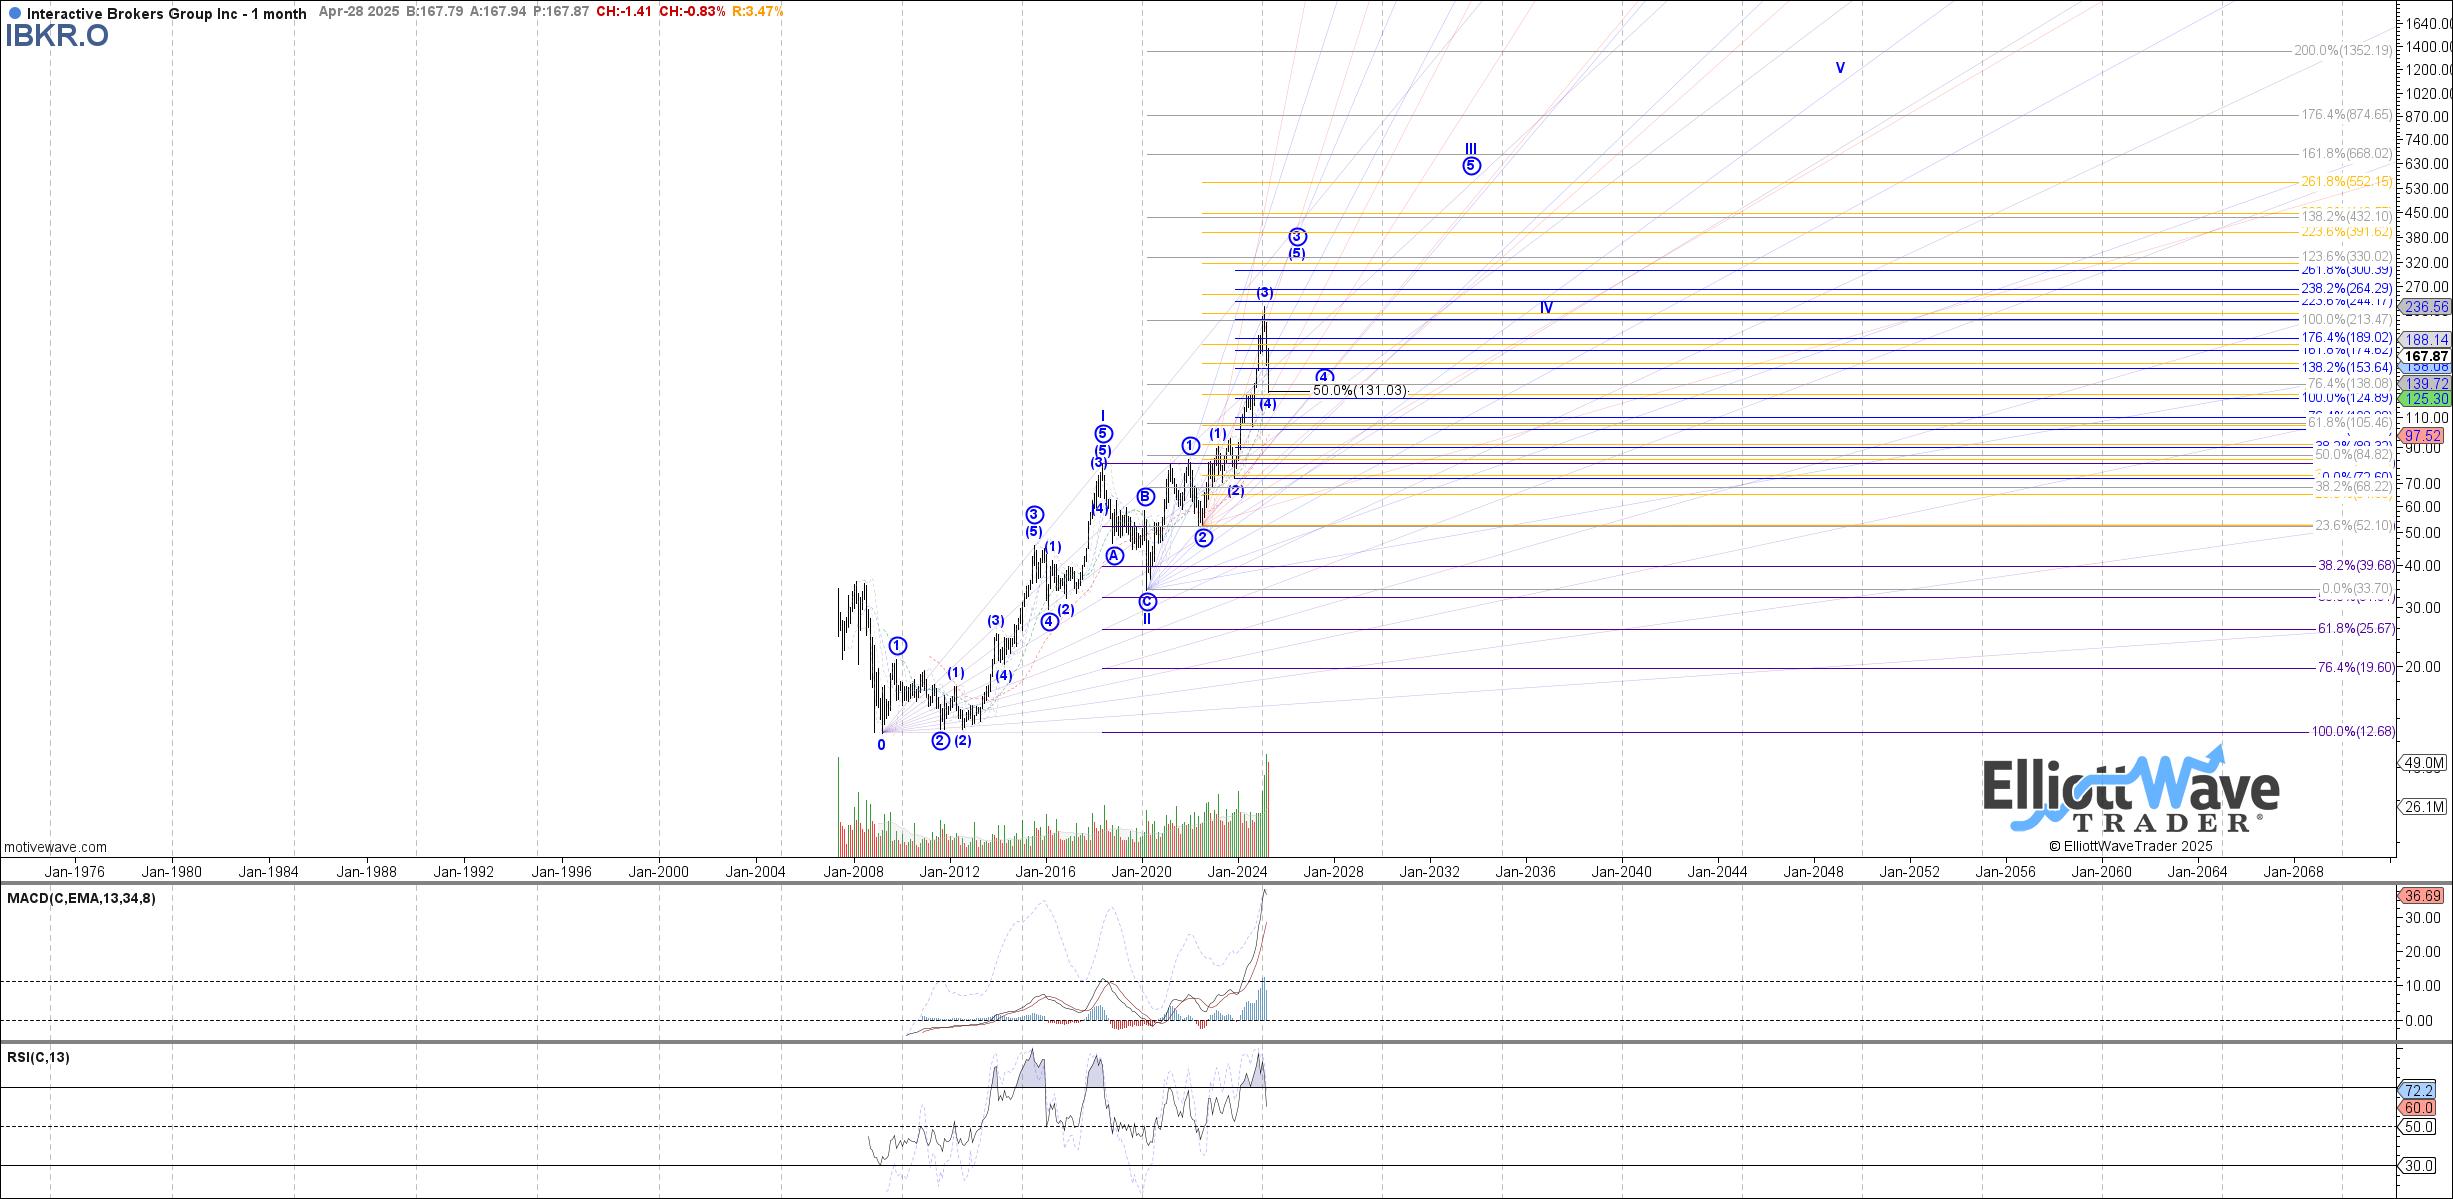
Garrett provides us with a perfect picture to illustrate the concept. Note the monthly interval chart below for (IBKR):
What can we glean from this structure since the low back in 2009? Keep in mind that the larger waves of the rally will subdivide into smaller, similar shaped waves. Garrett is showing the likelihood of one big five wave rally that would culminate some years into the future. This is exactly the power of identifying the context of the moment. What the environment is in which we find ourselves at any given time along the chart.
We might compare this to the seasons of the year. In areas of the planet that experience four distinct types of climate every three months or so, one can actually sketch out general plans during those time periods. We know what type of weather patterns to anticipate during each of these times. It is quite similar with the markets. When the structure of price has identified a trend, whether this be up or down, then we can then point out likely turning points based on standards that work much more often than not.
Let’s Zoom In For Some Actionable Intel
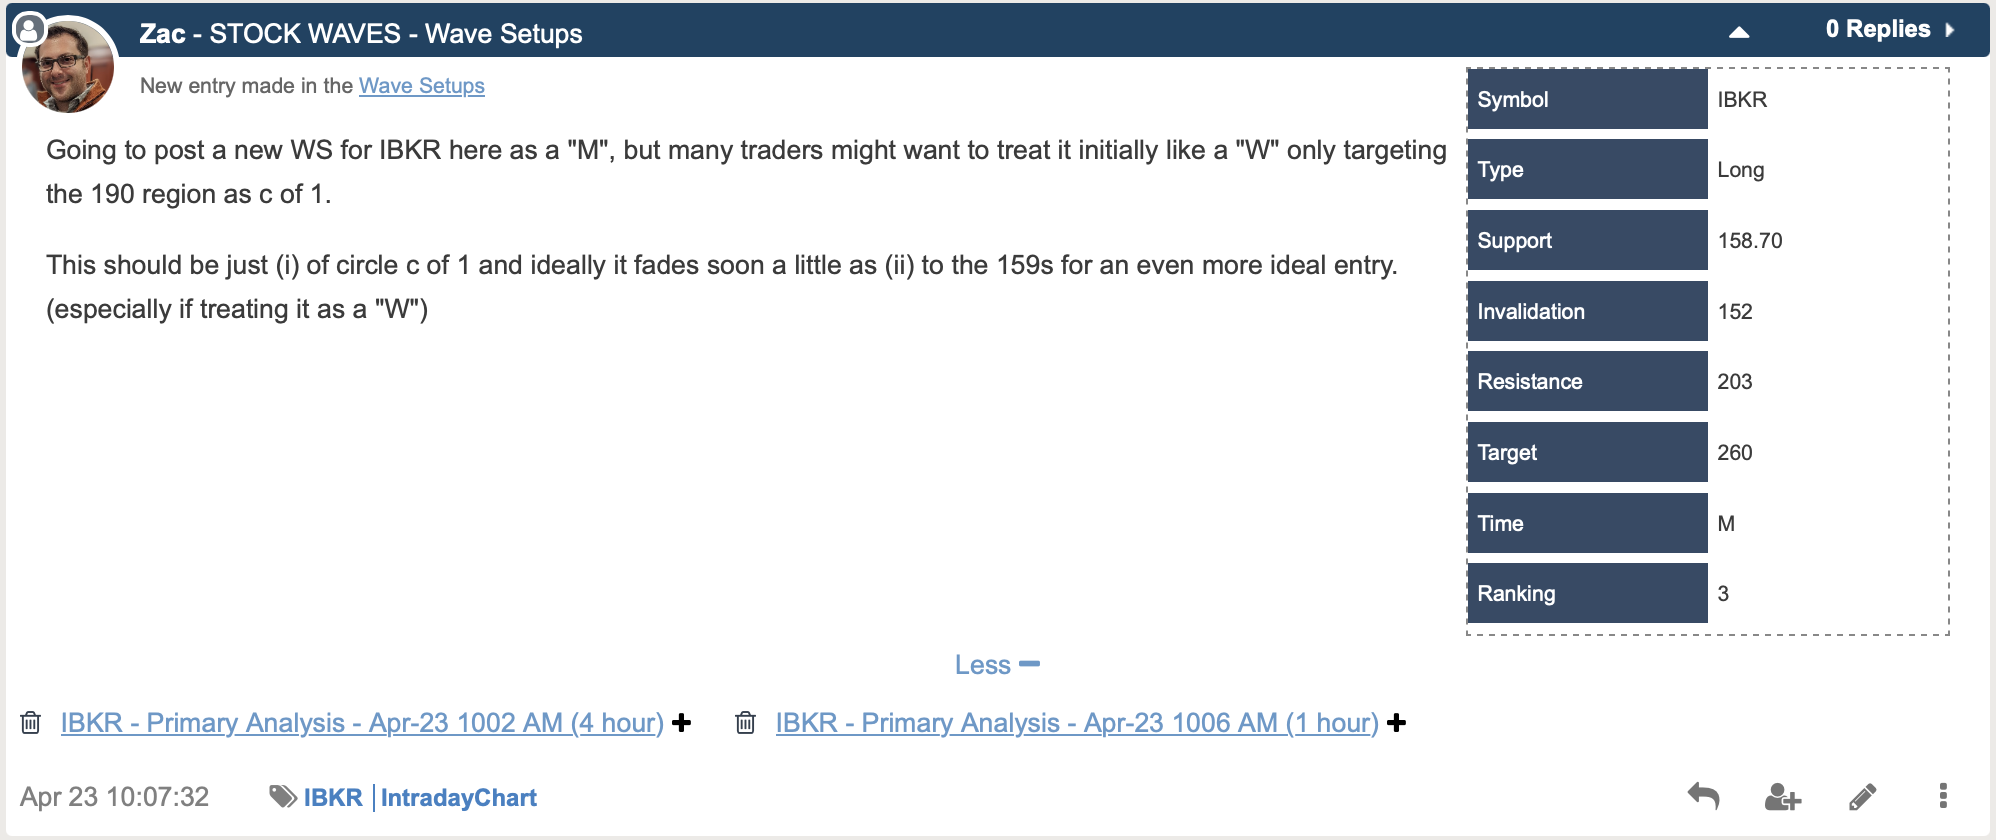
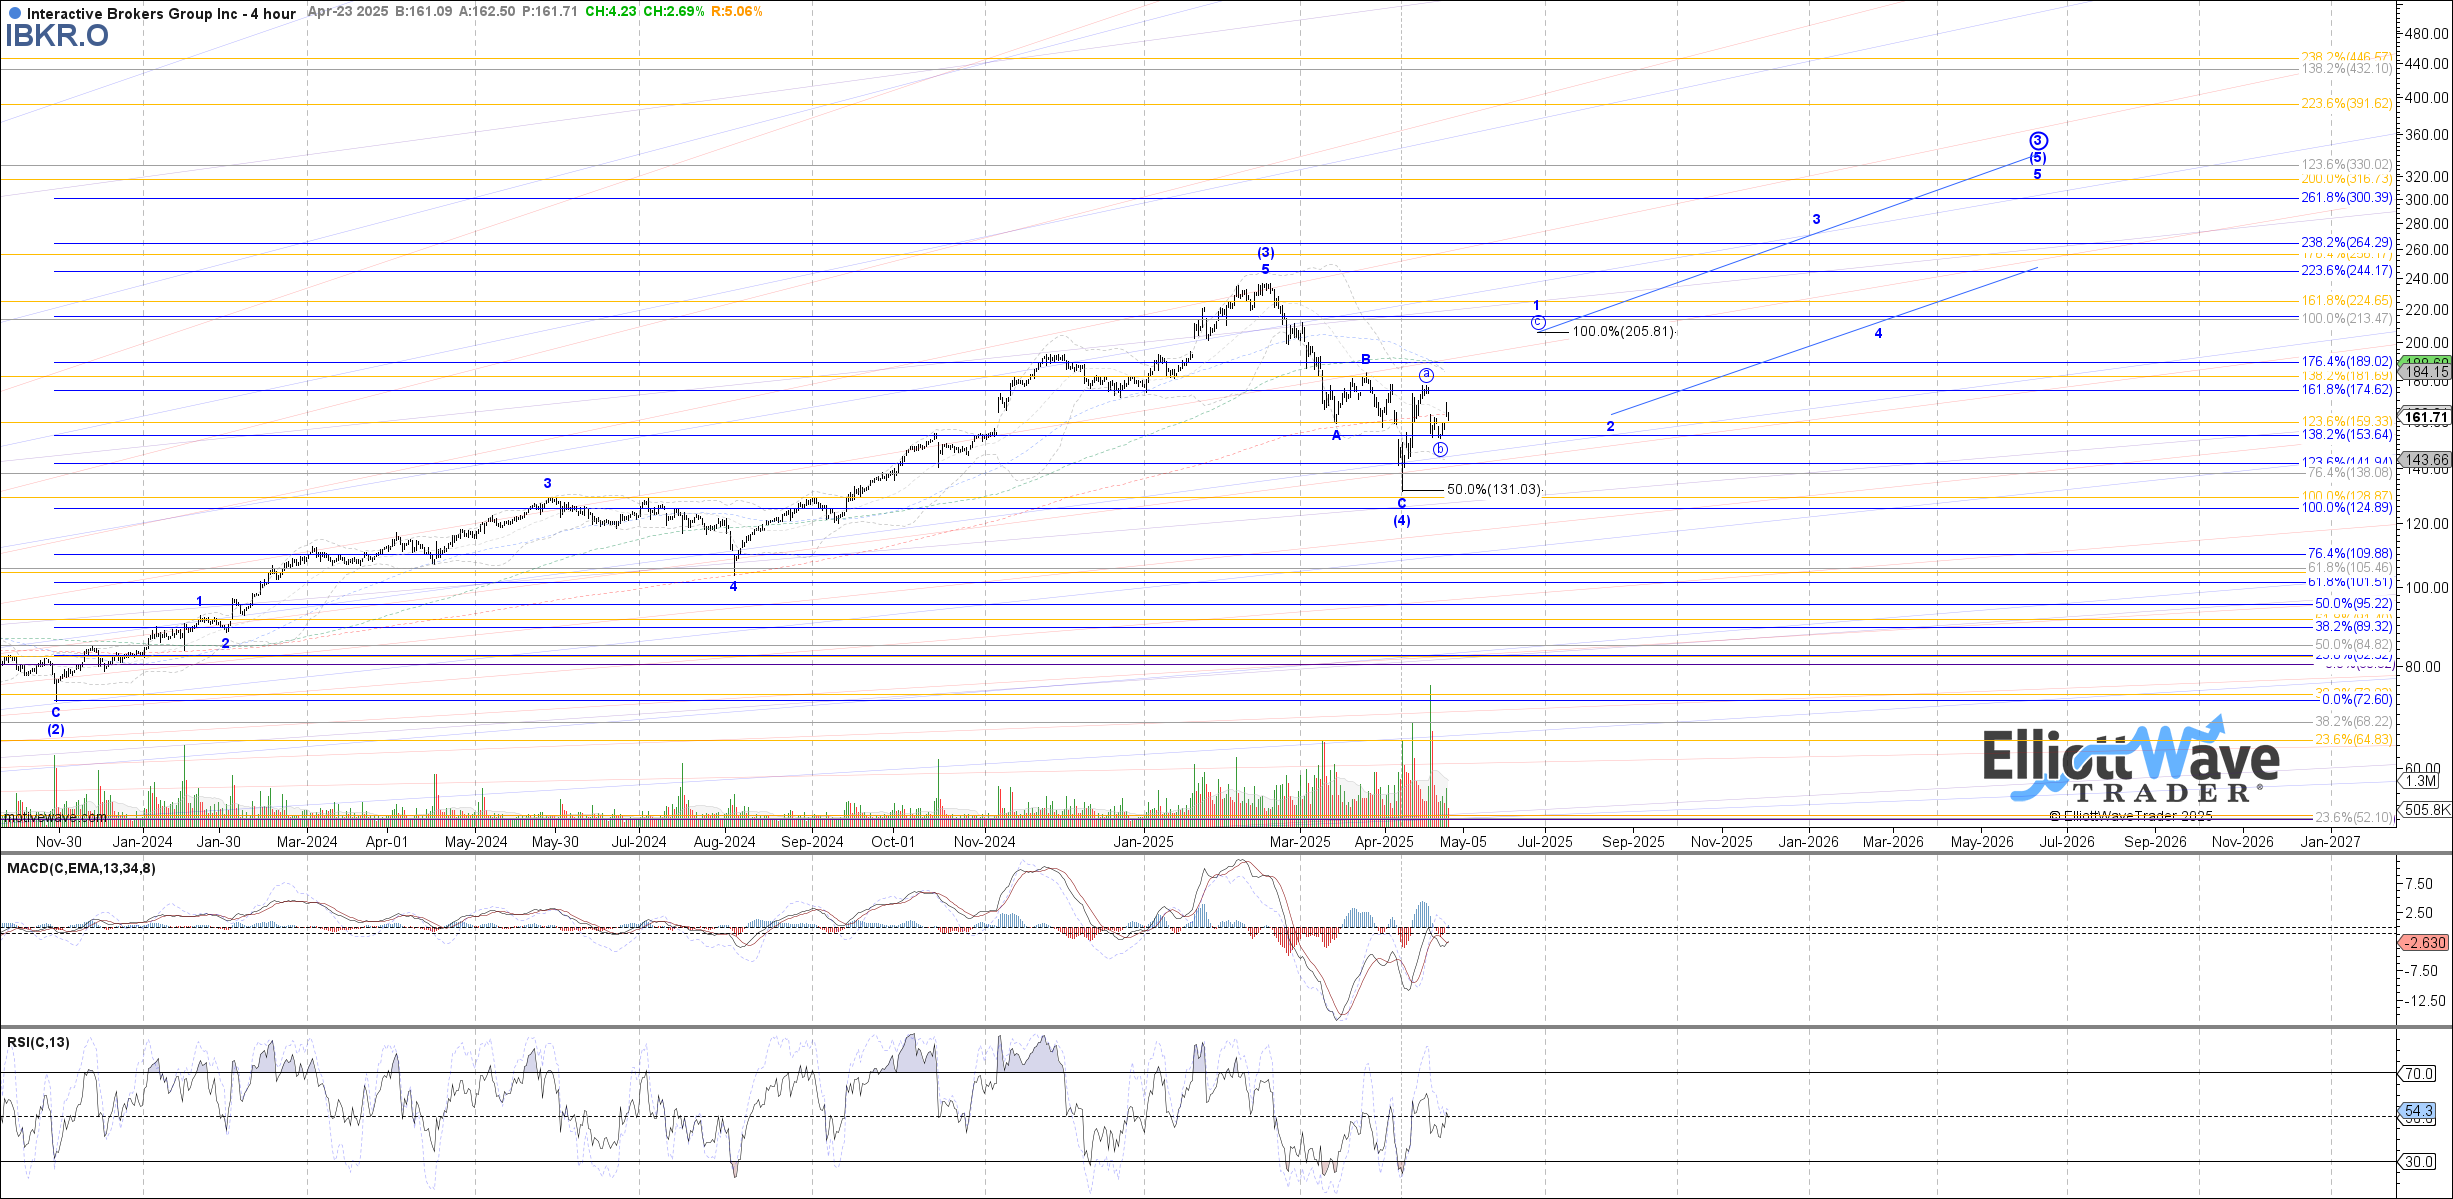
When we take a more near term view of the chart it reveals some key levels to provide us with guidance. In fact, a Wave Setup was recently shared with StockWaves members showing those levels to watch.
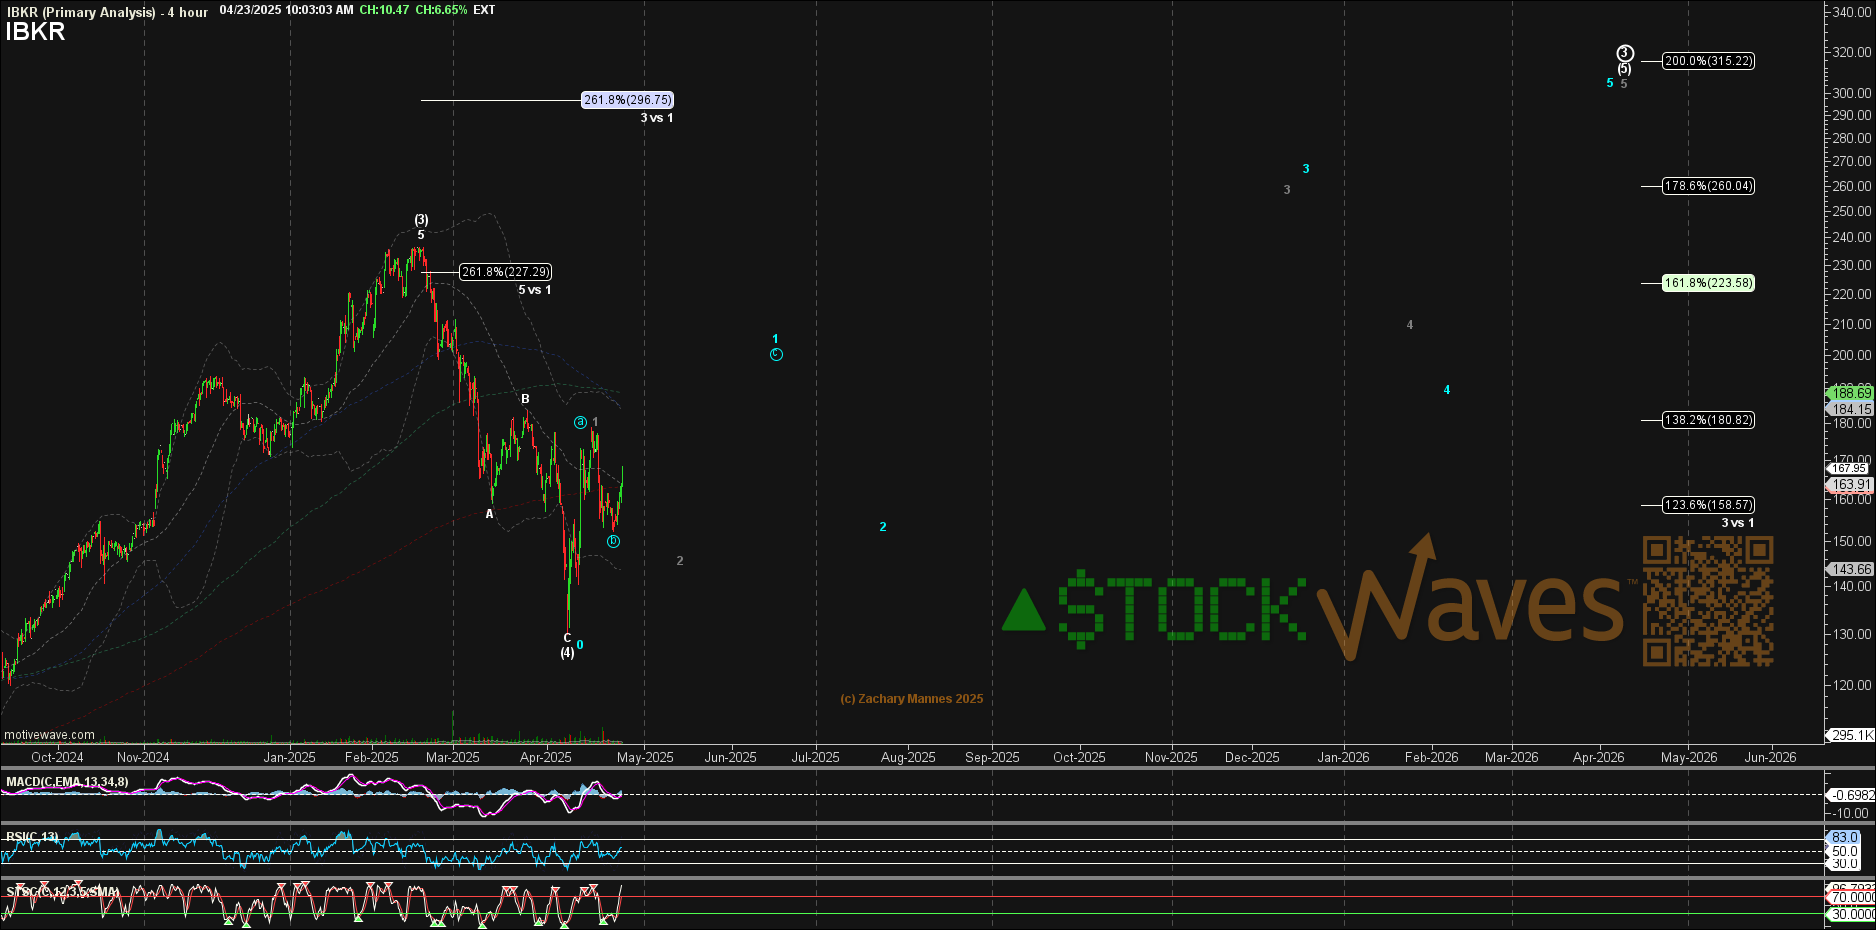
Zac is pointing out that, depending on one’s time frame, the holding period during the next anticipated rally phase may be less than others. It really is a matter of the individual trading plan, risk profile and goals. Note Zac’s chart that was included with this setup.
Both Zac and Garrett have similar bigger picture views. However, in their respective charts you can see how they are allowing for some slight subtleties in the subwave structures. The basic premise though is that price is in a Primary Wave 3 and for as long as the key levels hold throughout the structure, we see this as the most probable path going forward.
Important Risk Management Caution
This is a message that is front and center for all of our members, particularly those new to this methodology:
“We want everyone on ElliottWaveTrader to understand that markets are fluid, dynamic, non-linear systems. In order to trade such systems, one has to develop the experience necessary to navigate its complexities. Therefore, we strongly suggest that a trader takes the time to learn Elliott Wave and supporting technical analysis BEFORE beginning to trade his or her hard-earned money. Unfortunately, we have seen too many new traders attempt to jump in with both feet without an appropriate background. This is the easiest way to blow up your trading account, so we strongly caution against it. Also, our general advice is that you do not enter any trade with more than 3% of your trading account and ALWAYS use stops.”
Why is this so key? You must know what type of a trader or investor that you are. What are your favorite time frames? How much risk are you willing to take? What level of stress can you manage? There are many ways to discover your style and then form a successful trading plan.
Don't Be Turned Off By Misapplication Of This Methodology
Obtaining a true understanding of this methodology takes time and effort. For those willing to invest in said effort, it pays off immensely. Those who are turned off by the words "Elliott Wave" typically have come across those who misapply the theory or are not willing to devote the requisite energies needed.
Our methodology is pointing to the potential for a low-risk, high-reward bullish setup for (IBKR) stock. Not all paths will play out as illustrated. We view the markets from a probabilistic vantage point. But at the same time, we have specific levels to indicate when it's time to step aside or even change our stance and shift our weight.
Conclusion
There are many factors beyond one’s control. There are also market forces at work that an individual may not even perceive. Sentiment. Fear. Greed. It is all pushing and pulling the price of the stock across the chart. Our job as market observers is to identify the probable path or paths likely, and then determine our entry and exit points. That is the extent of our control. Everything else is just an illusion.
If you are amenable to seeing the markets from a new point of view, then the proper application of this methodology may just be for you. The understanding of the true nature of crowd behavior is within your grasp. Come see how we do this every day!
(Disclosure: I/we may initiate or hold long positions in this stock in accord with the parameters shared in this article)

