I Am Getting That Itch
 By
Avi Gilburt
By
Avi Gilburt
With the pullback in the metals now taking us a bit deeper in a more direct fashion, I have started to get that itch to buy back what I sold. Yes, I may be early and I still am not sure if we see lower lows before the next rally takes hold. But, let me explain why I may start buying.
When the market began to head lower into today, that itch I started having forced me to look at the downside ratios.
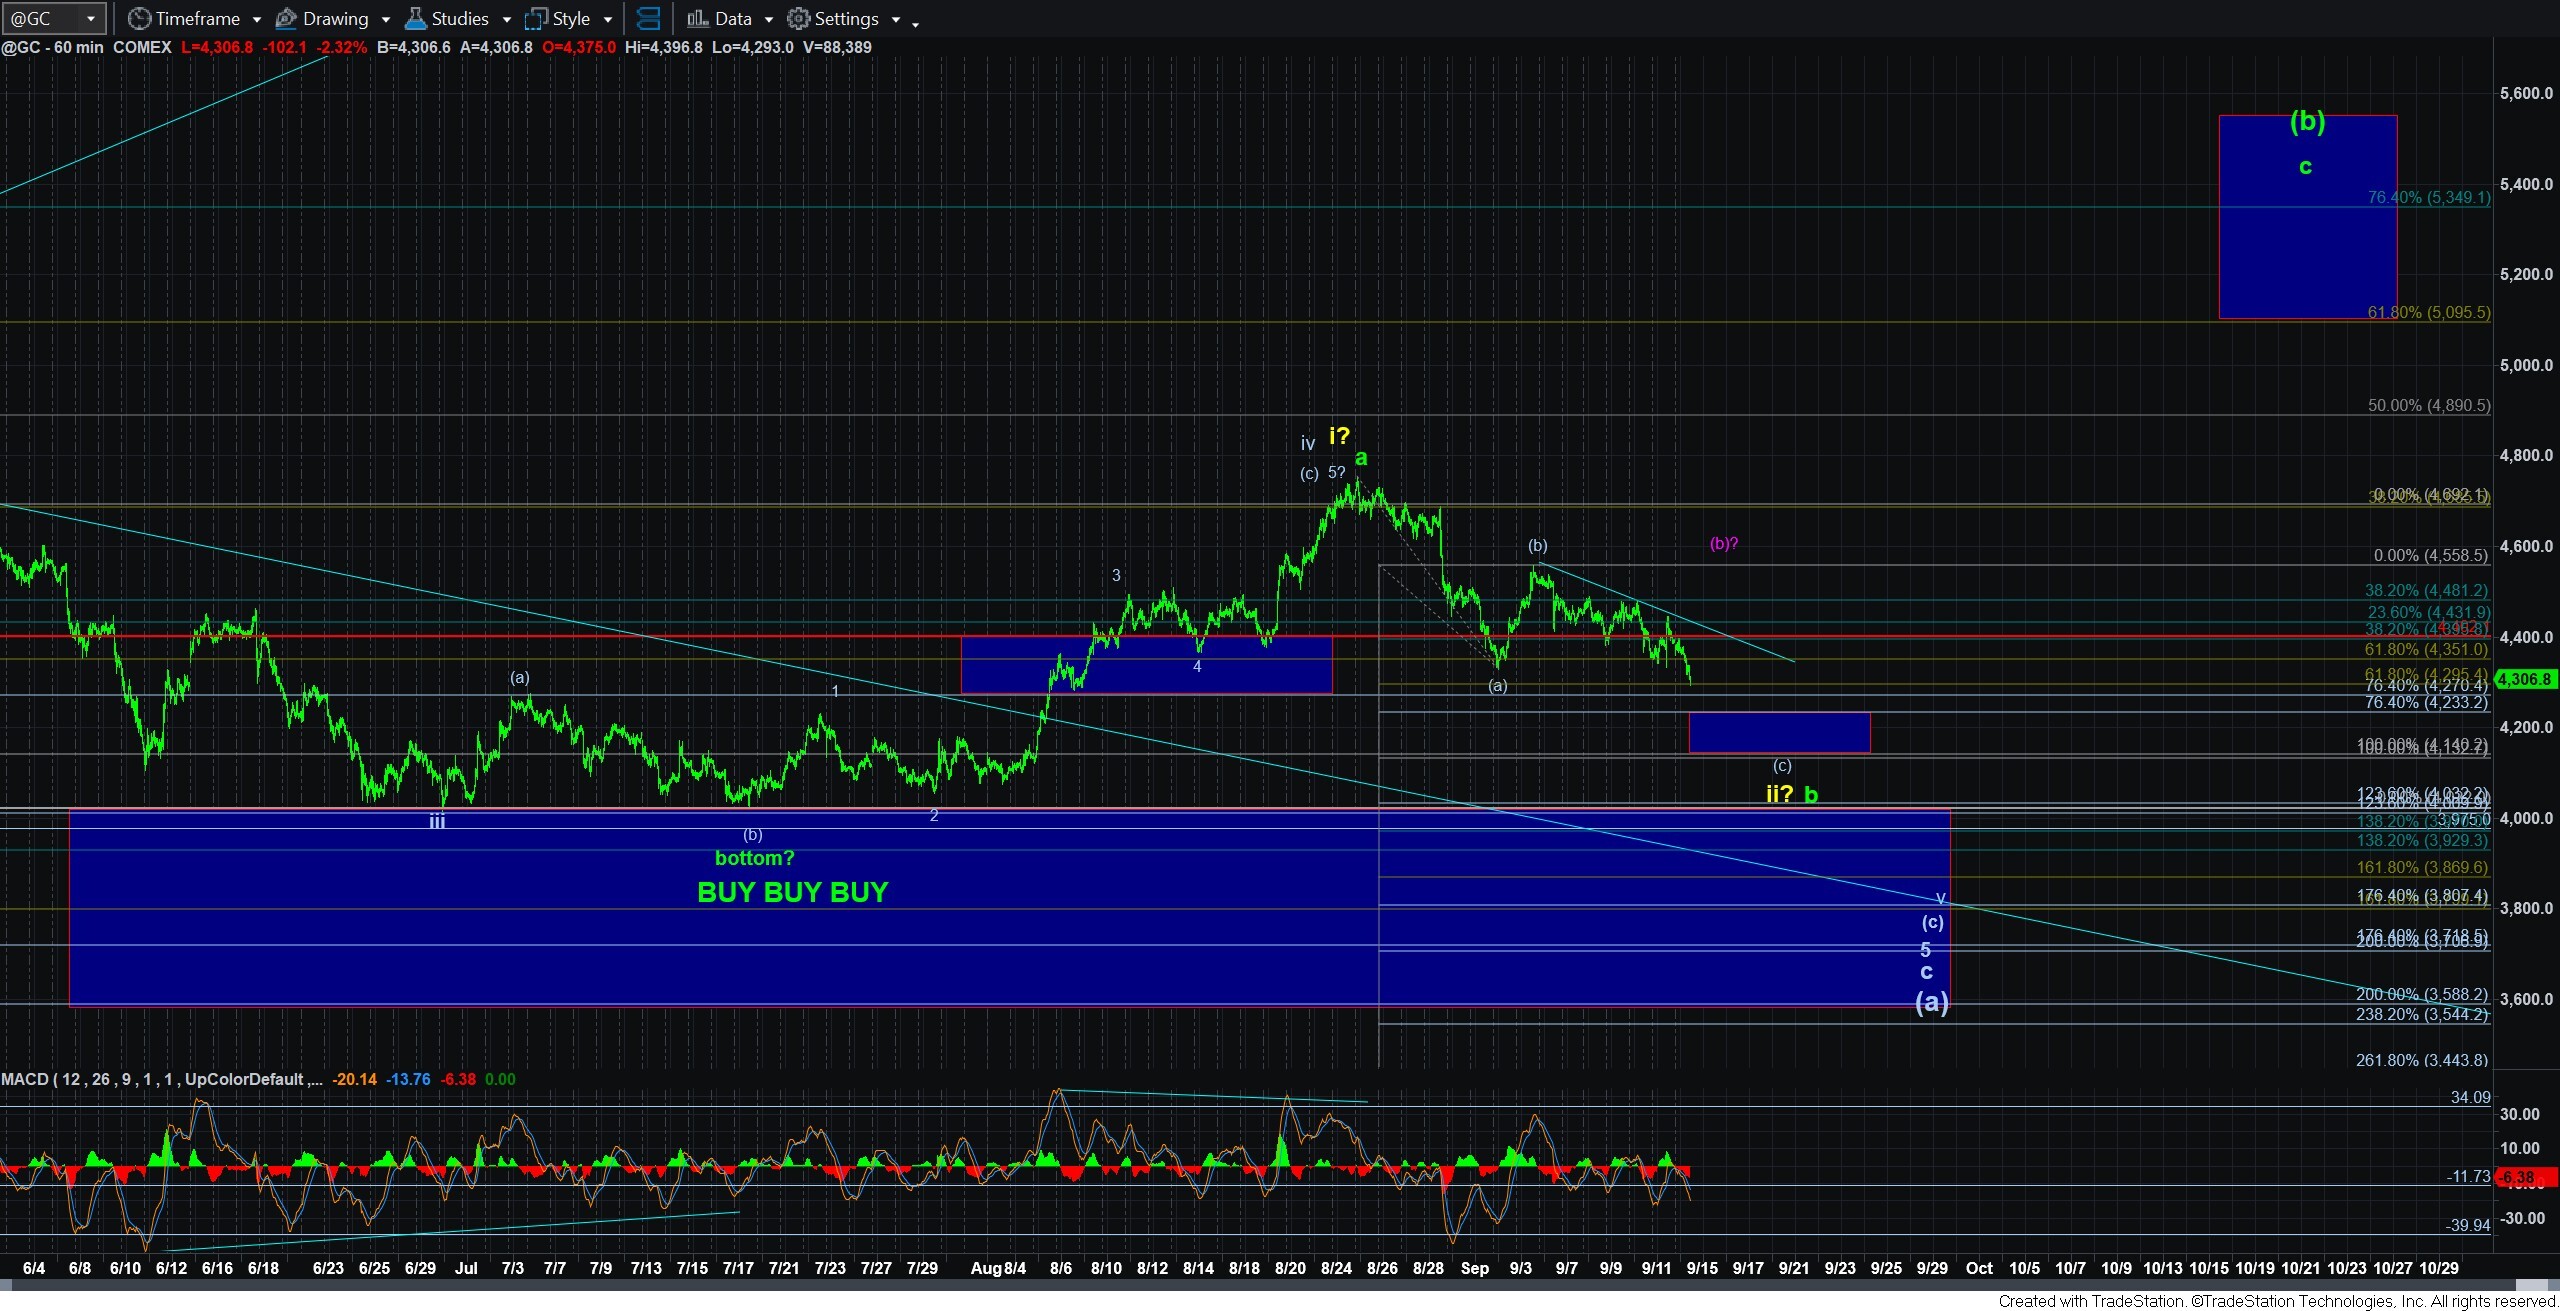
First, in gold, I have added a box on the 60-minute chart which represents the point wherein (c)=.764*a until (c)=(a). This could be a buying region. And, stops could go below that box.
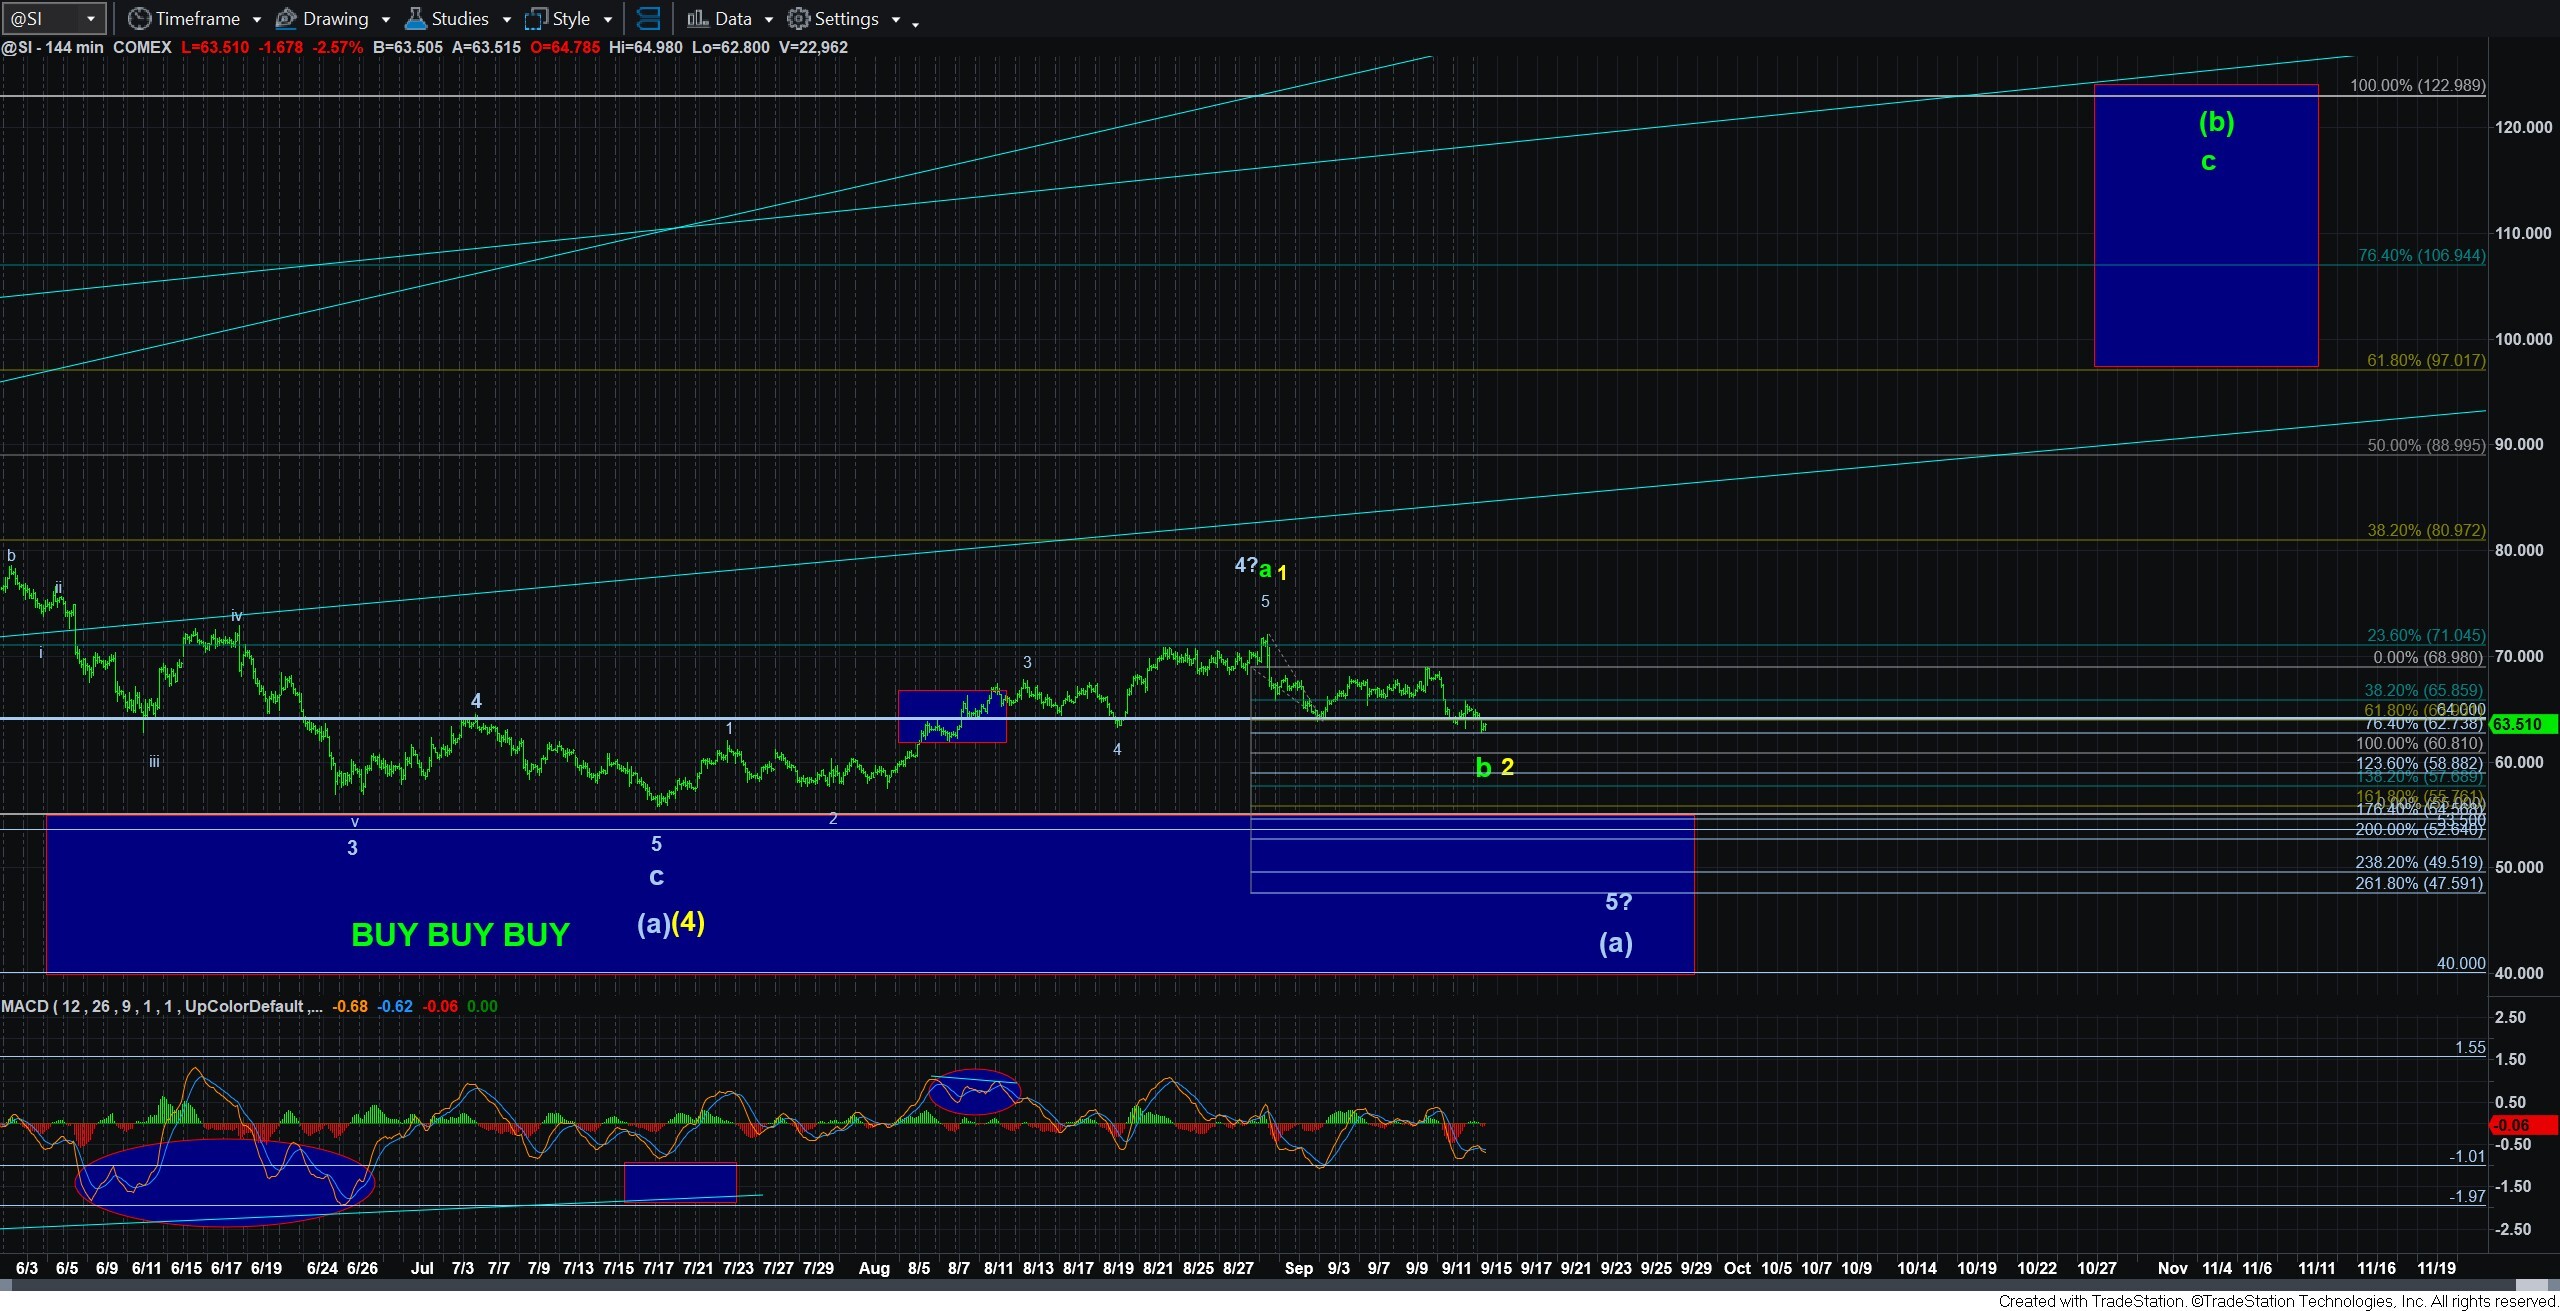
In silver – which I am less sure of – the (a)=(c) is in the 60.81 region.
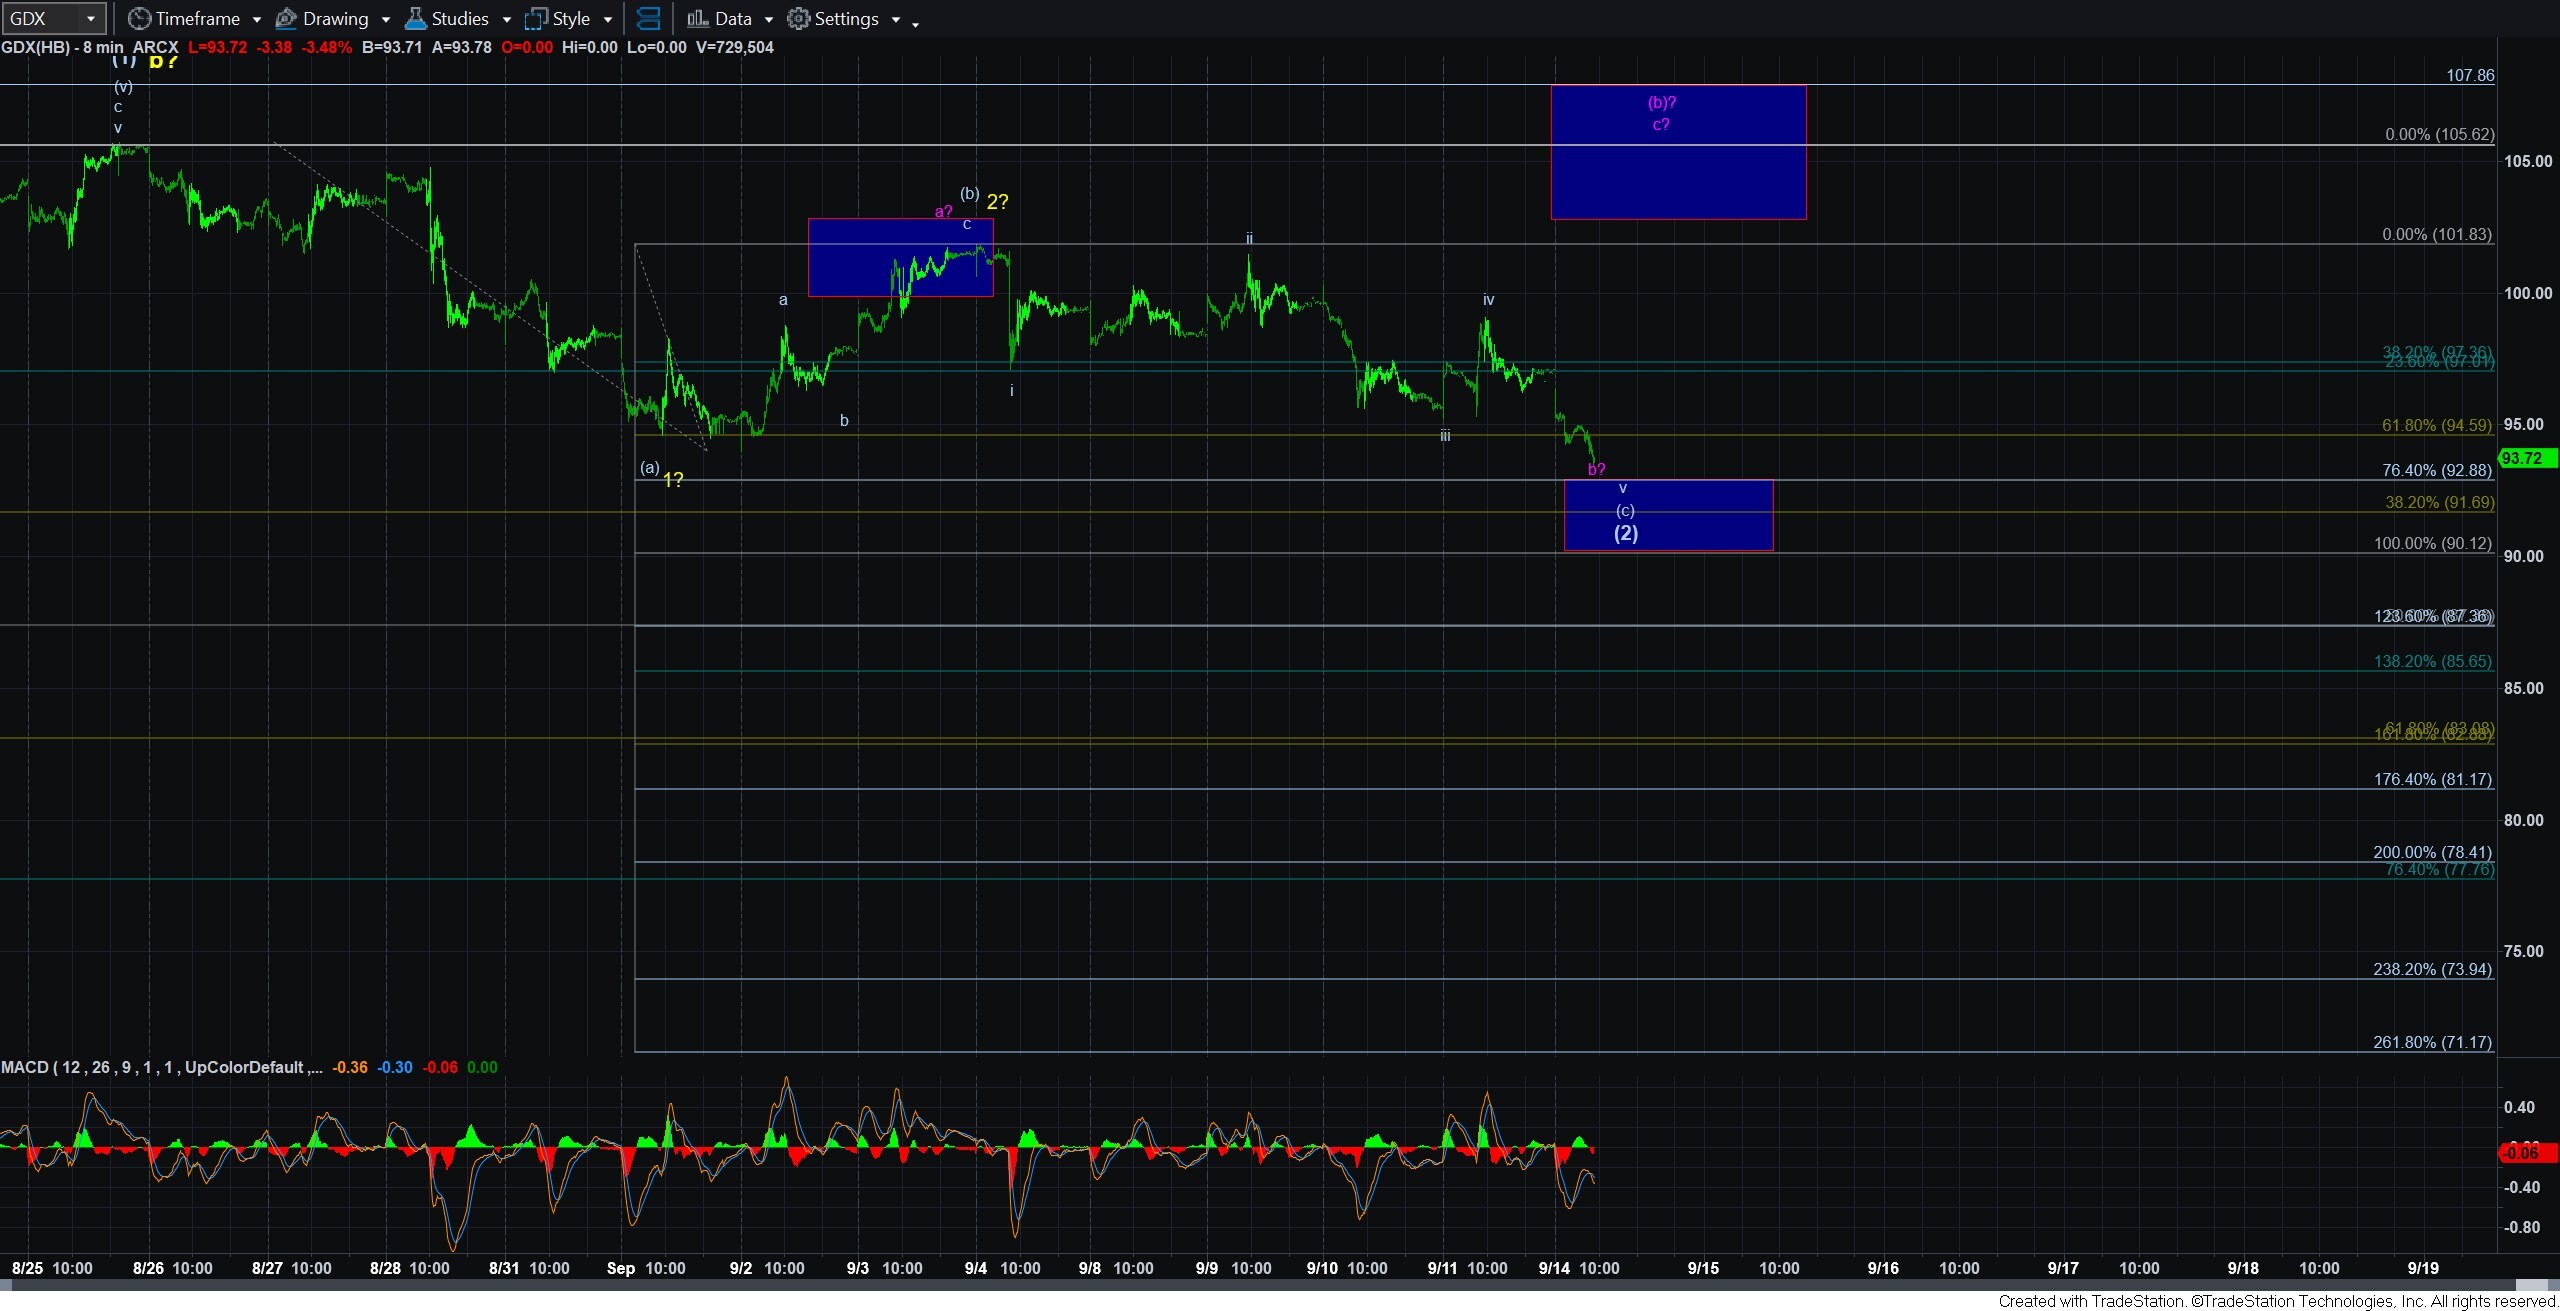
And, GDX is a bit different, as it is much more shallow right now. The (c)=.764*(a) comes in at 92.88 and the (a)=(c) at the 90 region. Stops can go below the 1.00 level which is 90.12.
I want to remind you that I am a simple analyst and not a prophet. I am not sure if we are or are not still going to see lower lows before the market bottoms out. But, what I can say is that these are relatively tight parameters to consider adding long exposure. Should these charts begin to break their respective (a)=(c) levels, then we have an initial sign that the market may be trying for those lower lows.
Should we see a clear 5-wave rally off a low in this upper region, then we can always add positions on a corrective pullback and put stops at the low we strike in this region.
This is just a general plan I am giving you so take it in the vein in which it was intended.