How Much Lower Can We Go?
With the downside follow through this week, the question with which we are now faced in miners predominantly is how far down will this drop? And, the answer will provide a strong clue as to whether this is a wave 2 of iii in GDX, or a bigger wave ii.
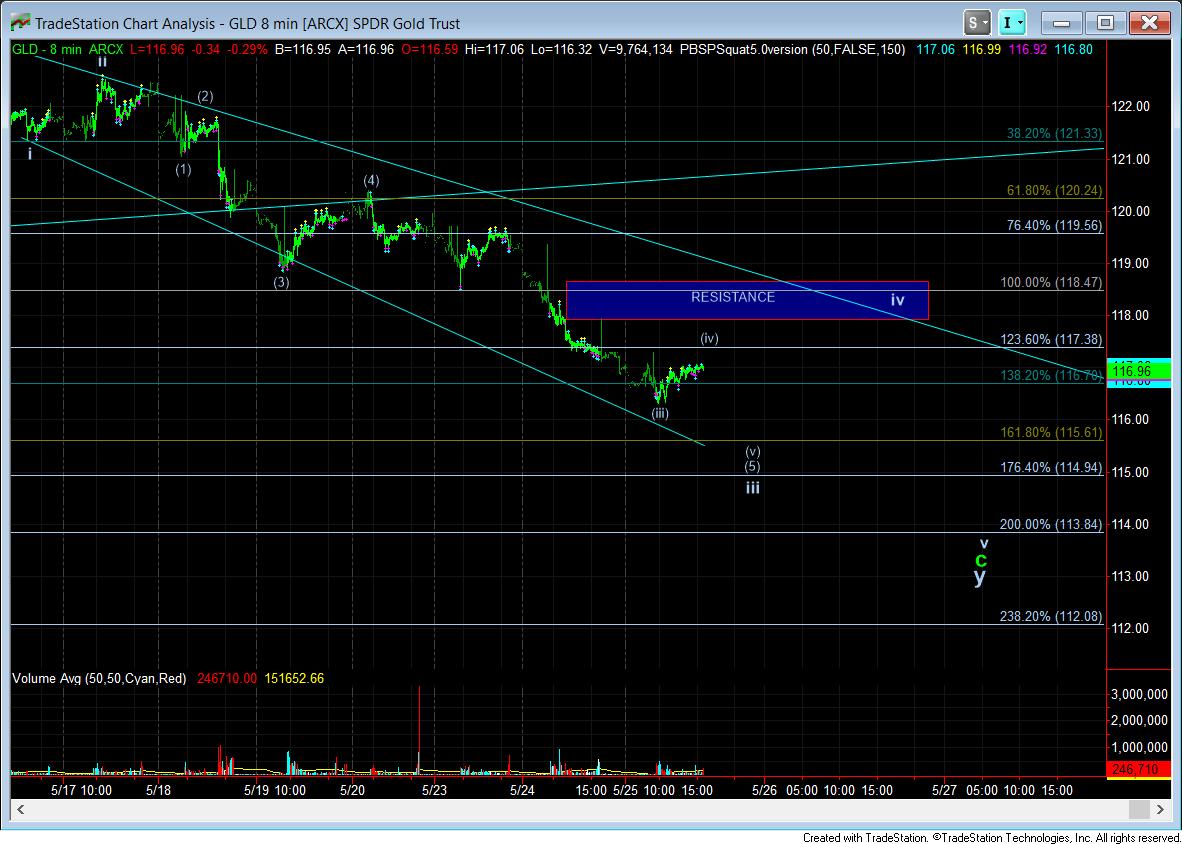
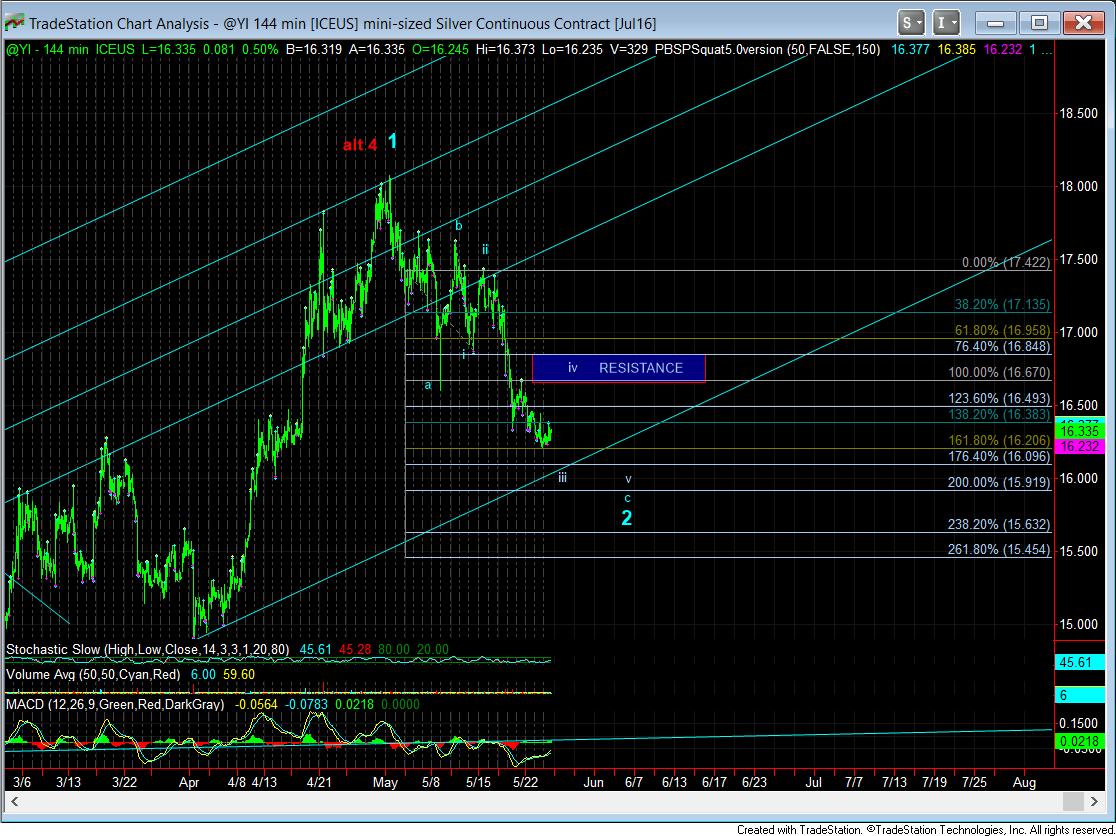
While the GDX seems to present the potential of a final degree 4th wave to complete this correction, the GLD and silver both seem to need a micro 5th, followed by one more 4-5 before they complete their perspective declines. While I can certainly be wrong about the complex having bottomed and seeing everything move through their respective resistance regions would suggest I am wrong, and the bottom is in, I am simply going with the micro count I have been following to date.
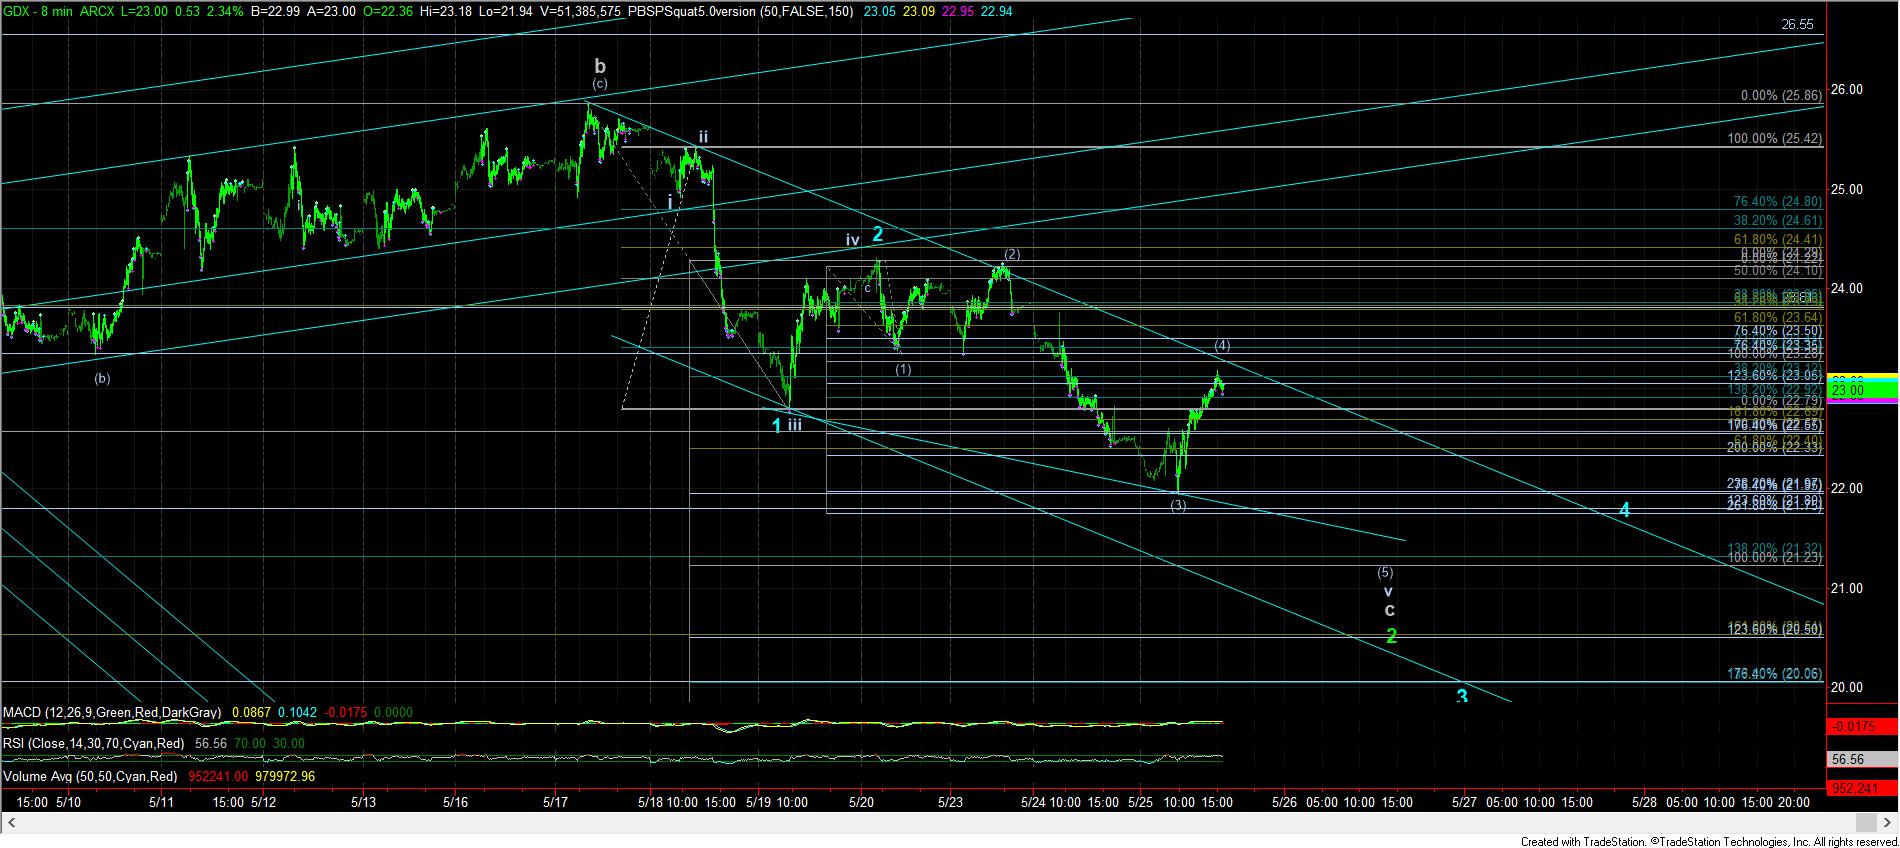
In the GDX, as long as we remain below 23.40, the door remains open to a much bigger drop in the blue count, which coincides with the blue ii on the daily chart. As you can see, it would take a break down below 21.20 to open the door to the blue count, and have GDX targeting the 18-19 region for a larger degree wave ii pullback. However, should we see a move through 23.40 before we drop, it would suggest this last segment of the drop is an ending diagonal, as we would then have overlap into wave (1) territory, and make it unlikely that we break down below 21.20.
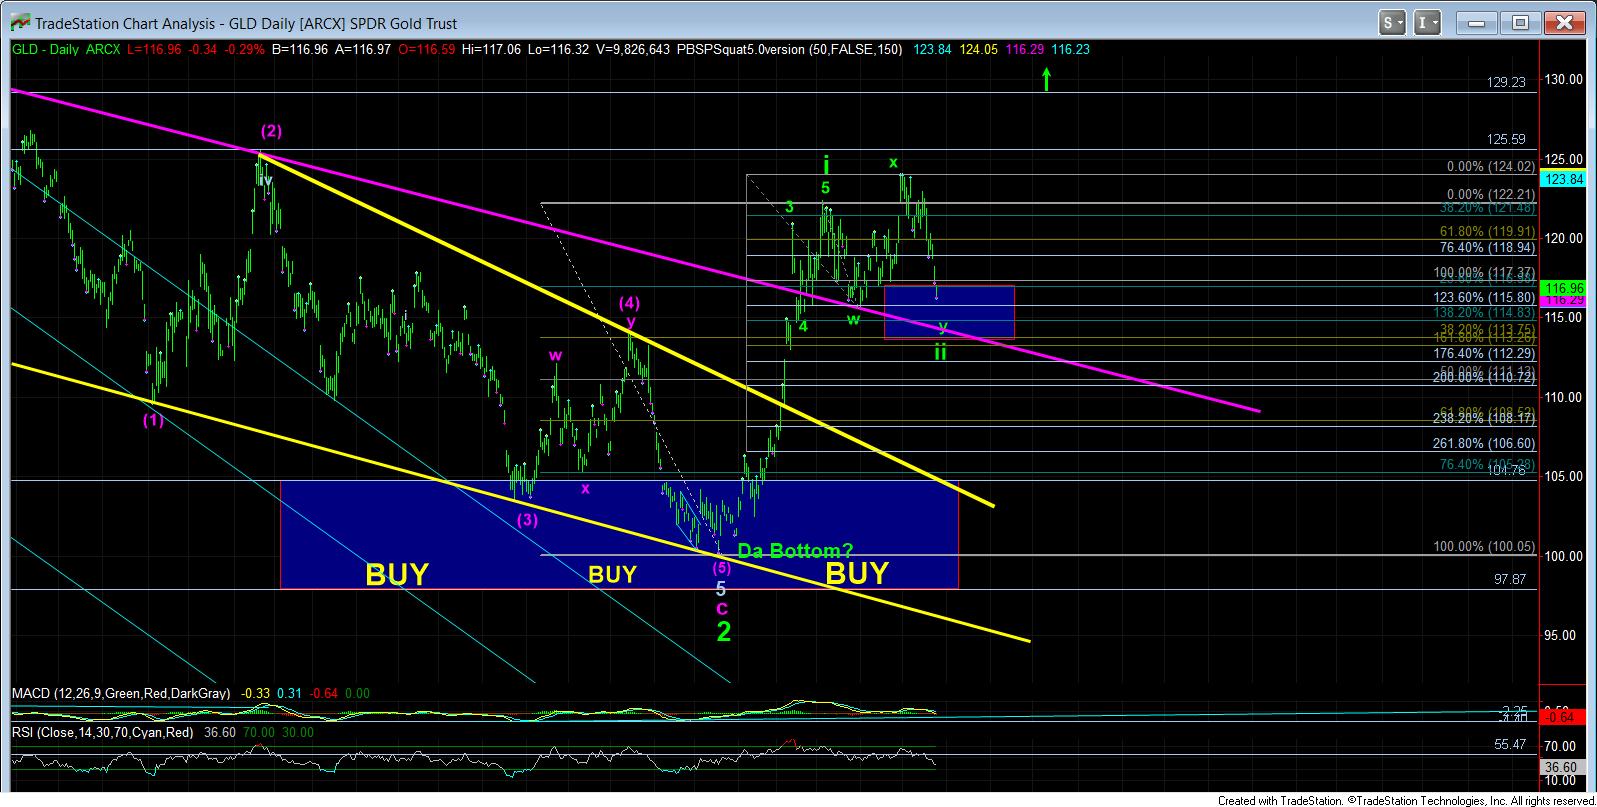
I have noted the potential paths for both the GLD and silver on their respective smaller degree charts. And, as long as they maintain below those resistance regions, I am still looking for further subdivisions lower. However, a strong break out from those resistance regions would suggest that this 2nd wave has completed, and silver is heading to 27-28, GLD to 160+, and GDX to 40+.
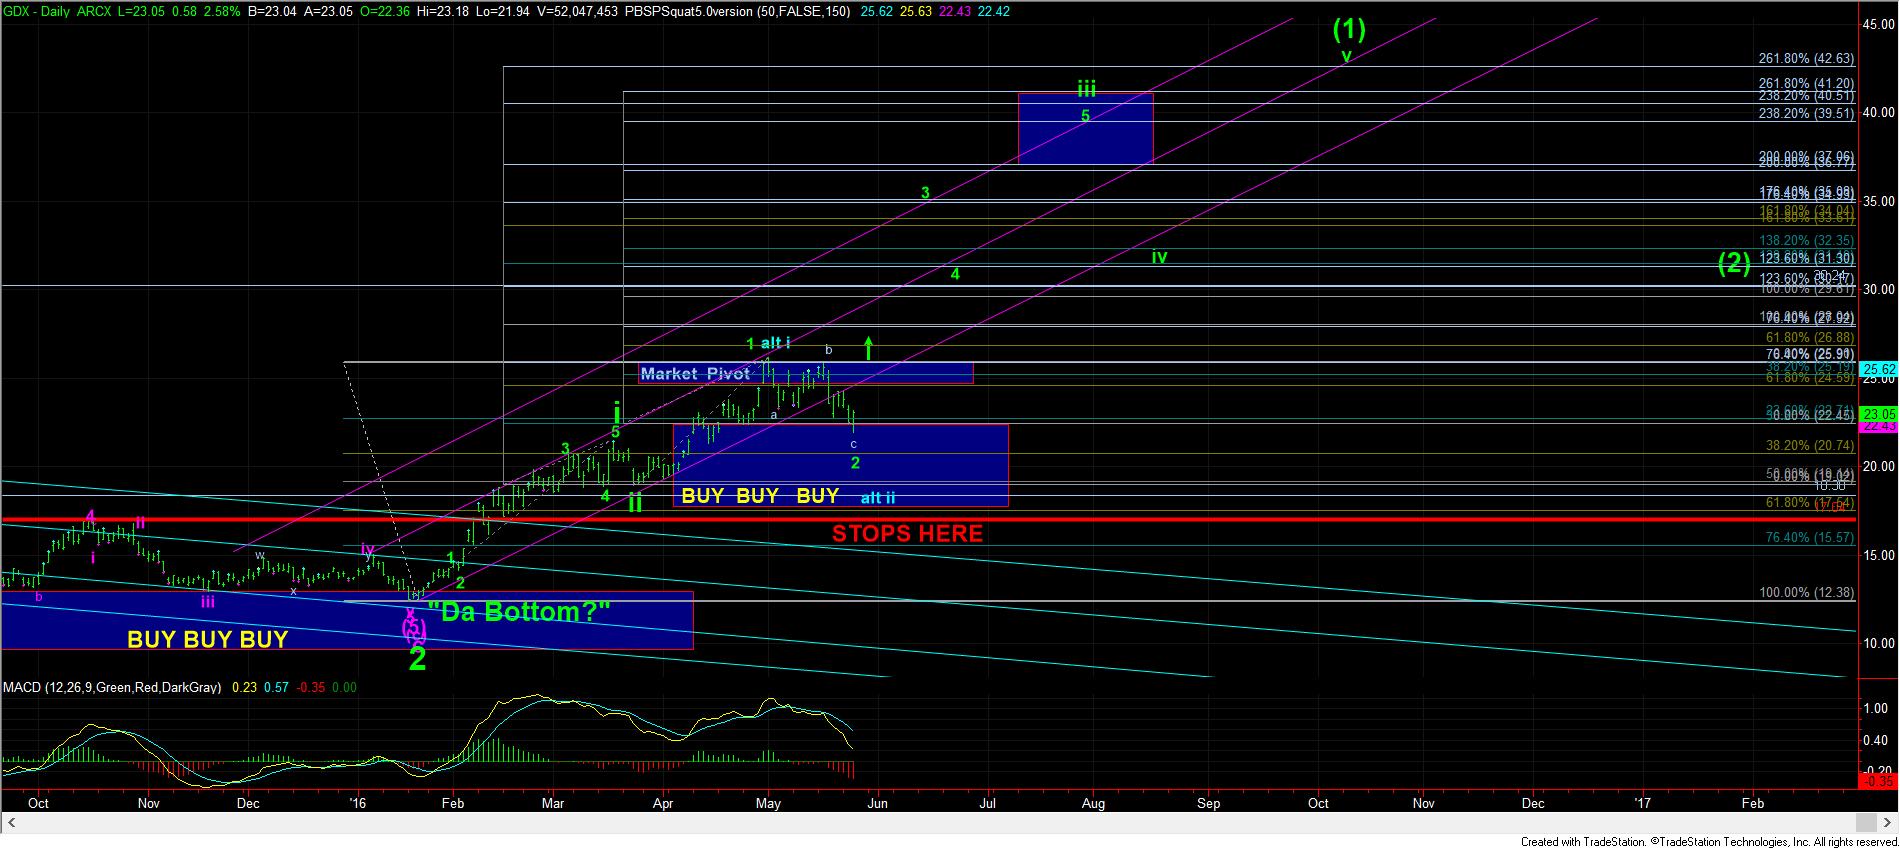
For those that are taking a larger degree perspective in this complex, we have now moved into our secondary “buy, buy, buy” box. Moreover, I have added a notation as to where to place stops, which is just below the 17 region. Should we see a break down below that region, it is strongly suggestive of lower lows, but that is not my expectation at this point in time. So, the daily chart should provide you with a nice “plan” for those only focusing on the larger degree potential in this complex.
Lastly, I want to note that we do have the “minimal” number of waves in place to even consider this correction completed. While I am being a stickler about the micro count, if the market should provide break out indications over the next few days, do not stand on ceremony that the final squiggles did not get met, as this market can get away from you quite quickly, especially if we see the GDX take out our market pivot on the daily chart.