How Much Higher Can We Go?
While the rally we experienced this past week was my "preferred path," as noted in my last weekend analysis, I was unable to reasonably make it my primary count until we were able to move through resistance. Once the market broke out through the 2680 region resistance on the S&P 500 (SPX) this past week and then held that level as support on a pullback, I began to set my sights on how we can rally to 2900+. And, much will depend upon the action we see in the coming week.
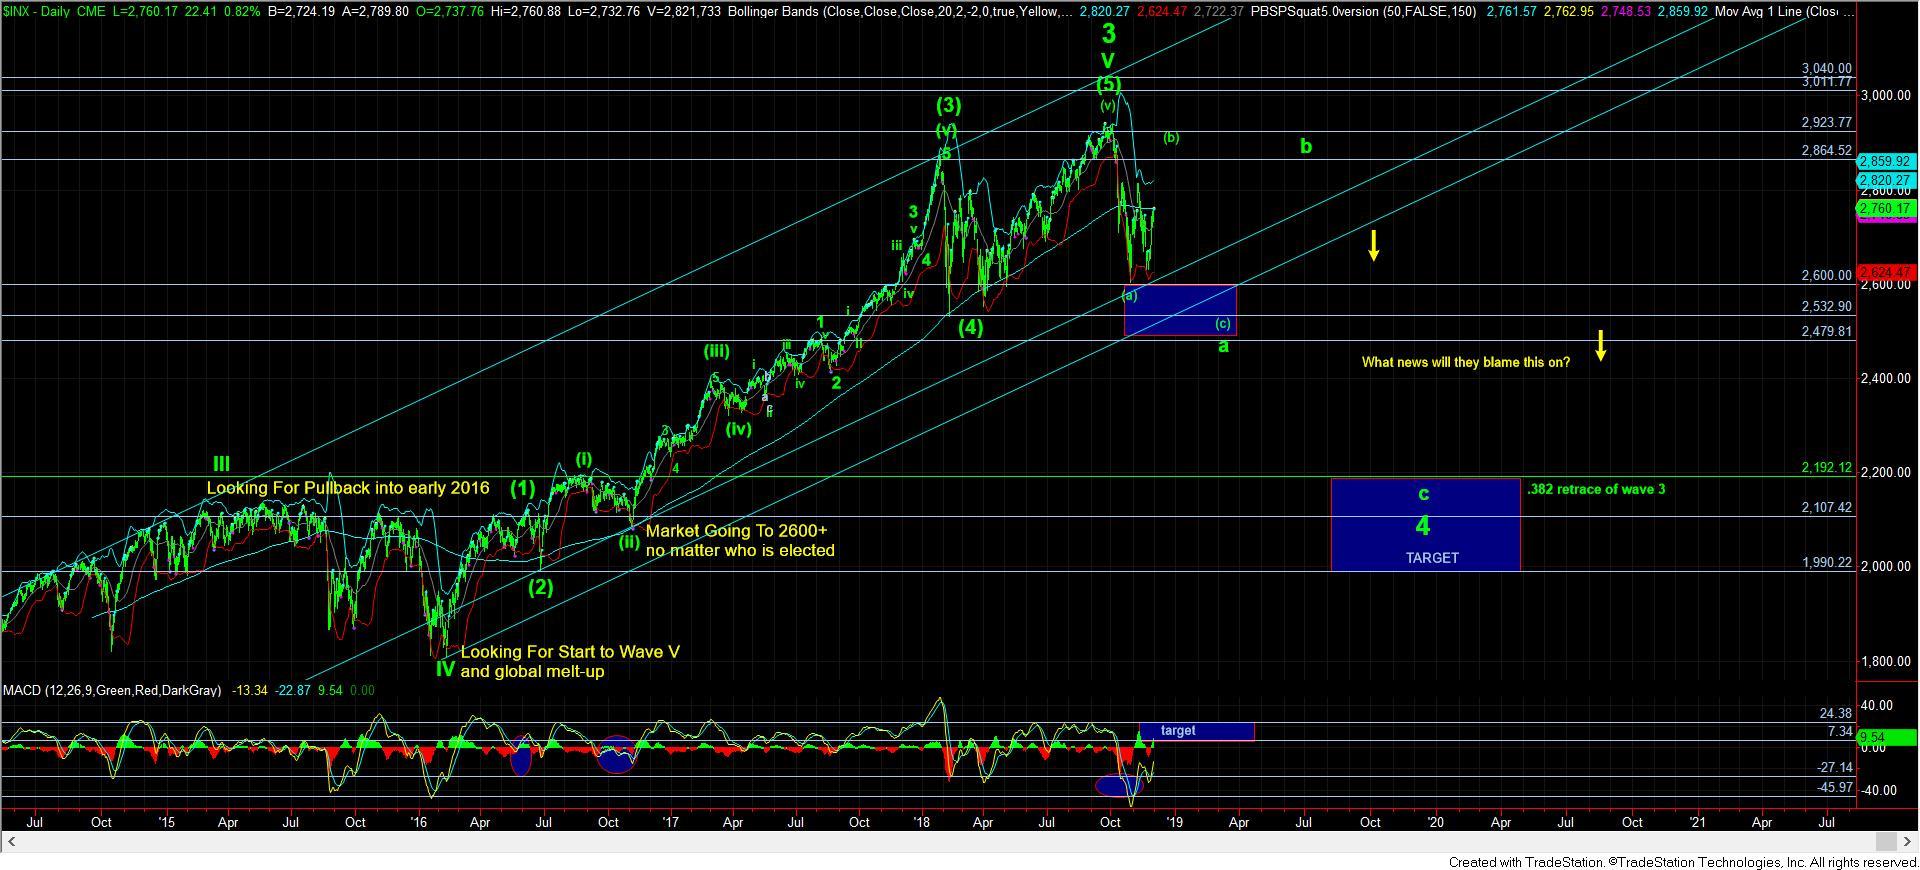
My primary expectation is that I believe we are in a b-wave rally. And, as we discussed back in September and October as we were dropping in the initial move off the all-time highs, we may see a very strong b-wave rally in order to generate the bullishness needed to be able to drop to our ideal target for wave 4 in the 2100/2200 region. As we also outlined, that rally can even make a higher all-time high.
For those that may not remember, I wrote about this back in October:
“Moreover, when the larger degree impulsive structure of the market comes short of its bullish target, we often see the b-wave of the ensuing correction provide us with an expanded corrective structure, wherein it stretches to a higher high to strike the target missed by the impulsive bullish move. So, I have added an alternative b-wave target in yellow on my daily chart. But, before we even consider that potential, the market must provide us with a completed a-wave down towards the 2600SPX region in the coming weeks.”
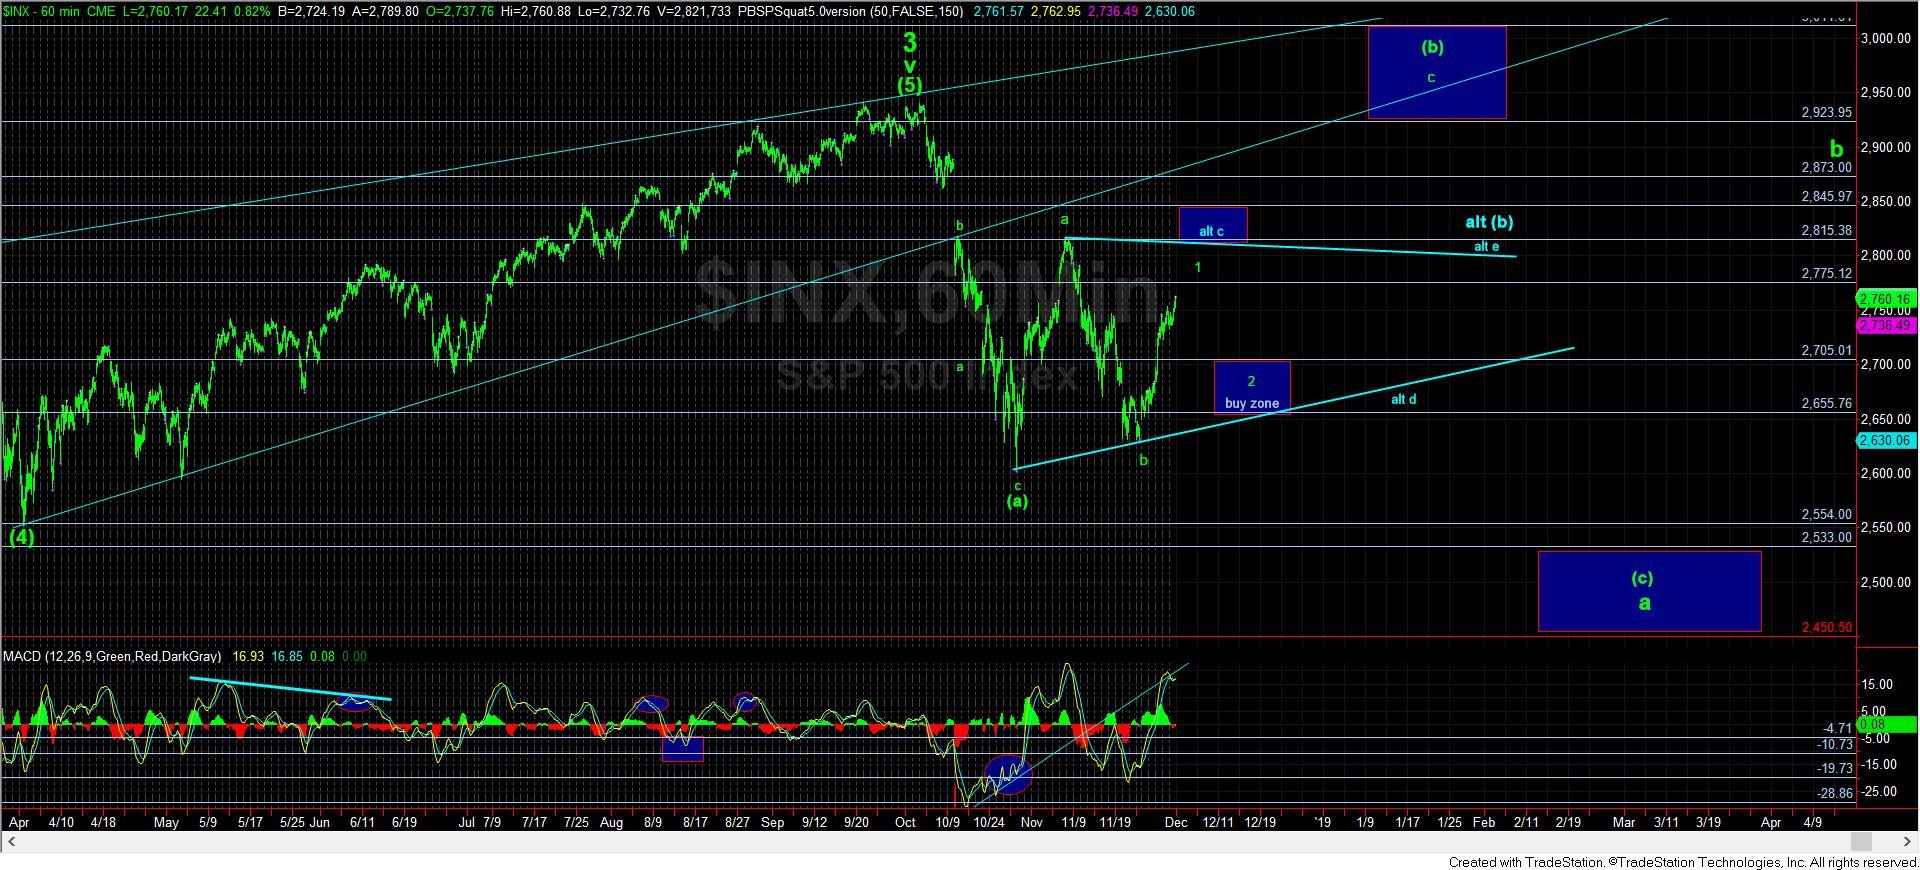
But, in order to be able to break out strongly through the 2900 region for a higher b-wave potential, we will need a 1-2 set up, as presented in green on the 60-minute chart. That would be my preferred path to be able to push us through 2900, and potentially even as high as the 3000 region in an expanded b-wave pattern, as we discussed well over a month ago.
However, in order to see that 1-2 structure, we will need to start seeing some pullback early in the coming week. You see, if the market continues directly higher towards the lower resistance box overhead between 2815-2845SPX, with the 2845 region being the point where a=c, then this (b) wave can top out well below the 2900+ region. And, if we do see a direct move up to 2845SPX, then I will have to take off that “buy box” on my 60-minute chart, and begin to look for shorting opportunities.
For those that may also remember back in October, I was noting that we really should see the daily MACD on the SPX rally back up towards resistance in order to support a drop as deep as our target region in the 2100-2200 region for wave 4. And, as you can see, we still have a lot of room to the upside for that MACD on the daily SPX chart to rally.
So, at this point in time, the MACD causes me to expect that the market can rally much higher in the coming weeks. Most specifically, I don’t think we will develop the set up to take us directly to the 2100/2200 region until the daily MACD does reset. However, the smaller degree path is still the question in my mind. My preference is to see the 1-2 set up develop over the next week or two, and that can project to take us over the 2900 region.
But, instead of pulling back, should we see a direct move to the lower target box on the 60-minute chart between 2815-2845SPX it could suggest that we will see another decline towards the 2450-2500 region before a bigger b-wave rally tries to reach those higher targets, as noted above. So, we still have to be somewhat vigilant, as 4th waves are notorious for their variable structures.
After doing this for many years, I can tell you that this is simply the nature of this environment, and we often see way too much bravado during the strong whipsaw moves that are the hallmark of corrective structures. Ultimately, they humble all who trade too aggressively within them, which is a lesson you learn through experience. So, rather than trading aggressively during this environment, most investors should be focused upon capital preservation so that you can redeploy your capital at lower levels once this correction runs its course to take us to those lower targets in 2019/20.
Lastly, keep in mind the famous perspective that “topping is a process.” As I noted once we started breaking down in October, it will likely take months to set up the drop to our ideal target region below. I still think that to be the case. But, ultimately, this market will top out, and provide us with our set up in the c-wave projecting down to the ideal target for this 4th wave in the 2100/2200 region. That is the one trade in this 4th wave that I am personally stalking, and I intend on being patient until the market presents me with that opportunity.