How Deep Will Metals Retrace?
This is the question we now have to determine, and the answer will likely finally settle the questions we have been having in the complex.
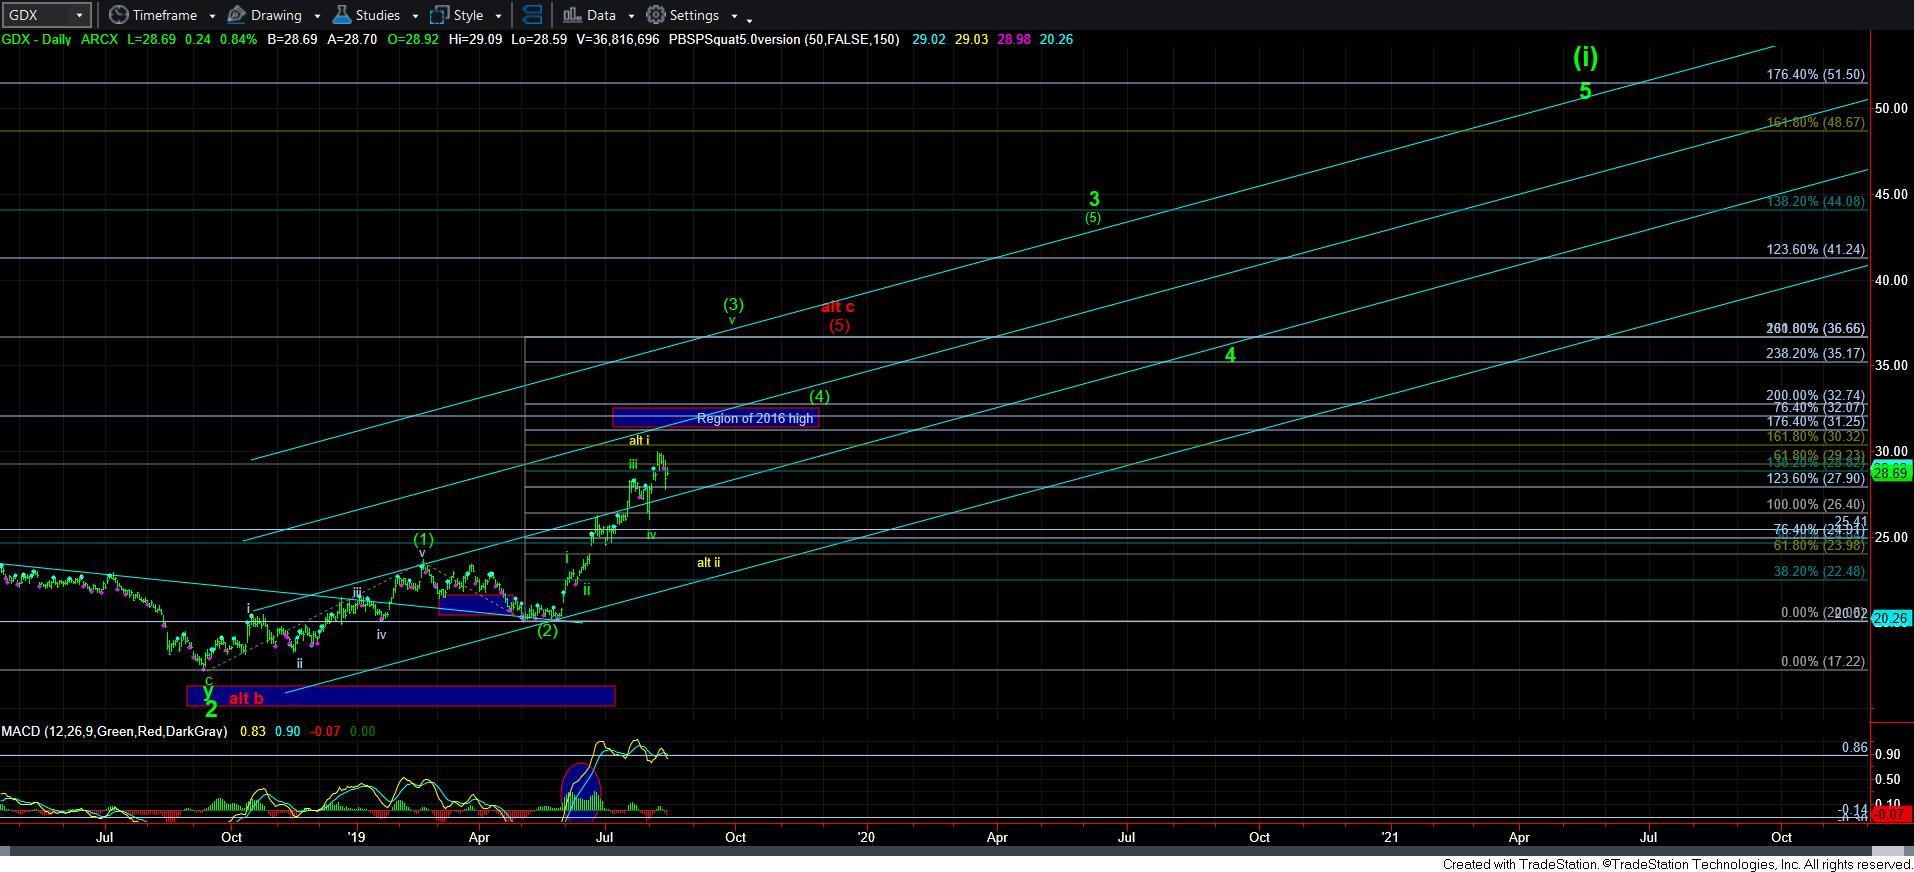
As many of you that have been following the various counts closely know, Zac and Garrett have been following a diagonal count, which is supported by a number of individual mining stocks. However, I have been allowing the market to prove a standard impulsive structure, whereas I only default to the diagonal if I am forced to do so.
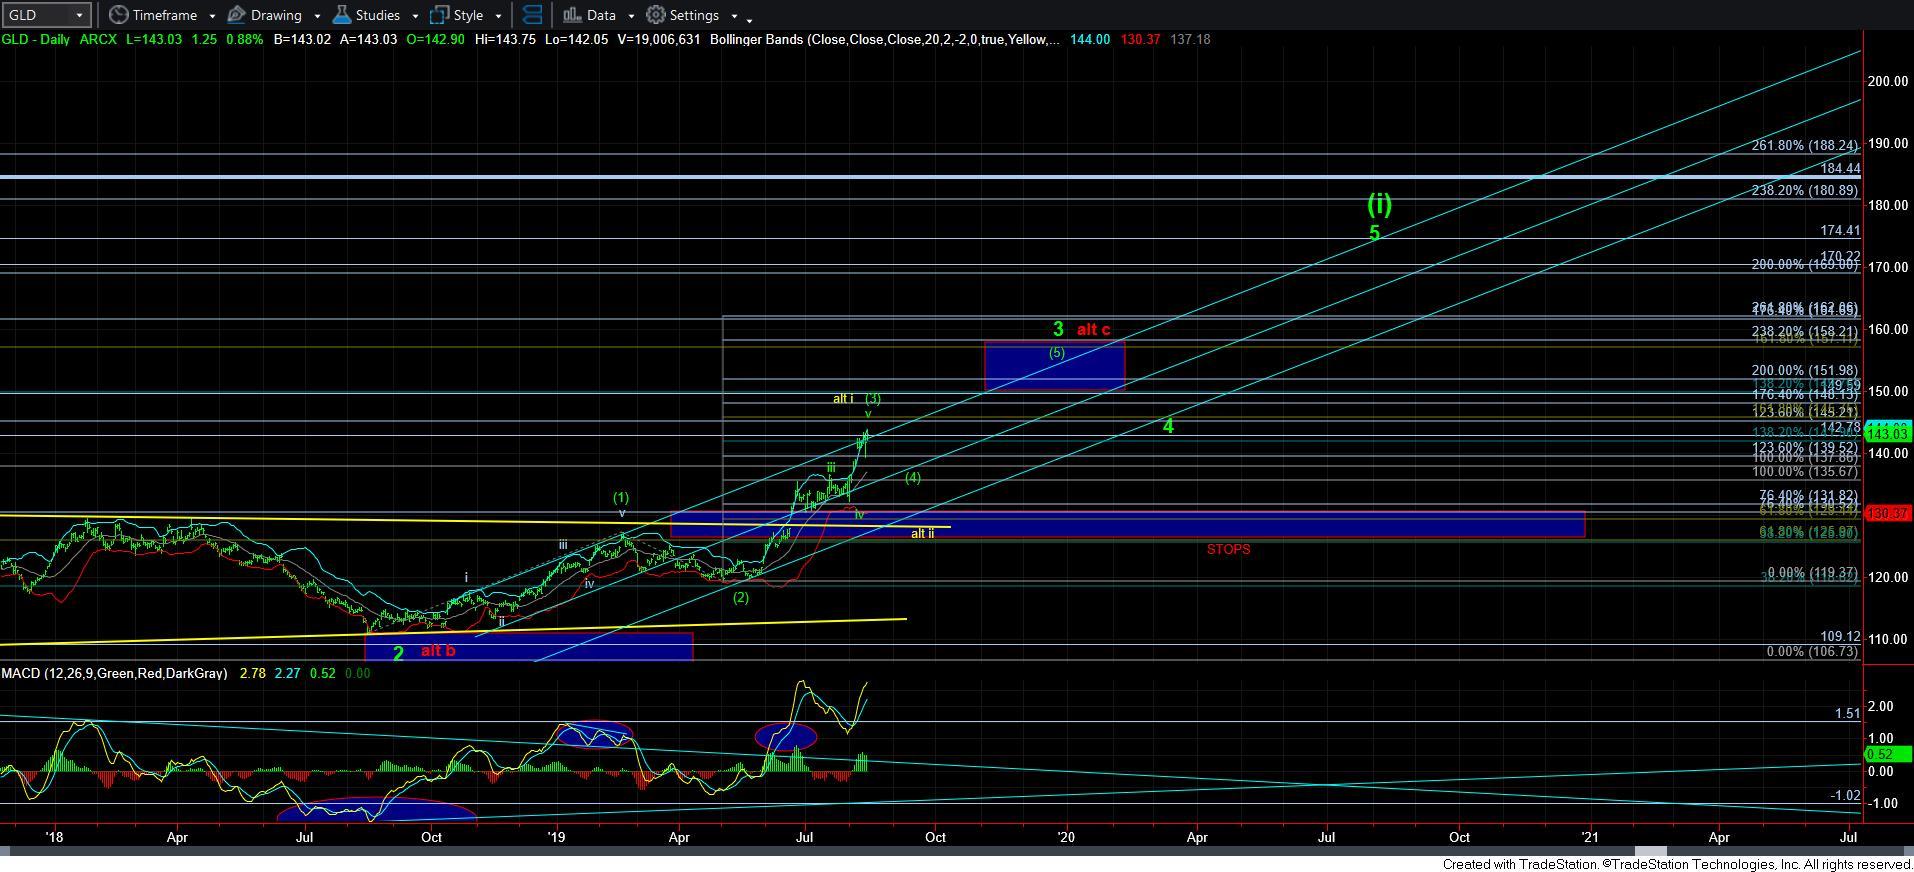
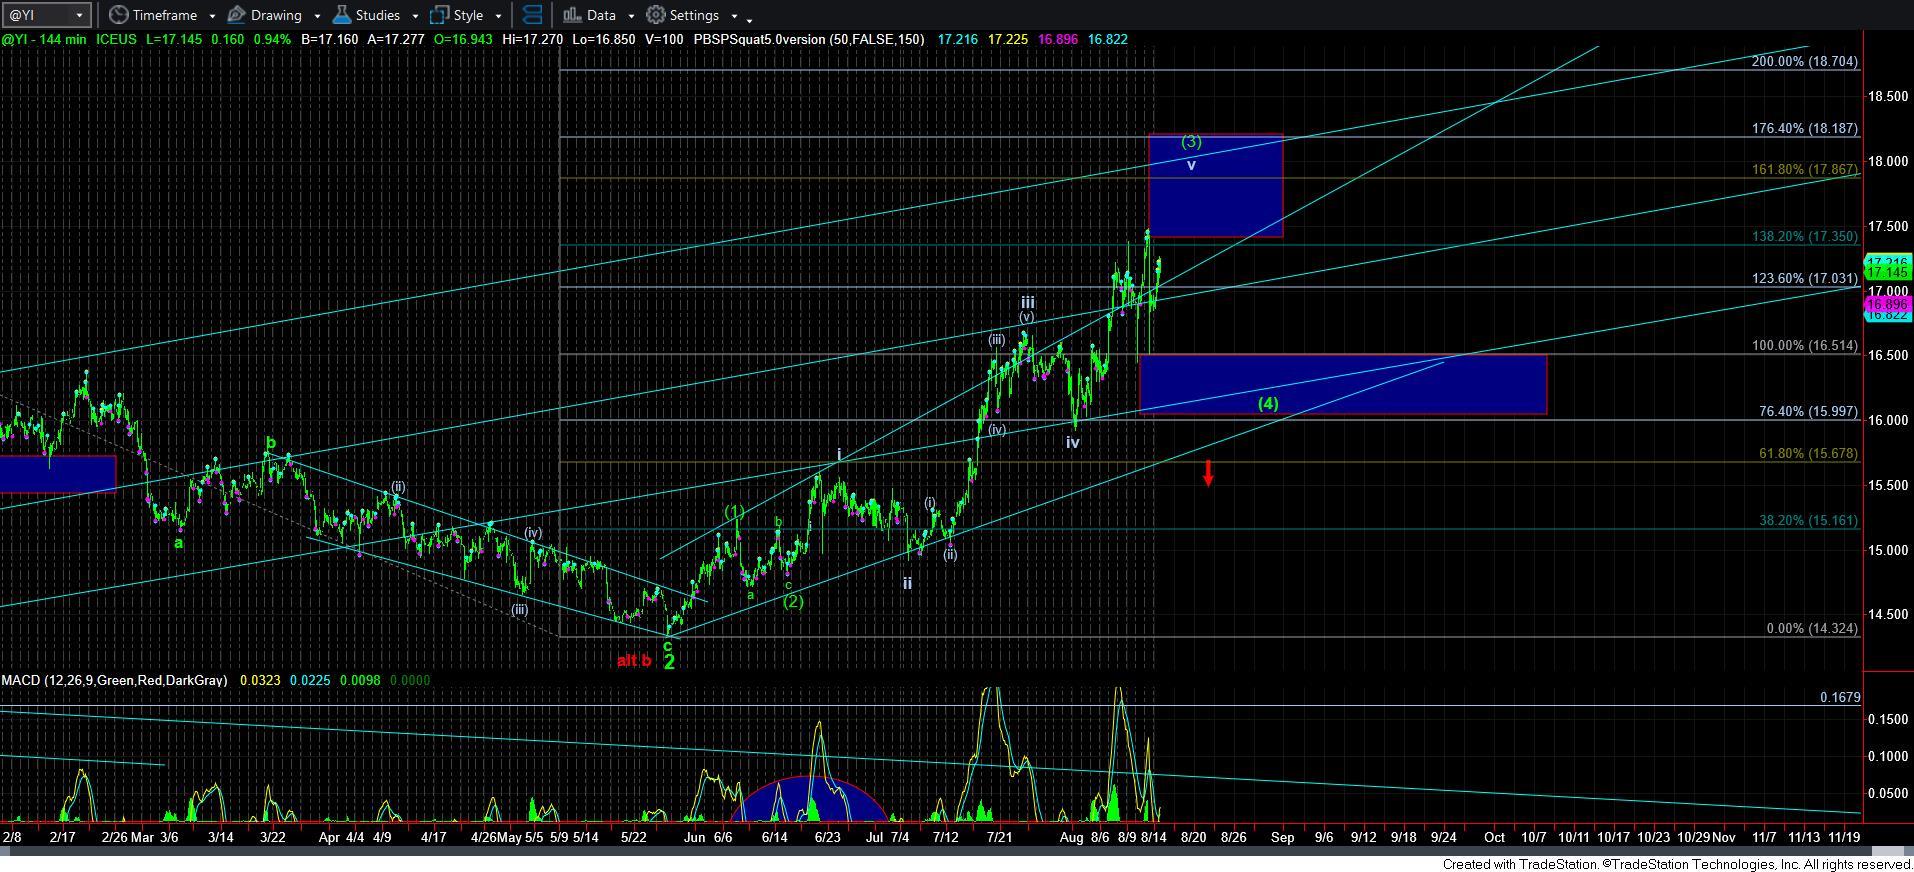
While GLD has struck the minimum target we set for this stage of the rally, GDX has certainly come up short. Moreover, silver also only struck the minimum target. And, the fact that we have only struck minimum targets causes me to be on my toes for a bullish alternative which can keep us within the strong bullish structure I have been tracking.
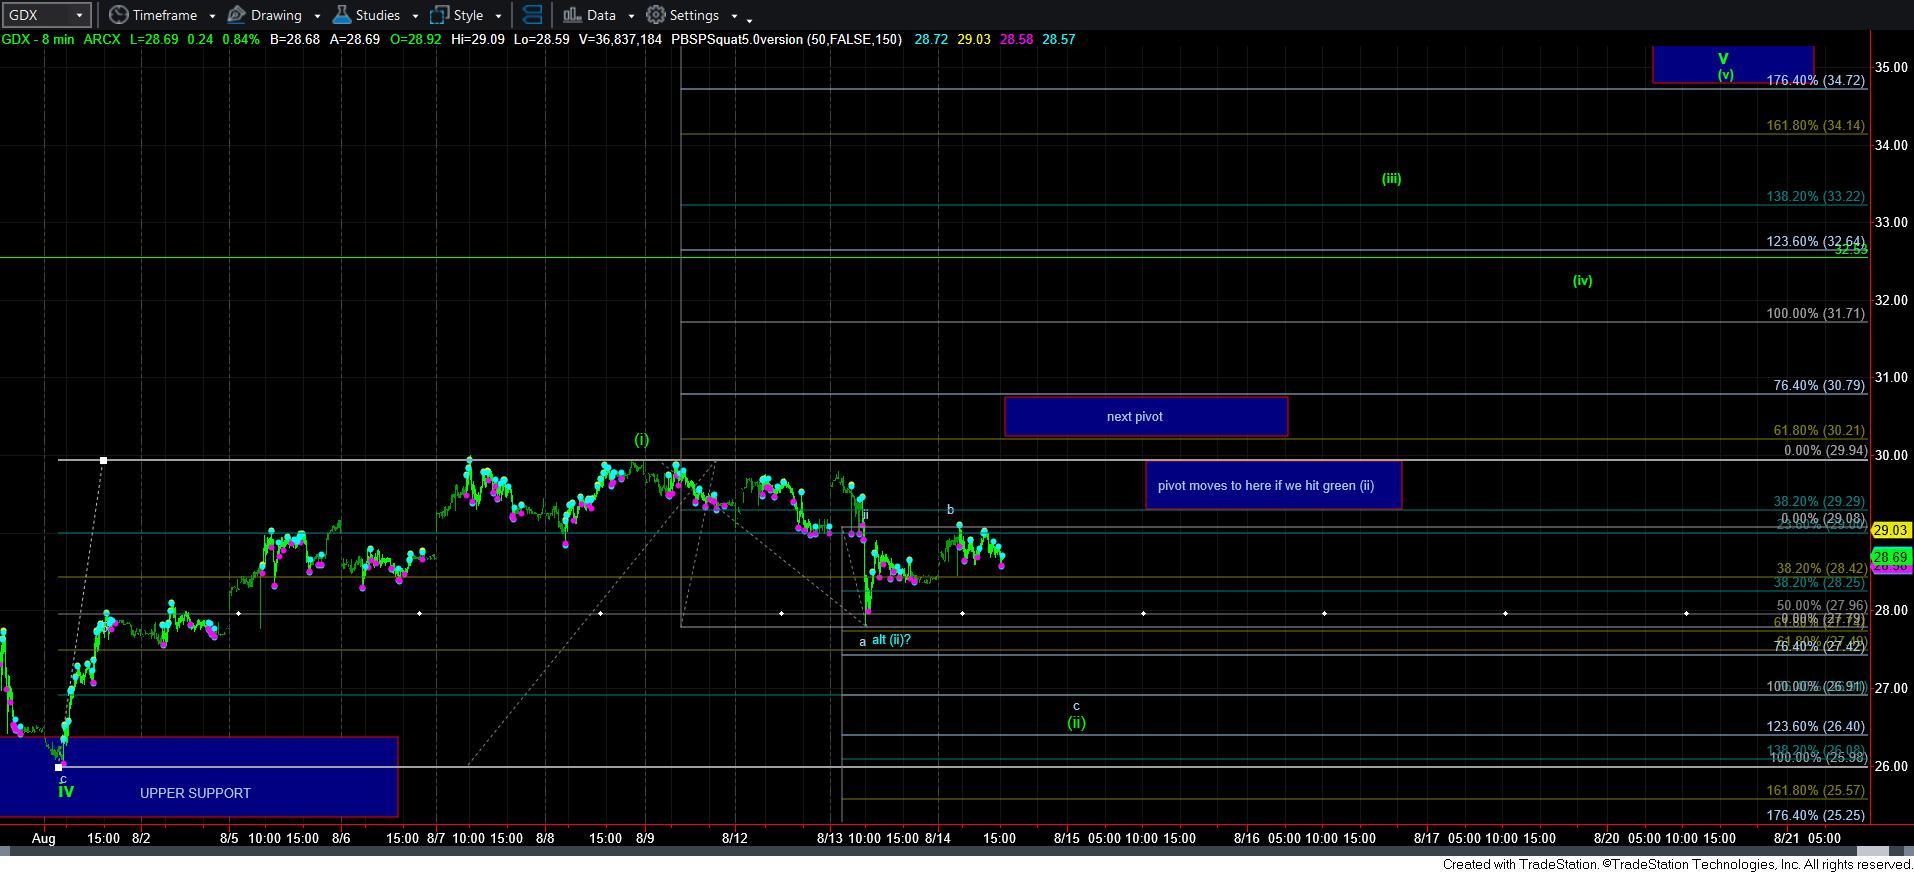
This has led me to the count I have presented on the 5-minute GDX chart. And, this is the chart I will be focusing upon for the next few days. You see, GDX came up short of our targets, which were already minimum targets for what the miners chart normally extends towards. For this reason, I have now had to consider the potential of a (i)(ii) structure within this wave v of (3) – as presented on the 5-minute chart. So, if the GDX is able to hold over the 26.90 level and then turn up strongly into an impulsive structure, it would make me adopt this count.
If you are wondering, the 26.90 region is the .764 retracement of the rally off wave iv, and also is an a=c within this corrective pullback we have been seeing these last few days. While we certainly do not have to go that deep, that is the last line in the sand for me to view the green count as presented on the daily chart.
Should we break that support, then I will be strongly considering the alternative placed on the daily GDX chart in yellow. This would suggest that we only have completed wave i and ii of wave (3), which would project wave (3) alone towards the 44-49 region.
Additionally, I want to note that this drop has begun to make the alternative in red even less likely than it was before. While I will keep it on the chart until we blow through that level in GDX, I am seeing the probabilities for this drop even more at this time.
Now, as far as silver is concerned, I am assuming that if GDX can hold this more bullish micro structure, it will be looking to rally to at least the 18 region. And, as far as GLD is concerned, I would like to see it take us up to at least the 148 region, as it may lag in the next rally – assuming we begin it from this region.
I know that my counts tend towards the bullish benefit of the doubt when it comes to this complex. But, until the market makes this micro structure abundantly clear down here, I am going to always side with the more bullish alternatives. You see, one can always stop out and then buy back at deeper discounted prices if the immediate bullish structure does not materialize. But, if it does, then the train leaves the station without you, and metals trains run at very high speeds. So, please understand the perspectives through which I provide my analysis, as you may disagree with my views and approach. For this reason, I wanted to at least explain my reasoning as to how I view the micro structures.
In the near term, I am going to retain an immediate bullish bias for as long as GDX holds the 26.90 region. I have also added two micro pivots overhead, based upon which GDX may hold support. Keep in mind that in order for me to trade the upside, I need to see the market move strongly through the applicable pivot in impulsive fashion, which can allow me to then get long with a possible aggressive trade using leverage, and place my stop just below the pivot. Should this trigger, we will continue to move support up so we can lock in profits as the market moves higher. But, this is only applicable if the market can hold support and break out through the pivot.
Should we break support, then I will re-assess the smaller degree structure in our weekend analysis.


