High-Level Consolidation or Bull Train Acceleration?
 By
Ricky Wen
By
Ricky Wen
The quarter-end week was fairly methodical as it showcased the classic shake and bake we warned about in the previous weekend KISS report. It was all about the pre-determined overall range 2785 to 2836 (support vs resistance) on the Emini S&P 500 (ES) going into the week.
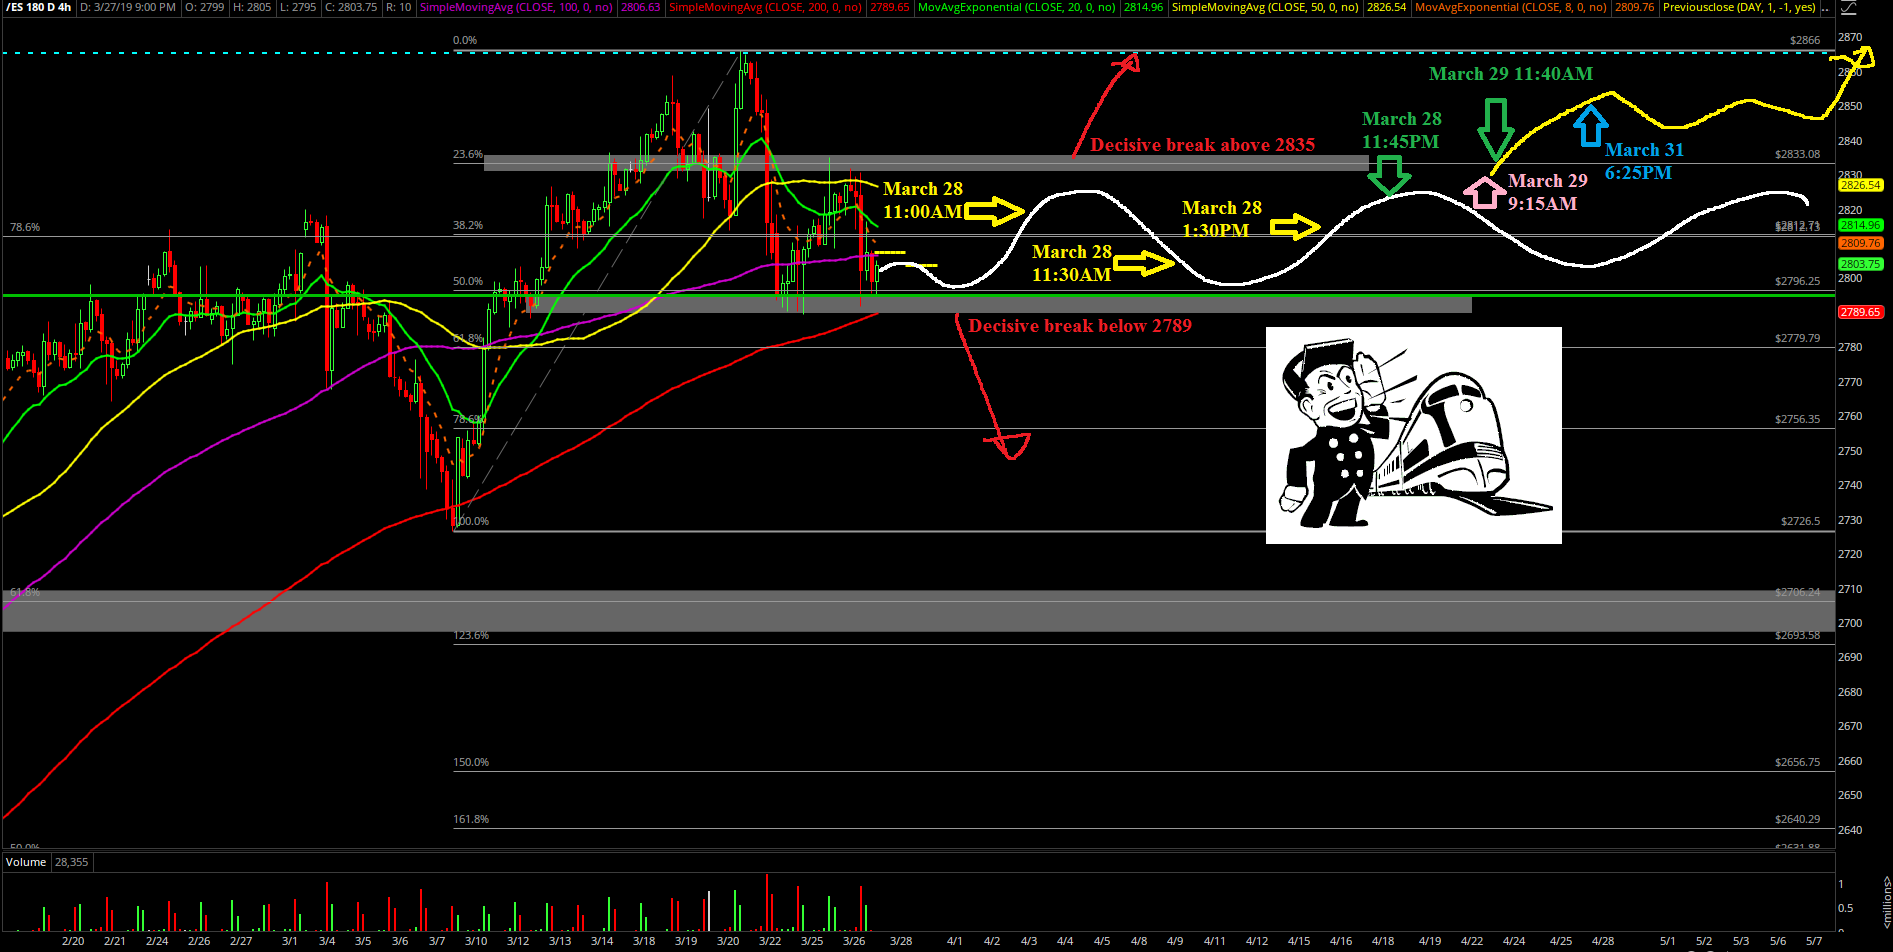
Once Monday and Tuesday followed our 4-hour white line projection perfectly, we knew that we had to be aware that a perfect week potential became very probable. In reality, it was a rangebound bias week that showed its true colors on Friday with the upside breakout of that week’s range at the time 2835-2789.5. We wrapped up the week at the dead highs for the quarter end print just per expectations.
The main takeaway from last week was the market managed to follow our 4-hour white line projection charts perfectly from start to finish since the last weekend report. Basically, the bears died from a thousand cuts and the climax came on Friday morning to confirm that they were going to get squeezed.
The bull train stick-saved at the daily 20EMA as expected as bears failed their March 22 massive bear engulf continuation setup. Also, the smaller timeframes are all aligning perfectly with the higher timeframes into a single direction like it’s déjà vu all over again. If you don’t recall the déjà vu pattern: grind higher, consolidate/bull flag/high level consolidation, eventually breakout higher again. The billion dollar question now will be do we get a new all-time high during Q2 or do we need more high-level consolidation?
What’s next?
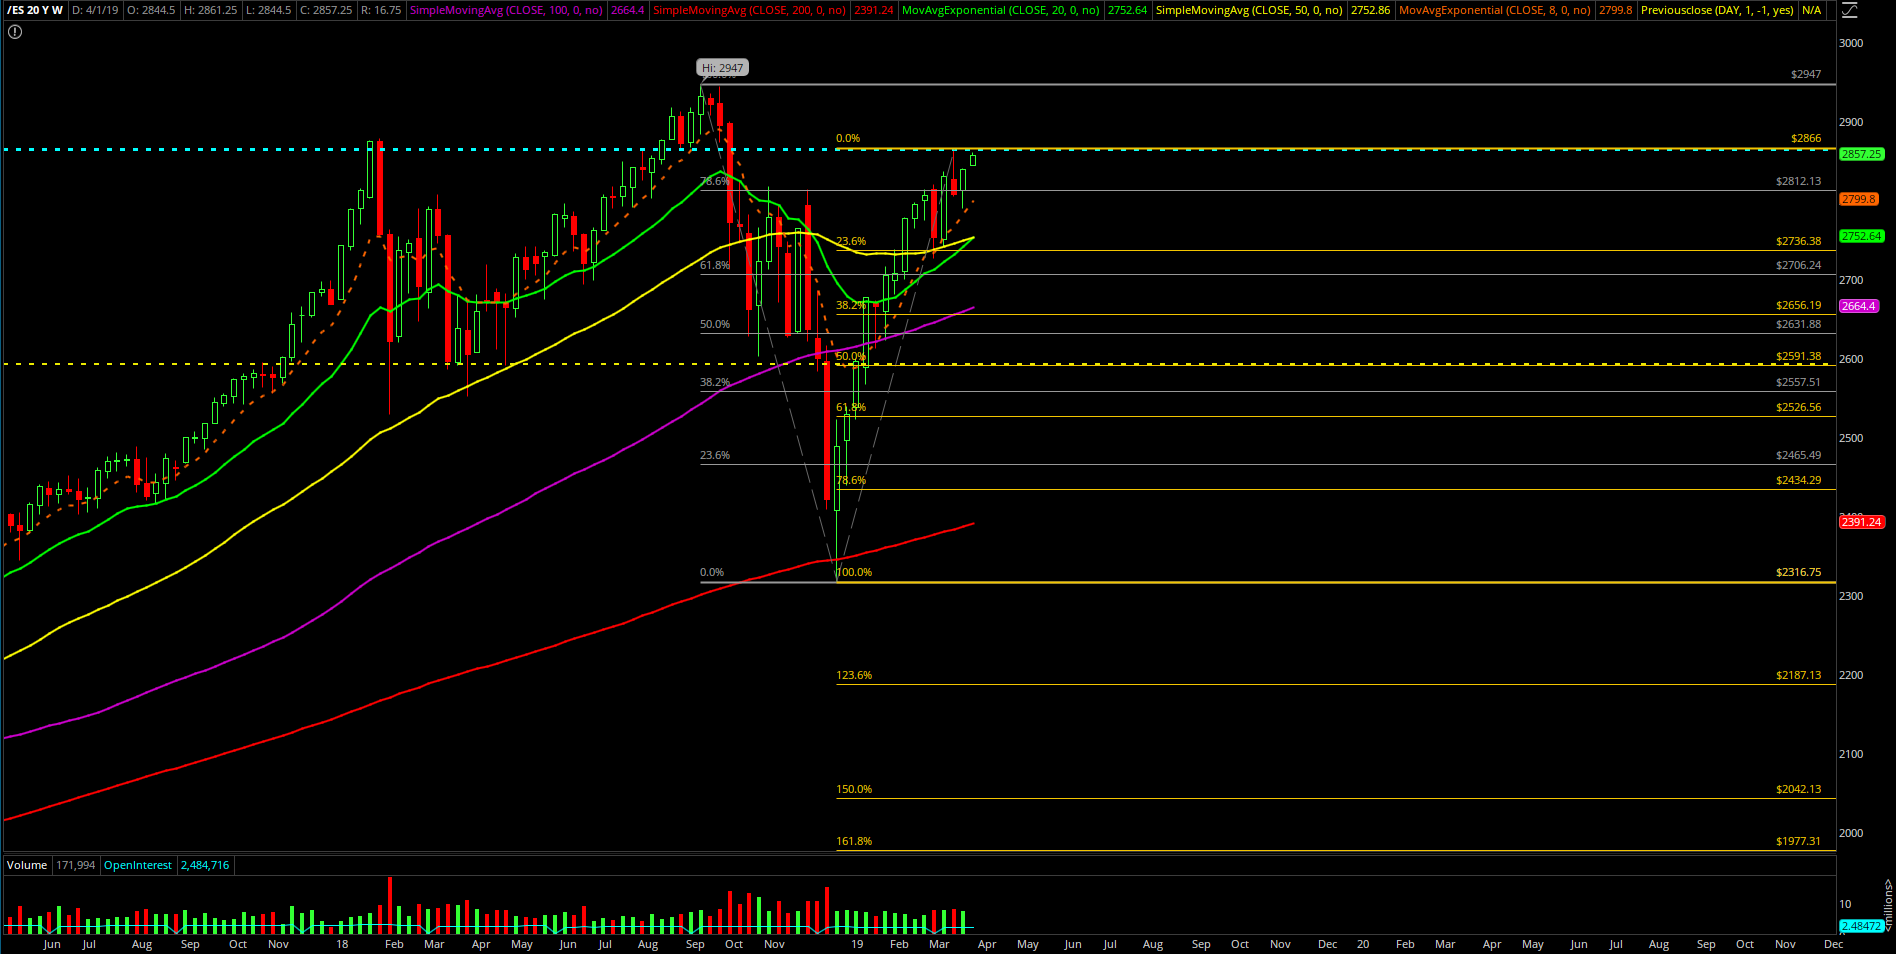
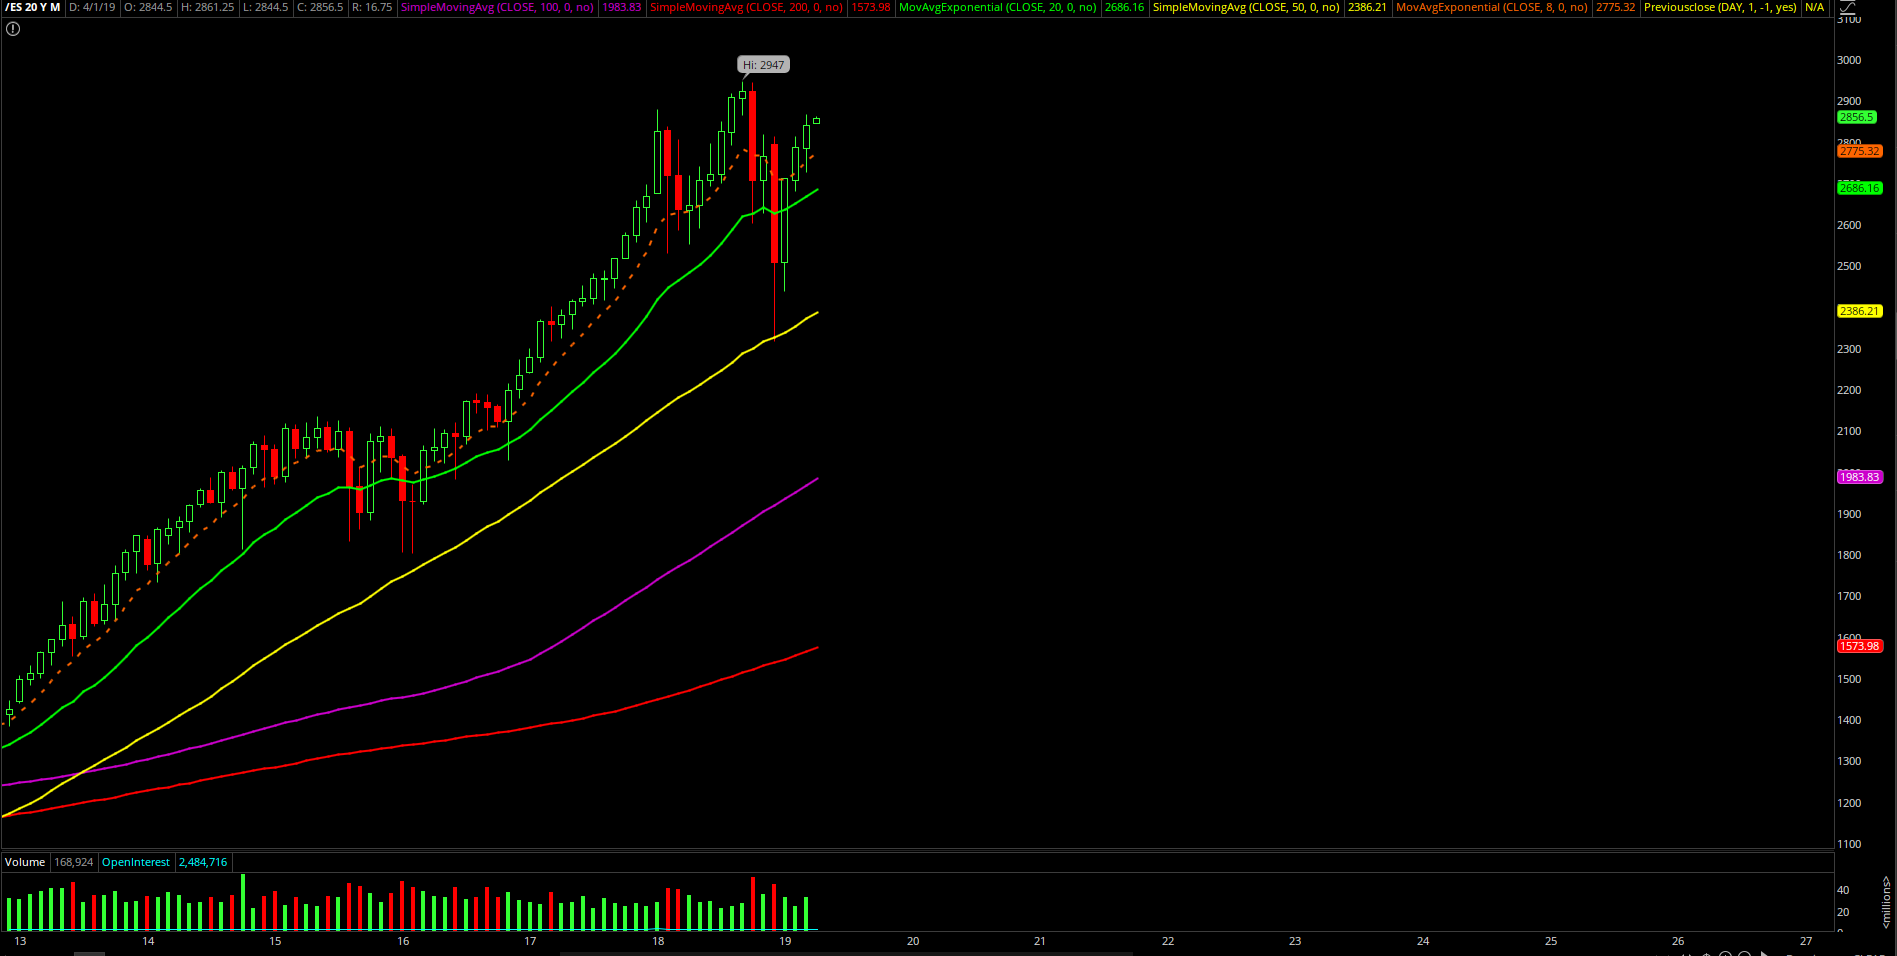
Friday closed at 2839.5 at the dead highs of the week so it was a nice daily bull bar continuation upside off the week’s bottom stick-save vs daily 20EMA support area. It goes without saying the weekly, monthly, quarterly closing prices closed around the dead highs of their respective timeframe. This is very important because we have now retraced decisively above 78.6% of the 2947-2316.75 range.This also means that we need to be aware of the next new all time highs breakout given the end of December V-shaped bottom from 2316.75 into 286x current highs.
Current parameters/bias:
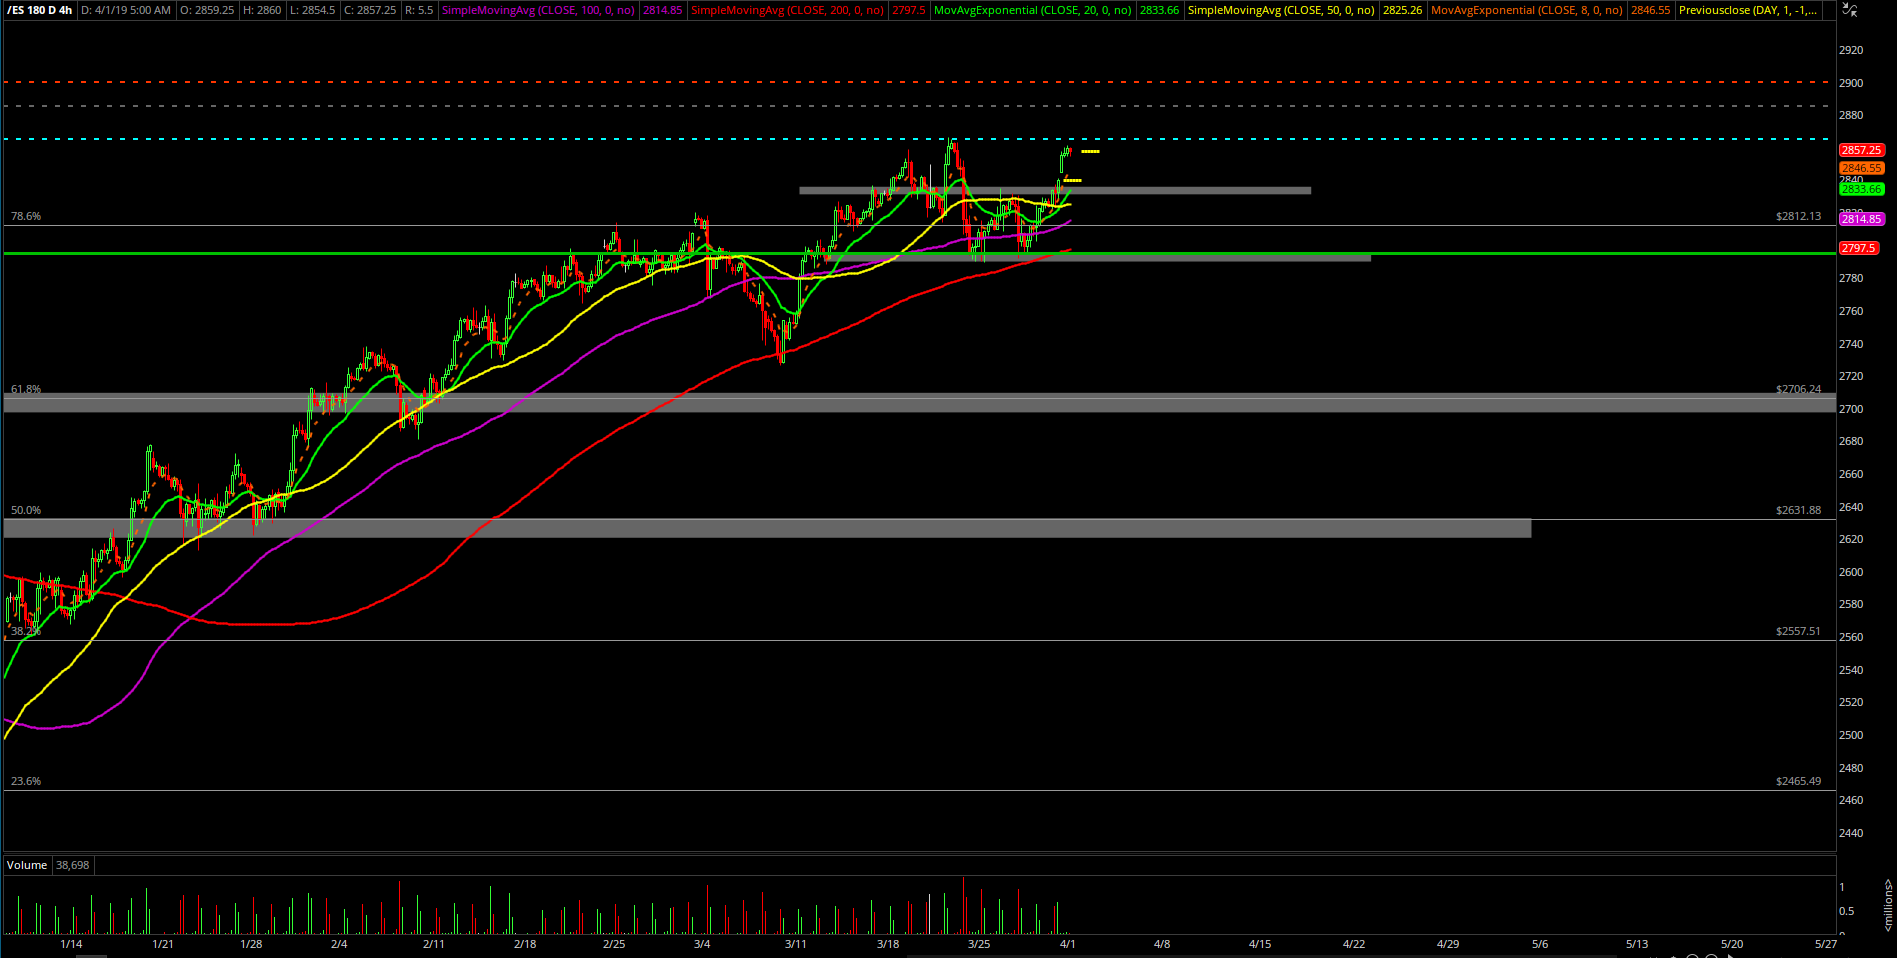
For now, the 4-hour white line projection from last week remains king. The market is respecting and following the accelerated yellow line showcasing the Friday morning immediate breakout perfectly for now as long as 2830 support holds. In a bull train acceleration setting, you already know there are only two permutations really given the momentum leverage of the institutional money and the vicious cycle of feedback loop squeeze of bears getting clobbered up. It’s either the classic high-level consolidation then a higher high or it’s immediately straight up with very shallow.
Zooming in a little, the Sunday night low at 2844 will act as the first immediate trending support given the overnight high level consolidation grind up. This means we have 2844/2830 will act as our immediate key trending supports heading into this week. Any dips above these numbers are considered BTFD opportunities until the train heads into 2866/2900 continuation targets. Basically, need to hit 2866 then 2900 becomes the next high probability target as trending supports move up again, rinse and repeat.
Clear and concise context for April and going forward:
Treat as daily 8/20EMA bull train, but in more of an immediate bullish state because the market/momentum is back in a grind up/breakout acceleration phase. Last week the bears failed the March 22nd continuation downside setup on breaking below the daily 20EMA as expected so now they are getting squeezed and clobbered up. There should be a lot of stops just above the March highs across the indices so we must be aware of that too.
Price action has retraced decisively above 78.6% of the ATH 2947-2316.75 range which represented around a 20% drop of the broad market. We aware and be on the focus for the new all time highs later this year. The real question is when? New ATH occurs during Q2 2019 or later? We don’t know yet but the answer to that question is simple with a simple parameter; is it a daily 20EMA train still with weekly/monthly charts aligning up? If it is, we will just keep grinding higher like clockwork and follow textbook rules. If we don’t, then you already know the short-term immediate trending pressure is off and it’s time to flip or be neutral and trade the level by level approach.