Healthy Consolidation For Now
 By
Ricky Wen
By
Ricky Wen
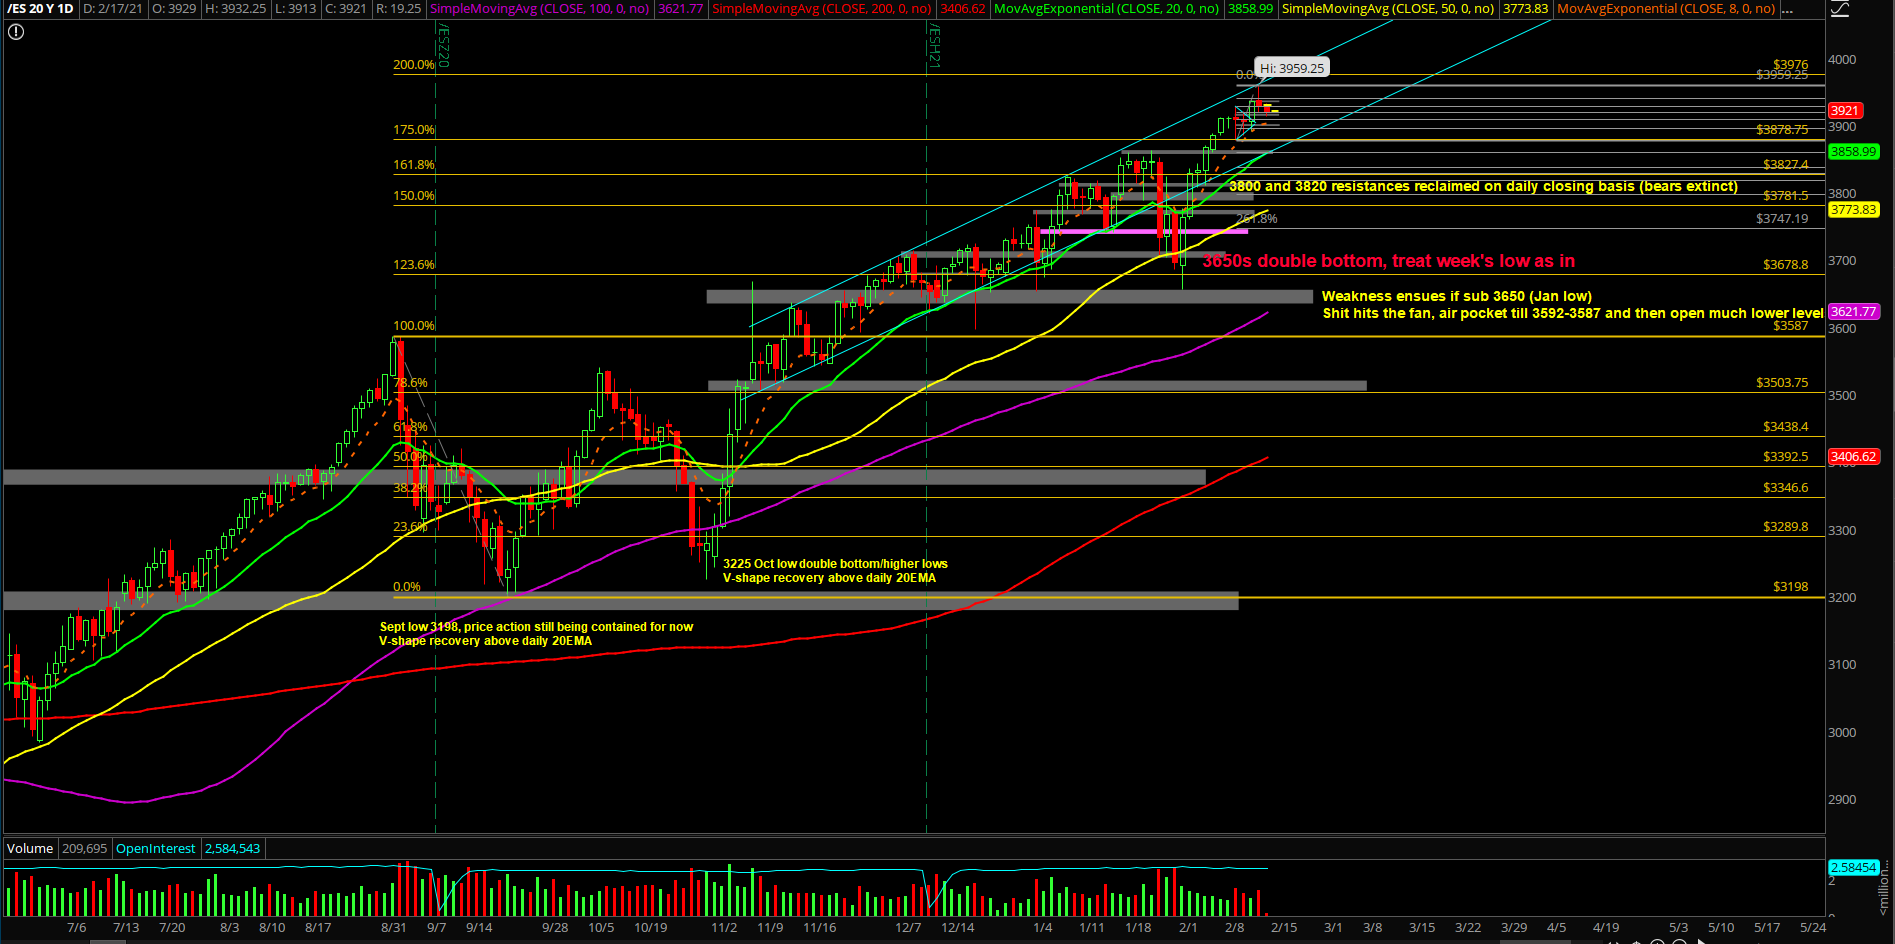
Tuesday’s session played out as a rangebound day as expected given the 3950s temporary high on the Emini S&P 500 (ES). If you recall, it’s been a quick +8% run from the 3650s to 3950s within a span of 2 weeks. In addition, price action got rejected at the multi-month uptrend channel from November 2020, so this is being treated as a typical/normal consolidation pattern for now.
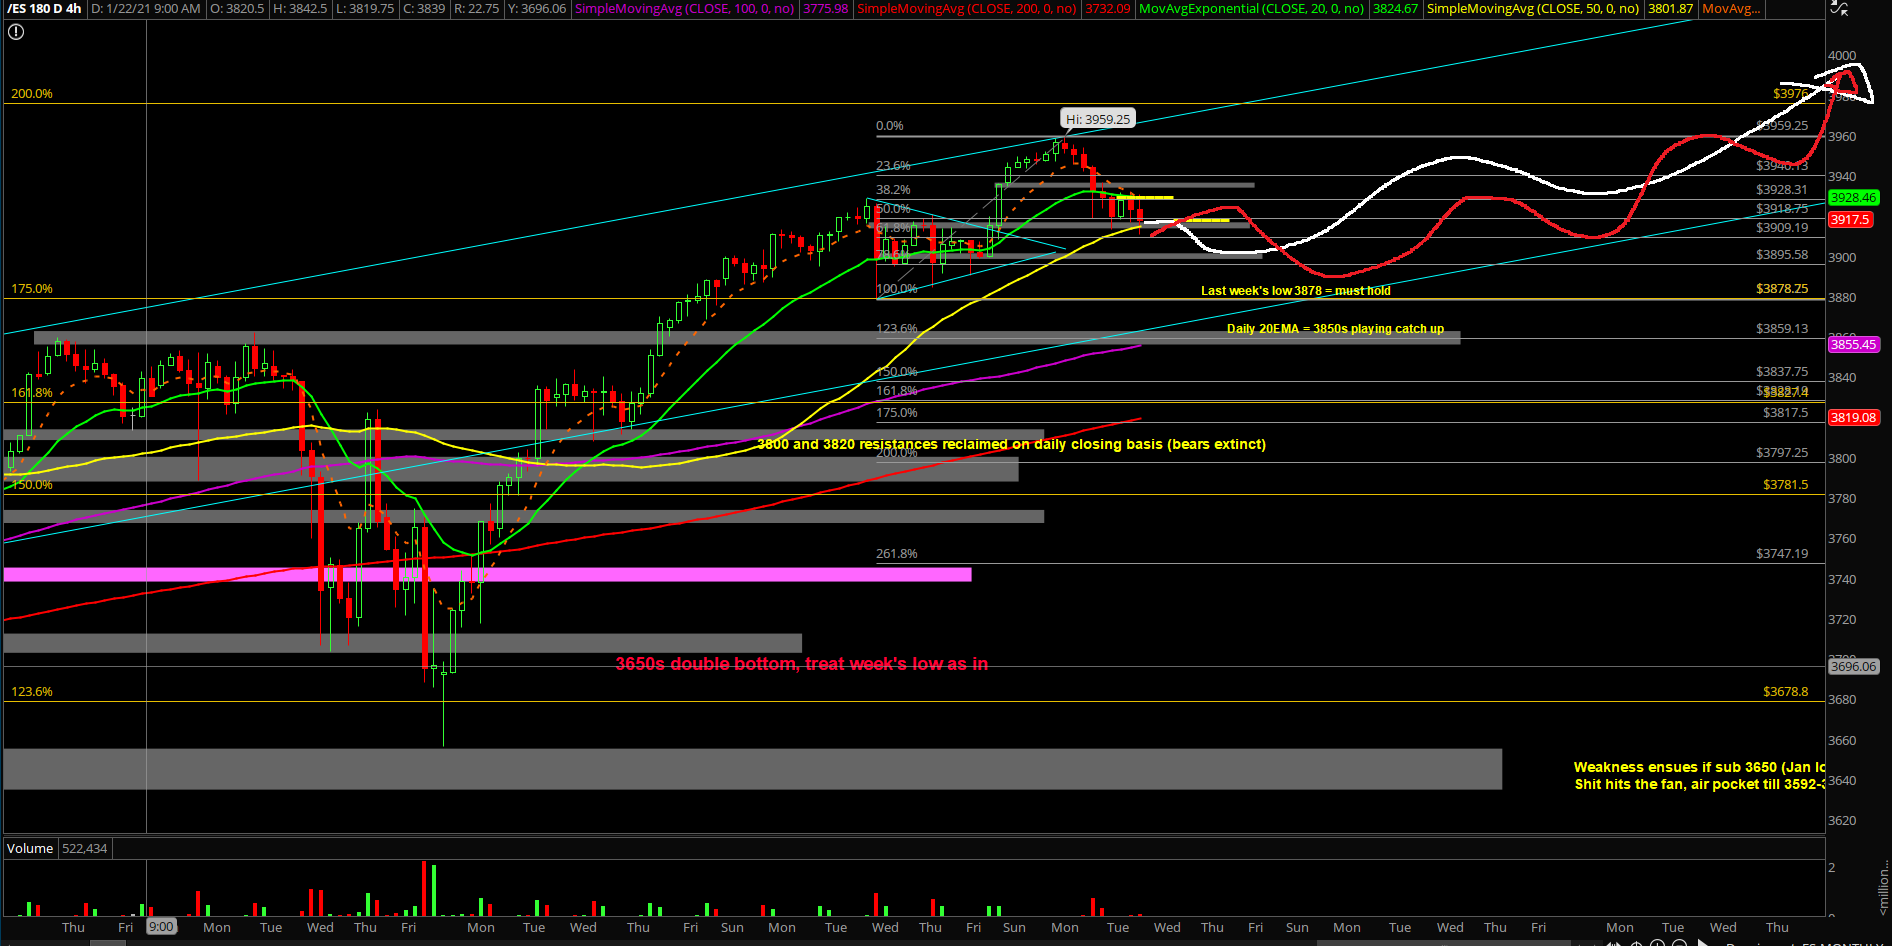
The main takeaway is that this 1-3 day consolidation must keep holding above last week’s low of 3878 in order to confirm that short-term momentum is not weakening too much. Price action is just trying to find the next higher lows setup on the daily/weekly basis in order to ramp again given the context of the bull train. However, if support starts going, then it’s going to brake check everyone on the train and that’s when the carnage could begin. For now, focus on dip opportunities vs our key trending support levels.
What’s next?
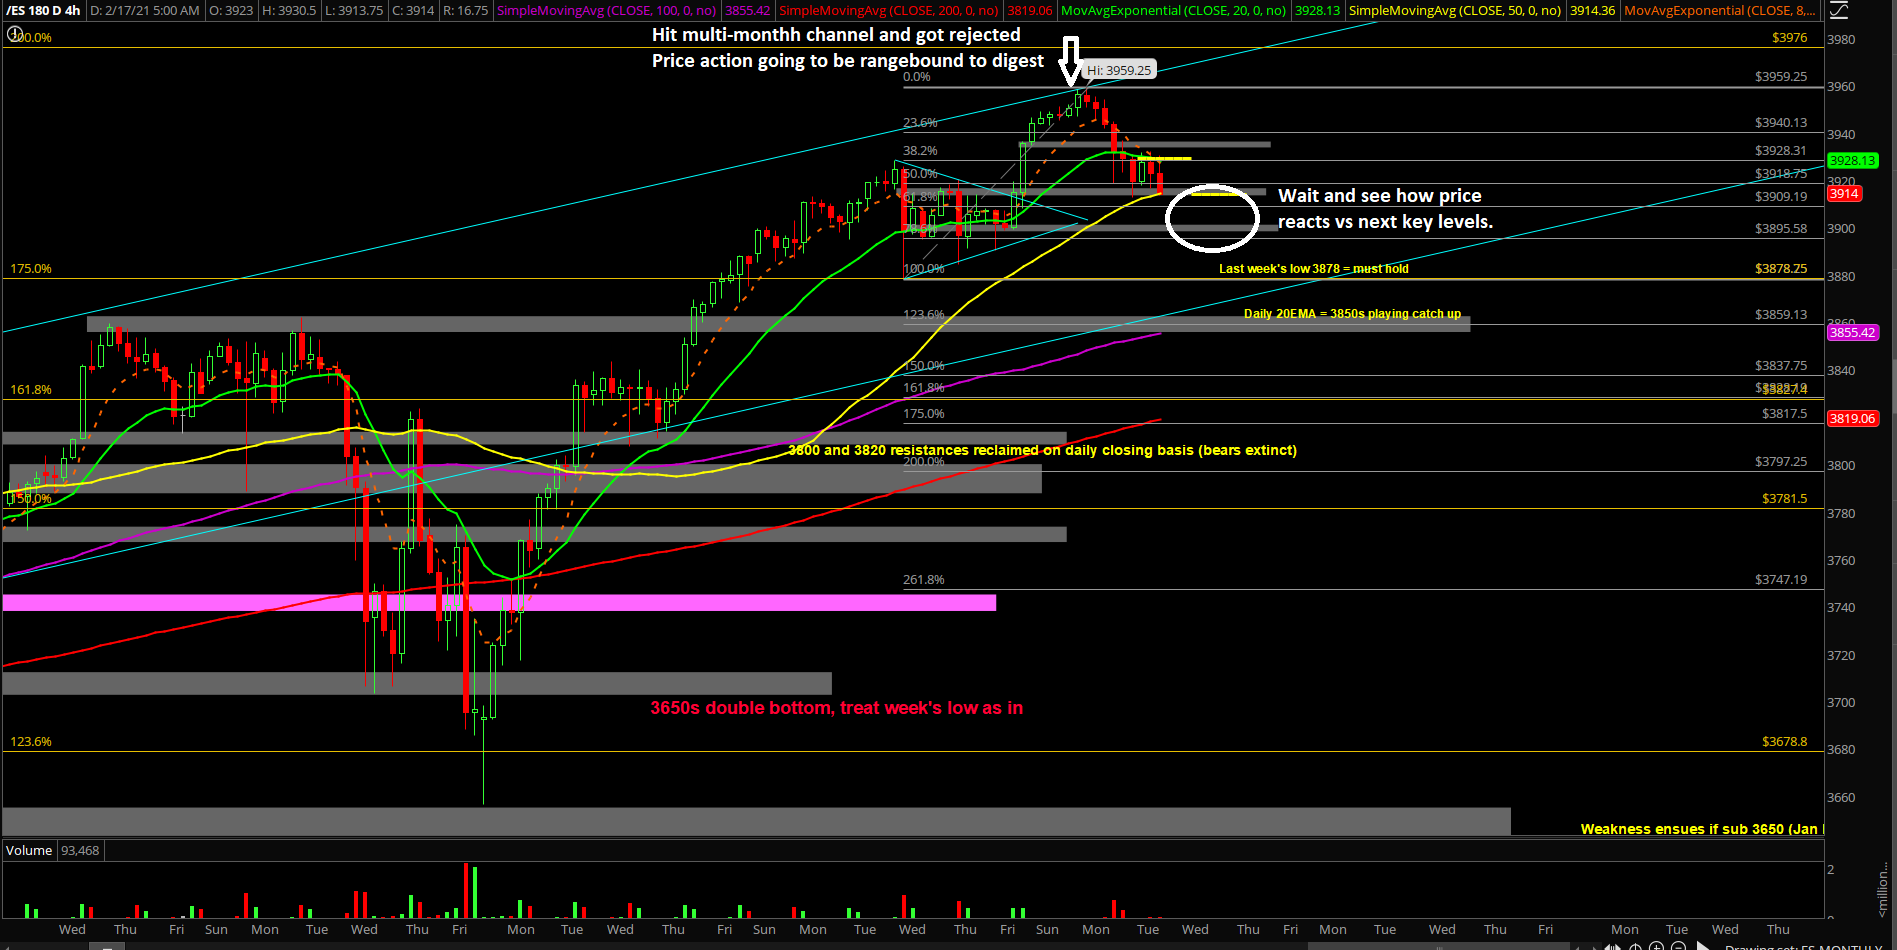
Tuesday closed at 3929.25 on the ES as a doji indicating indecisive/digestion. We expect another range day today as price action tries to discover the next higher lows setup when above support.
Summary of our analysis and game plan:
- Price action hit a temporary high of 3959.25 as it got rejected vs the multi-month uptrend channel in order to consolidate/digest a bit first before reattempting higher highs.
- We’re again expecting some sort of horizontal/range day as price likely needs some sort of digestion again before it could ramp higher.
- Overall range could be 3885-3950s or a tighter range of 3900s-3950s for the next 1-2 days.
- Today, the we’re watching the reaction vs 3913/3900/3885 for rangebound dip opportunities.
- The must hold support for this week is located at 3878, which was last week’s low. Meaning dips are still being treated as buyable opportunities when above this support. FYI, daily 20EMA = 3850s for reference and playing catching up with the market.
- Please see our 4hr primary white line vs alternative red line price projections as visual aid.
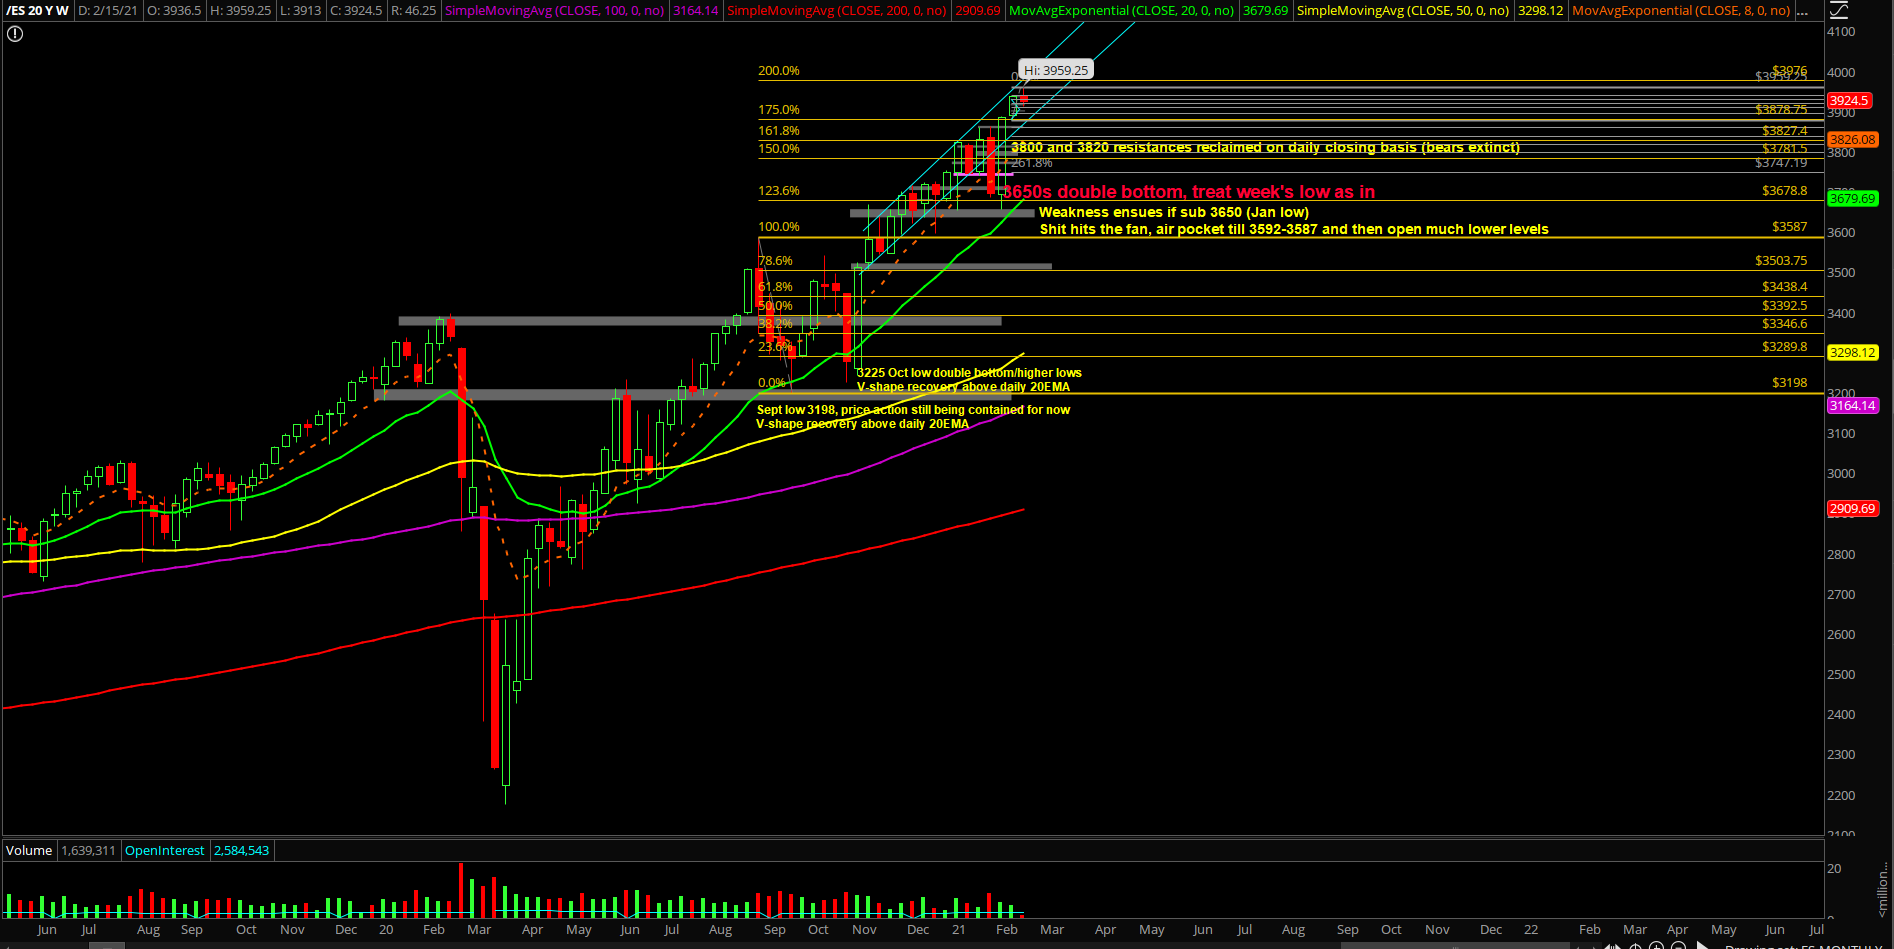
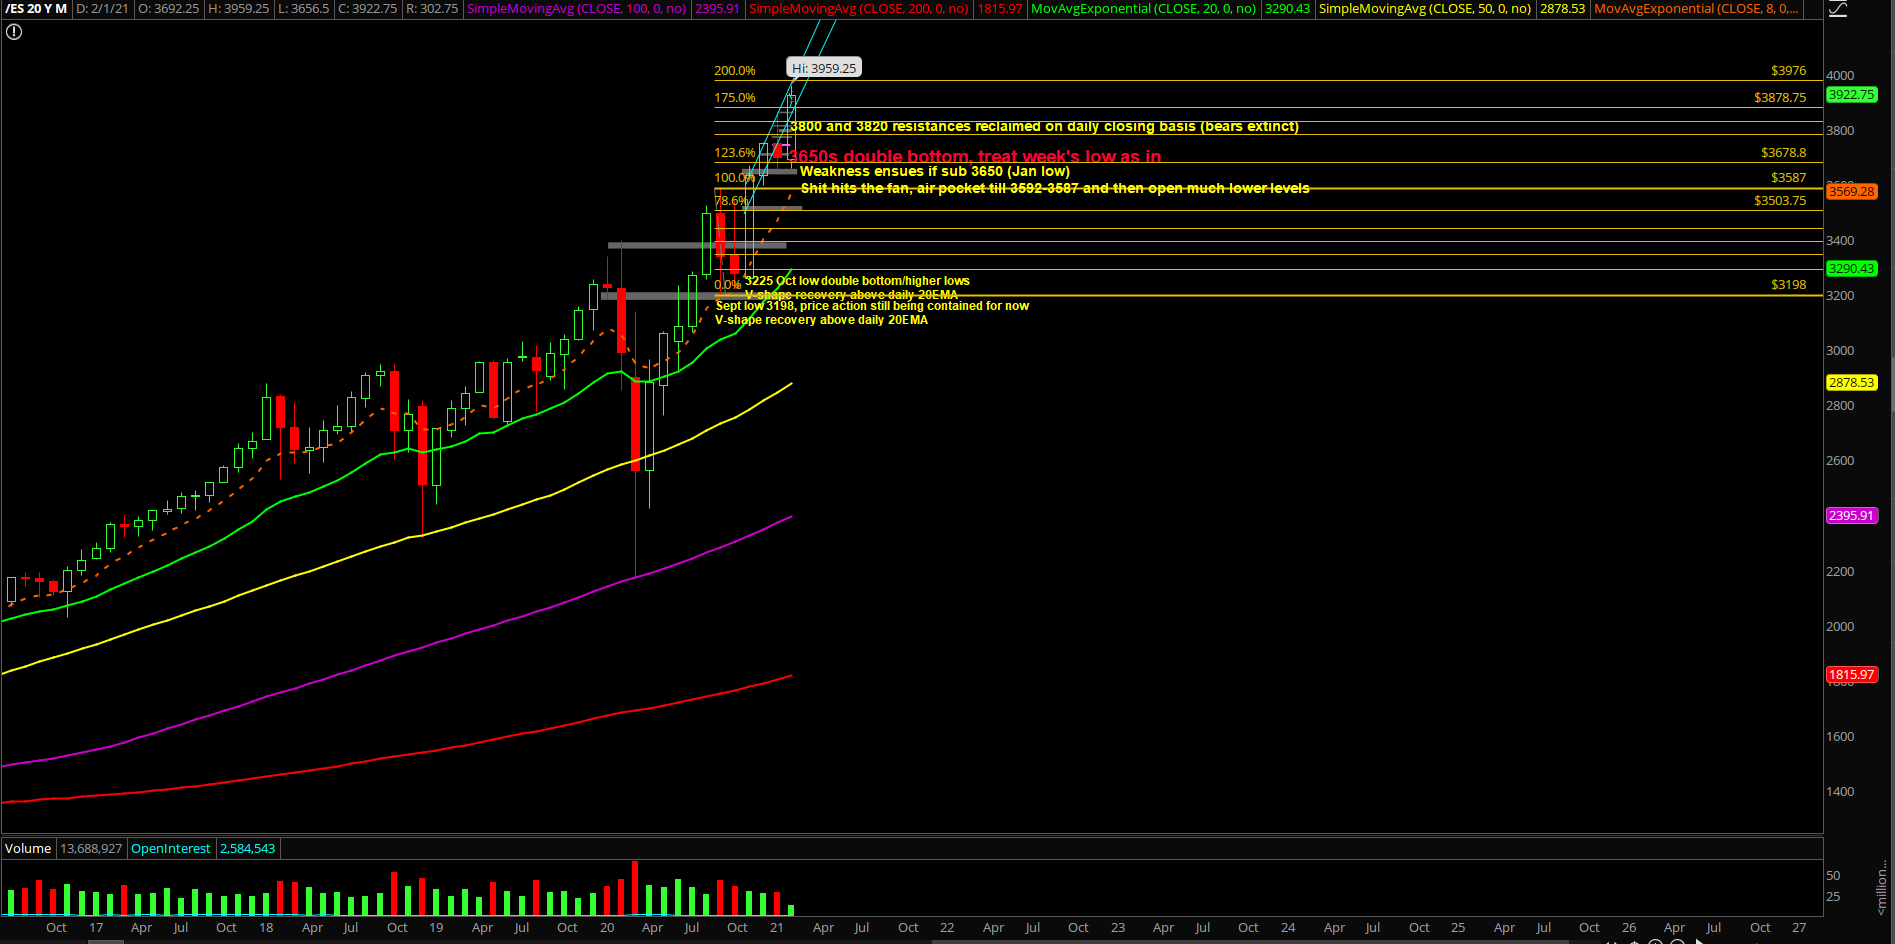
Bulls remain in full control on the higher timeframes:
- The past two weeks produced +8% so some healthy digestion/consolidation is not out of the question. Basically, price went from backtesting the 2 std lows (3650s) to V-shape recovery into new 2 std highs (3950s) on the daily chart. Obviously, this is not the spot to bet the farm after +8% as price action has also hit the multi-month uptrend channel from November 2020. Hedge accordingly vs key levels/confluence if you’re one of the folks running an uber bullish portfolio like us (eg. we demonstrated in real-time how you could hedge during Wednesday Feb 10 with little initial risk using our key levels + alerts in our ES room)
- Bigger picture wise, the first week of Feb’s massive bull engulf candle could act as the ongoing monthly low (3657s) for the foreseeable future as the rest of this month continues to make higher lows and higher highs on the daily/weekly timeframes. Know your timeframes!