Has VXX Struck A Bottom?
 By
By
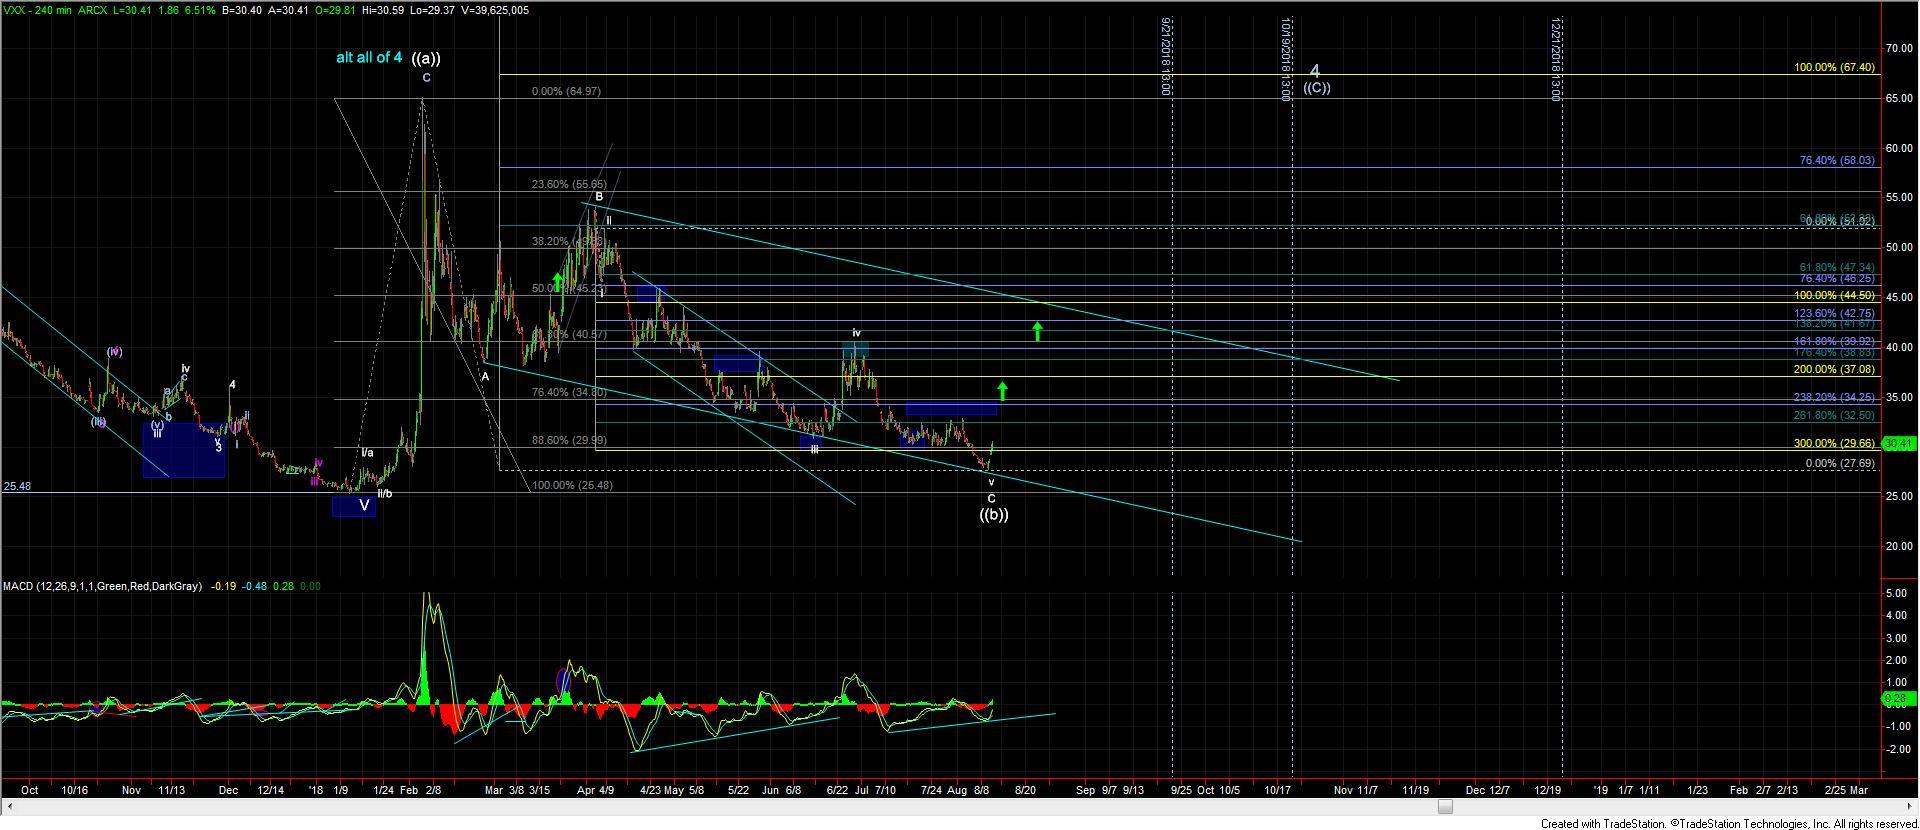
On August 9th the VXX hit and held the larger 238.2 Fibonacci extension that was located right at the 27.85 level. A move into this level gave us what I can count as a completed abc pattern down off of the February highs down to the most micro of degrees. Furthermore, we now have what I can count as a full five wave move up off of that August 9th low, and we have broken the micro resistance level previously located at the 30.15 level.
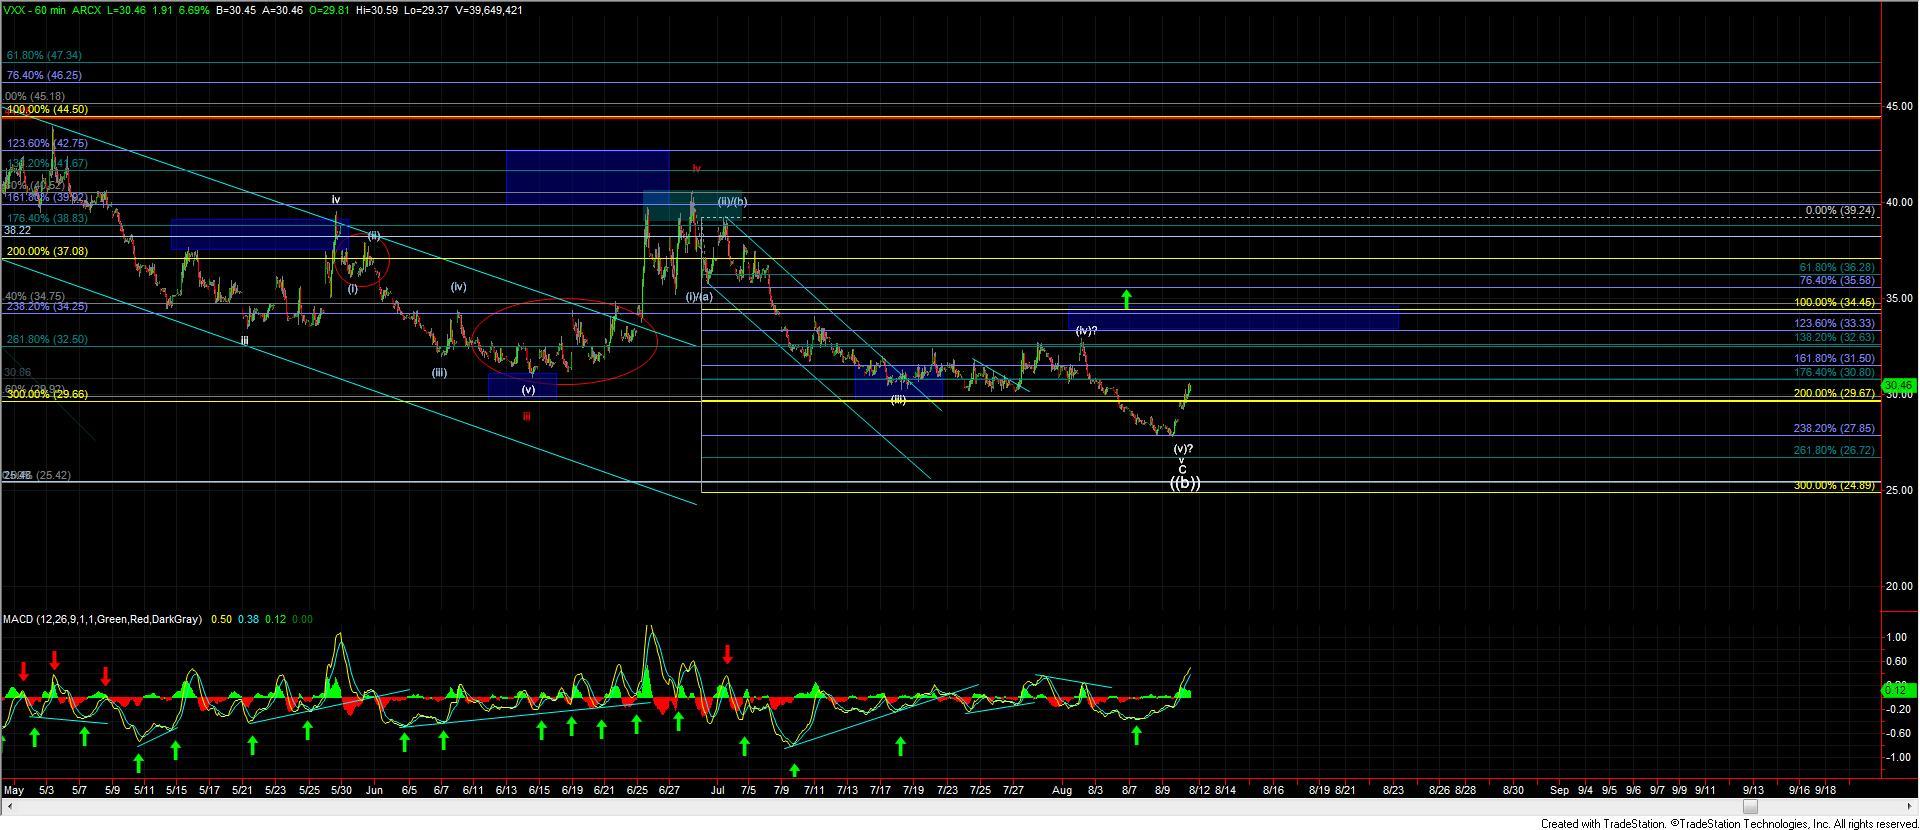
This is now giving us an initial signal that we may have struck a larger degree bottom for a wave ((b)) on the VXX. We do, however, still need to see a five wave move of one larger degree and/or a break of the 33.33-34.45 zone to give us further confirmation that we have struck this larger degree bottom rather than just a local low.
In either case, however, with what I can now count as a fairly clean five wave move up off of the low, I think it is likely that we will see further upside in the next week or two. Ideally, I would prefer to see a corrective retrace back down towards the 29.52-28.44 zone. A move back down into that zone would provide a very nice setup to attempt further trades to the long side on the VXX as we would now have a clearly defined setup invalidation point at the 27.77 low.
So while we may have some more work to do before confirming a bottom and there are no guarantees in trading this is about as clean of a setup as we can ask for with clearly defined parameters and I certainly plan on taking advantage of it.