Has The Bull Market Returned?
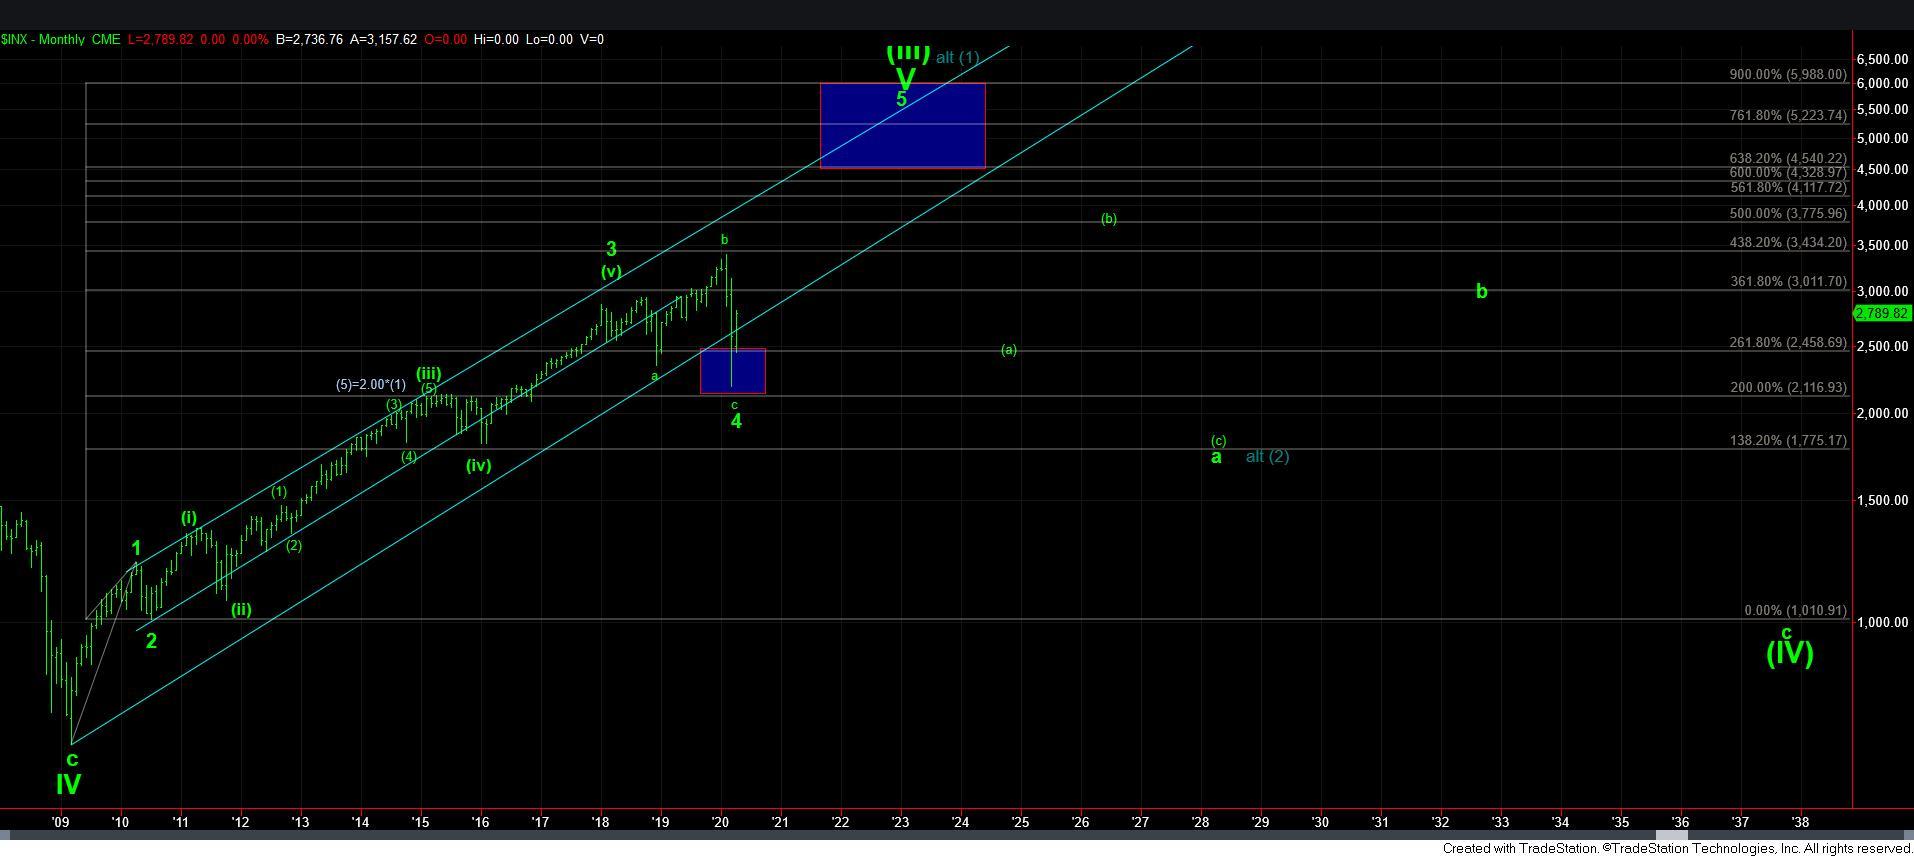
I know it sounds so impossible when you try to reason regarding this market action, but we may have begun the run to 4000+. When you consider the unemployment numbers we are seeing, along with all the fears of impending bankruptcies (and the US has not even opened the economy back up yet), can we even consider something so crazy?
On the other hand, consider how each time we get record jobless claims, the market has seen strong rallies. Do you really think following the news cycle is an appropriate path to take with regard to market action?
And, for those that argue that the Fed has been pushing us higher and you cannot fight the Fed, I would strongly urge you to reconsider your perspective. Remember how we were looking to the long side in the TLT back in November 2018 while the Fed was still raising rates? And, just weeks ago, each Fed action was met with continued selling.
It is amazing how soon we forget our market history. I think the more accurate perspective would be to not fight the Fed when the market is in an uptrend. But, does that really provide you with any real guidance?
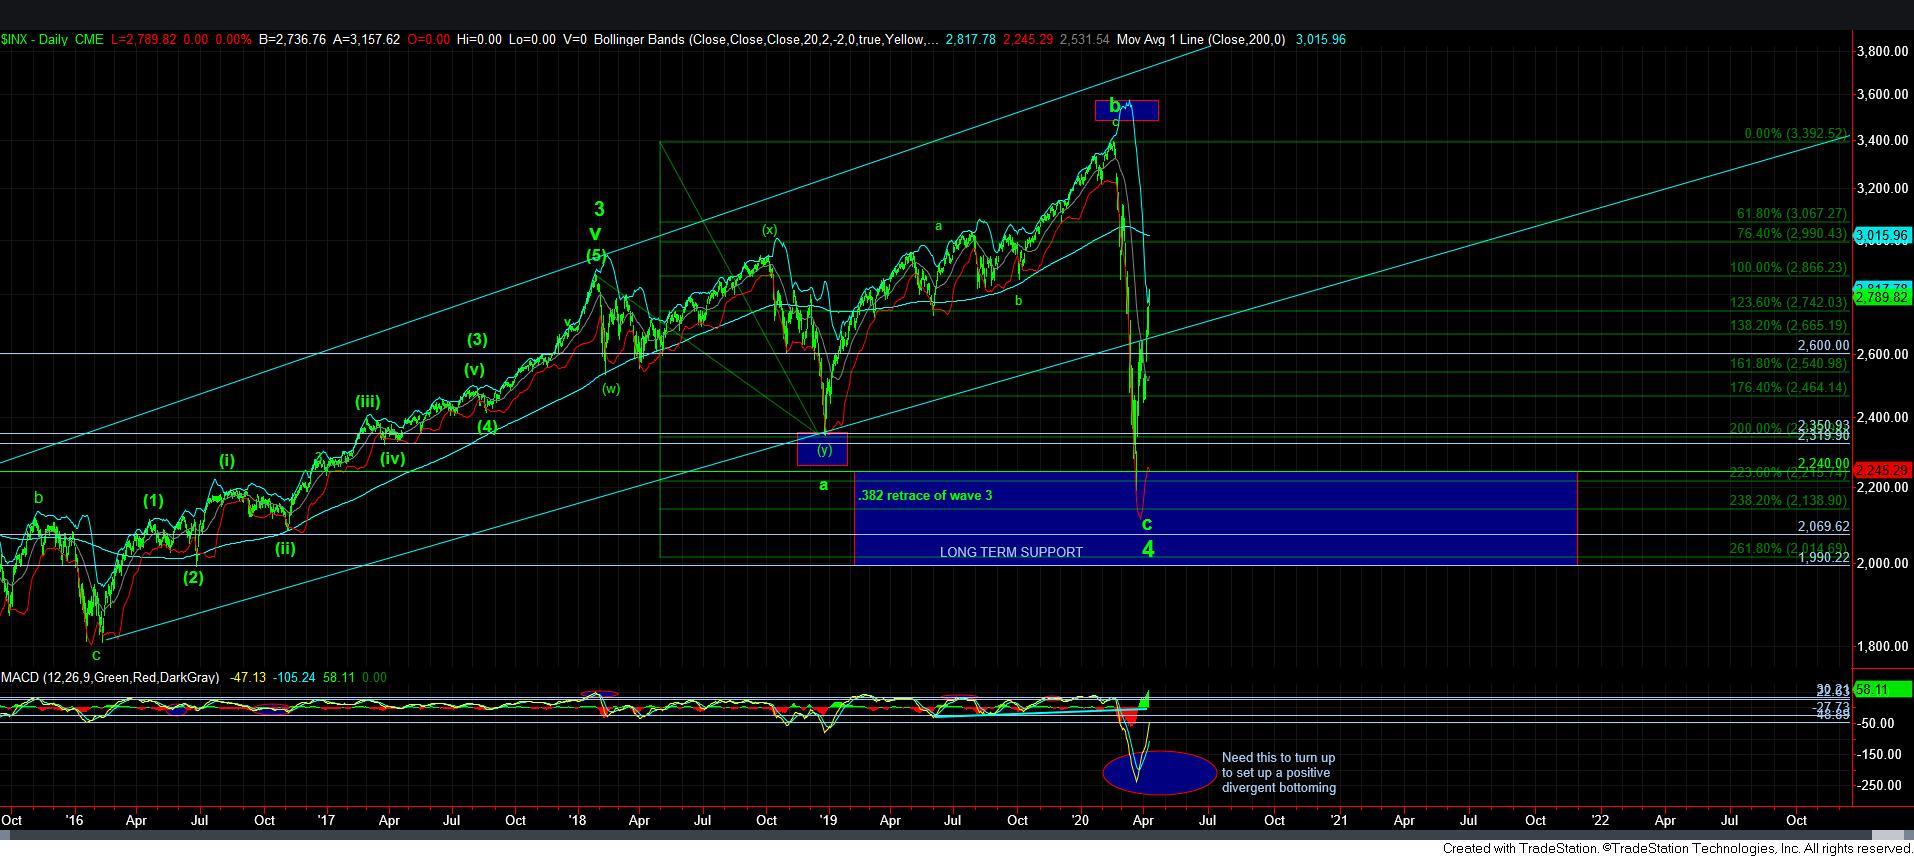
As we were looking for the market to bottom out in the 2187SPX region, whereas most others at the time were looking for continuation moves below 2000, we now know that the actual low struck was 2191 and was within 4 points of our support down there. We then began to look for a rally to the 2600-2725SPX region from that low. While my initial expectation was that the rally to that region would be a 4th wave, thus far, the market has been doing everything right to prove the bottom may be in place already.
As I noted last weekend, if the market was able to break out early in the week, it would go a long way to begin proving the bottom is in place. And due to the structure off the lows, I have to now give the bulls the benefit of the doubt, as I outlined in my updates this past week. But, that does not mean I have not retained my own doubts. So, allow me to explain to you how those doubts get resolved.
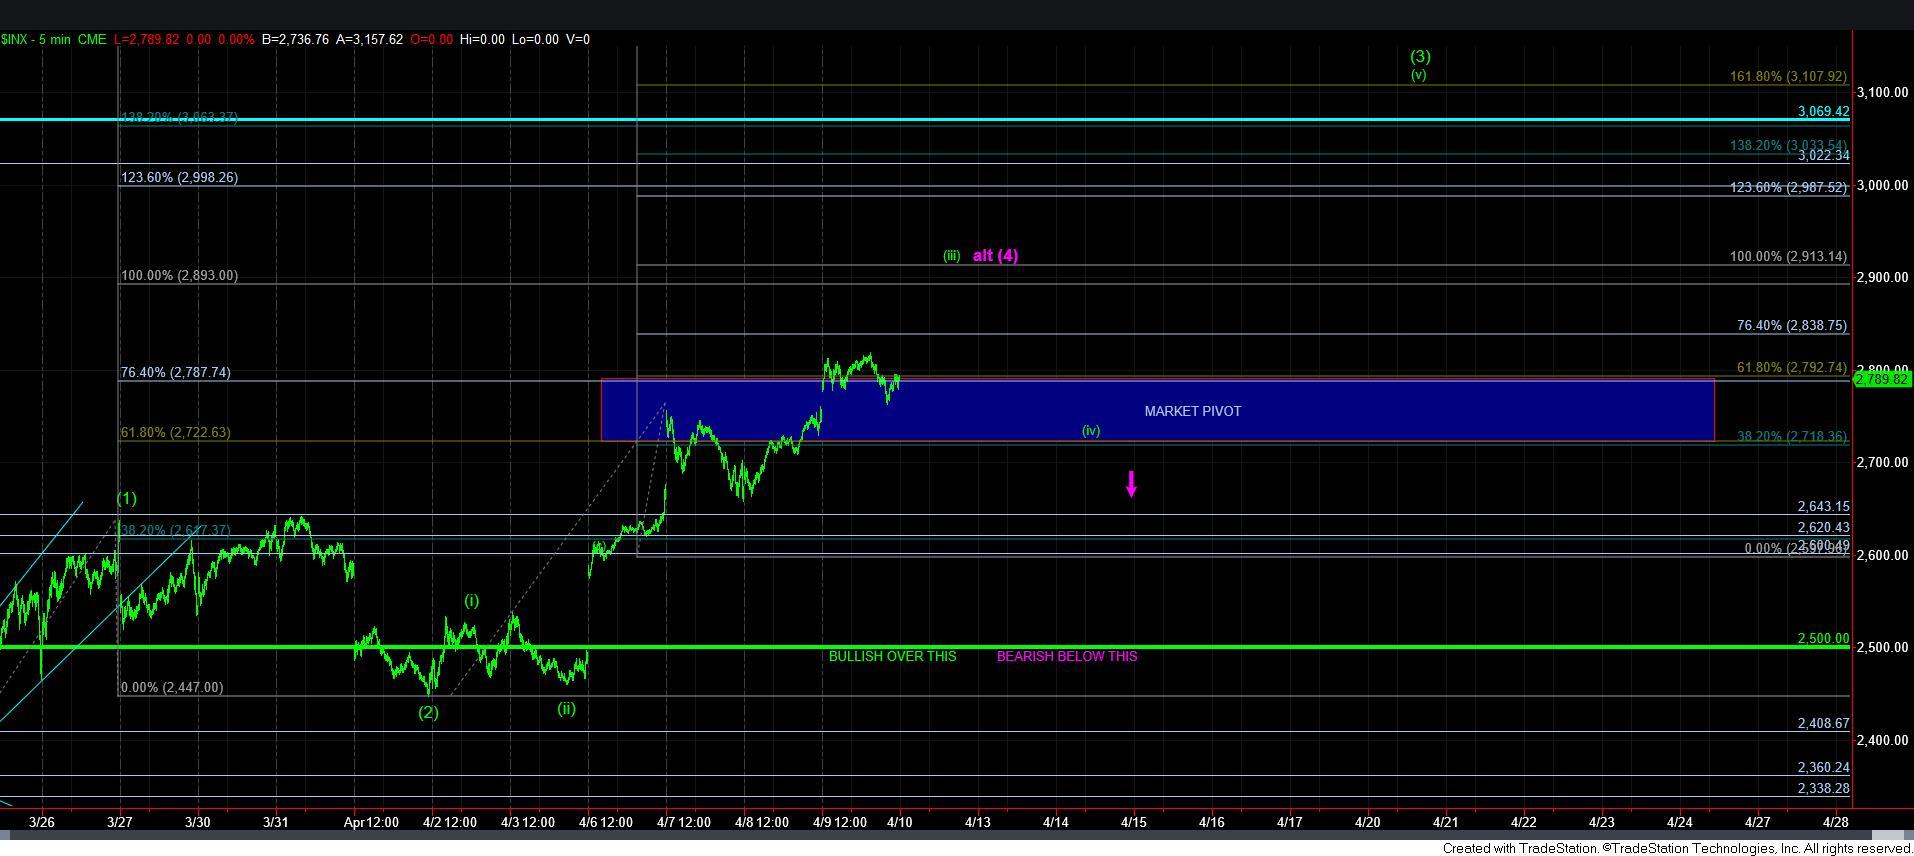
Based upon the structure we have seen into the end of the week, it would seem that the SPX is moving directly towards the 1.00 extension (2890) off the recent lows. For those with a bullish bias, you would be counting this as wave [iii] of [3] in wave i of 5 off the recent lows. However, those with a bearish bias would be counting this as an a-b-c rally into the a=c target in the 2890 region before heading down to the 2060 region for that lower low to complete the c-wave of primary wave 4.
So, how will we know the difference?
This is where Fibonacci Pinball comes in for guidance. In a bullish trend, wave [iii] of [3] often targets the 1.00-1.236 extensions of waves [1] and [2]. Thereafter, we see wave [iv] of [3] pullback to the .618-.764 extension of waves [1] and [2]. As long as that support region holds, the market then continues to the 1.382-1.618 extension region for wave [v] of [3]. However, if we break down below the .618 extension in this structure, it is an early warning sign that the rally was only an a-b-c corrective rally (as outlined in purple).
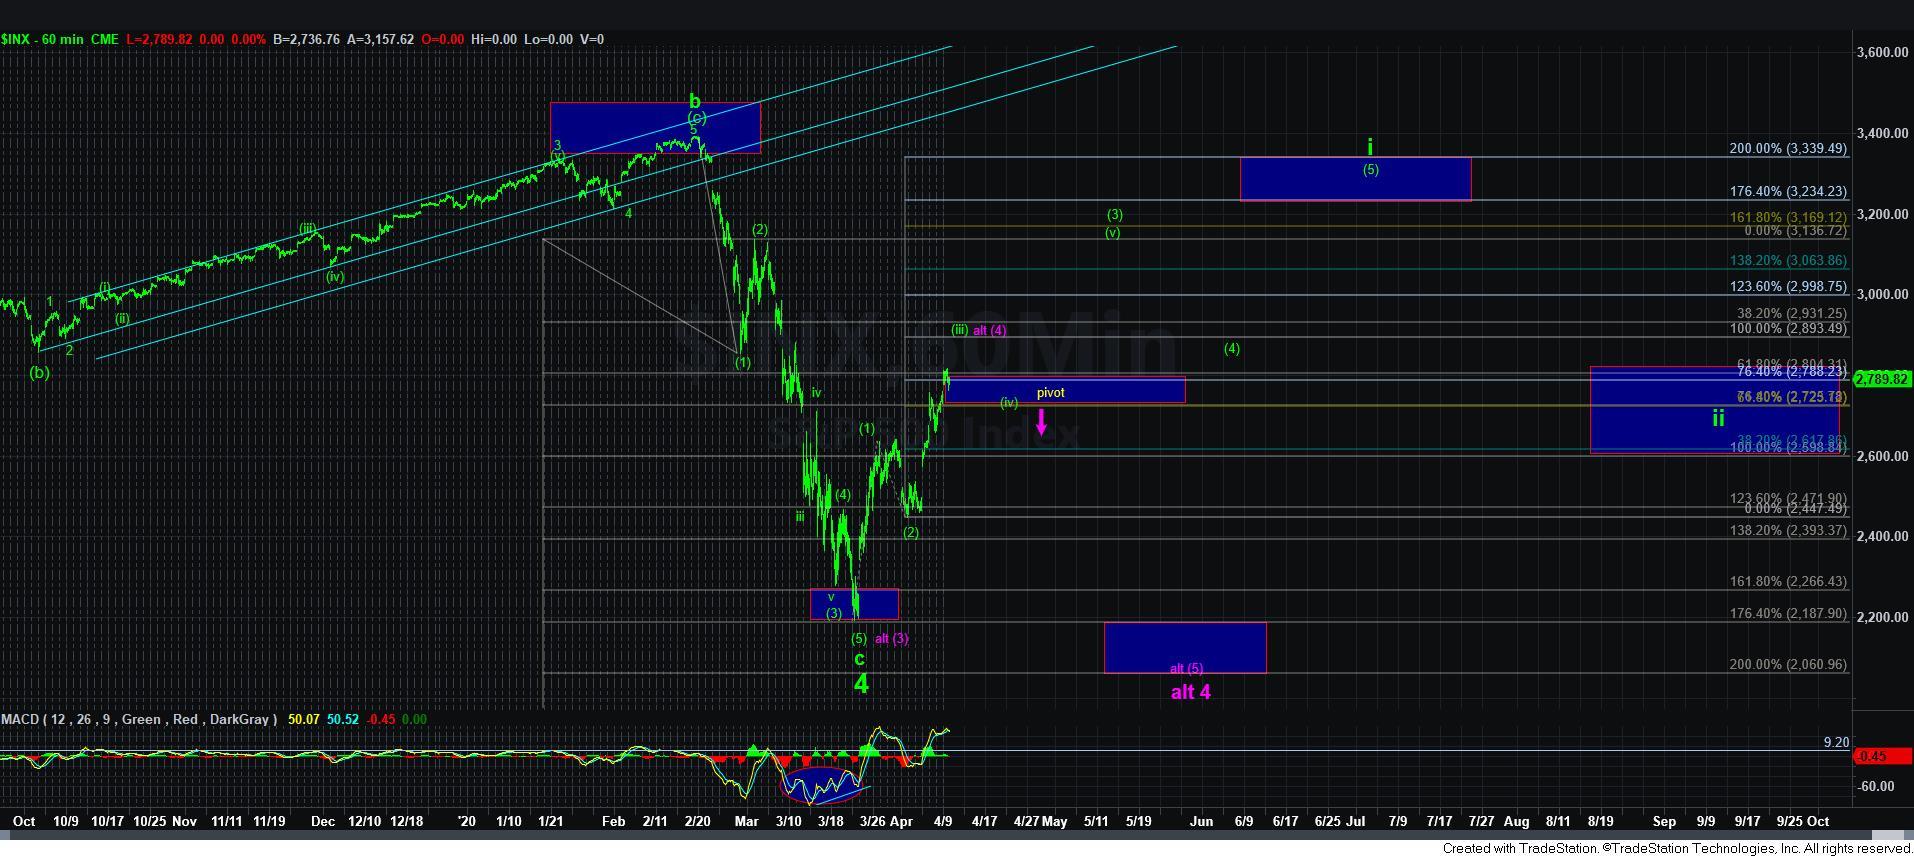
With this structure on our charts, we can now tune out the noise and simply focus on the levels through which the market turns. If we can see that last push to the 2890SPX region early in the coming week, you may want to lower your risk profile in equities until the market resolves this region. Should we pullback correctively and maintain support over 2700SPX in the wave [iv] pullback after we strike 2890, then we likely have a bottom in place, and we will then continue to track the market as it completes 5-waves up towards the prior highs.
Once 5-waves complete, we can then begin to focus on buying additional long positions during the wave ii pullback, as you can see on the 60-minute chart. In fact, that wave ii will likely take us back to the region within which we now find ourselves. And, then once the i-ii triggers into the heart of wave iii later this year or early 2021, we can look to add leveraged positions for the heart of the 3rd wave towards 4000SPX.
However, if the market strikes the 2890 region early in the coming week, and then proceeds to break back down below 2700, then we will have to reconsider the potential to target the 2060SPX region for the ultimate low to wave 4.
Now, for those still expecting this 4th wave to take us into 2021 for most of the market, I want to remind you again that we are already 2+ years into this correction. Therefore, I think the most likely and reasonable perspective would be to view it as either completed, or still needing that final 5th wave lower to complete it well within the 2020 time frame. Unlike most of the market that views this as a 6-week correction, most charts still view this correction as having begun back in early 2018, which means we are already 2+ years into this correction, which also means we are likely close to the completion of the correction if we have not already completed it.
So, in summary, I think the market is approaching its final test to determine whether we have bottomed. How the structure takes shape in the coming two weeks will tell us most of what we need to know for the remainder of 2020, and potentially well beyond. But, please do not allow any bias you maintain from the news cycle to divert your focus from this important pattern structure, as it will likely tell you all you need to know. I have always missed tremendous opportunities when I have ignored this structure due to my “feelings” or what I “think” the market should be doing based upon the news cycle. I have learned my lesson through experience, and will be focusing on this structure in the coming two weeks.