Has The Bear Market Begun?
Many people ask me what will happen next week or next year in the stock market. While I take it as a compliment that they think I am some kind of prophet, unfortunately, I am but a simple analyst who reads what the market tells me. So, I cannot tell you what will definitely happen in the market within a specific time frame.
When the market broke below 2880SPX, I warned all of our subscribers that now is a time to consider reducing risk as the market has become much more treacherous. In fact, when we broke 2880SPX, my ideal expectation was to see a decline to take us just below 2791SPX. But, there was no way I was able to know that it would happen as quickly as it did this week. Again, I cannot tell you what will definitely happen in the market within a specific time frame, even though I was following a pattern that was targeting just below 2791SPX from the 2880SPX break down.
Moreover, the market moved deeper than the 2770SPX region I wanted to see hold for continuation higher, so we must now strongly consider whether wave 3 off the 2009 has completed, and if a 4th wave taking us down towards the 2100SPX region has now begun.
Because I am not a prophet, I am duty bound to listen to the messages given to me by Mr. Market. And, he seems to have given me a mixed message with the all-time high we have struck recently. You see, our long-term Fibonacci Pinball targets were a minimum of 3011SPX, up to an ideal target of 3225SPX for wave (5) of v of 3. But, we have come up 70 points short from even the minimum target. And when the market does not reach our targets, it does leave questions as to whether the upside for wave (5) of v of 3 is done.
So, of course, the question that we are all asking is how do we know that the top is in place for wave 3, so that we can look forward to heading down to the 2100SPX region for wave 4? Let me walk you through the analysis progression so you can understand how I am looking at the market step by step.
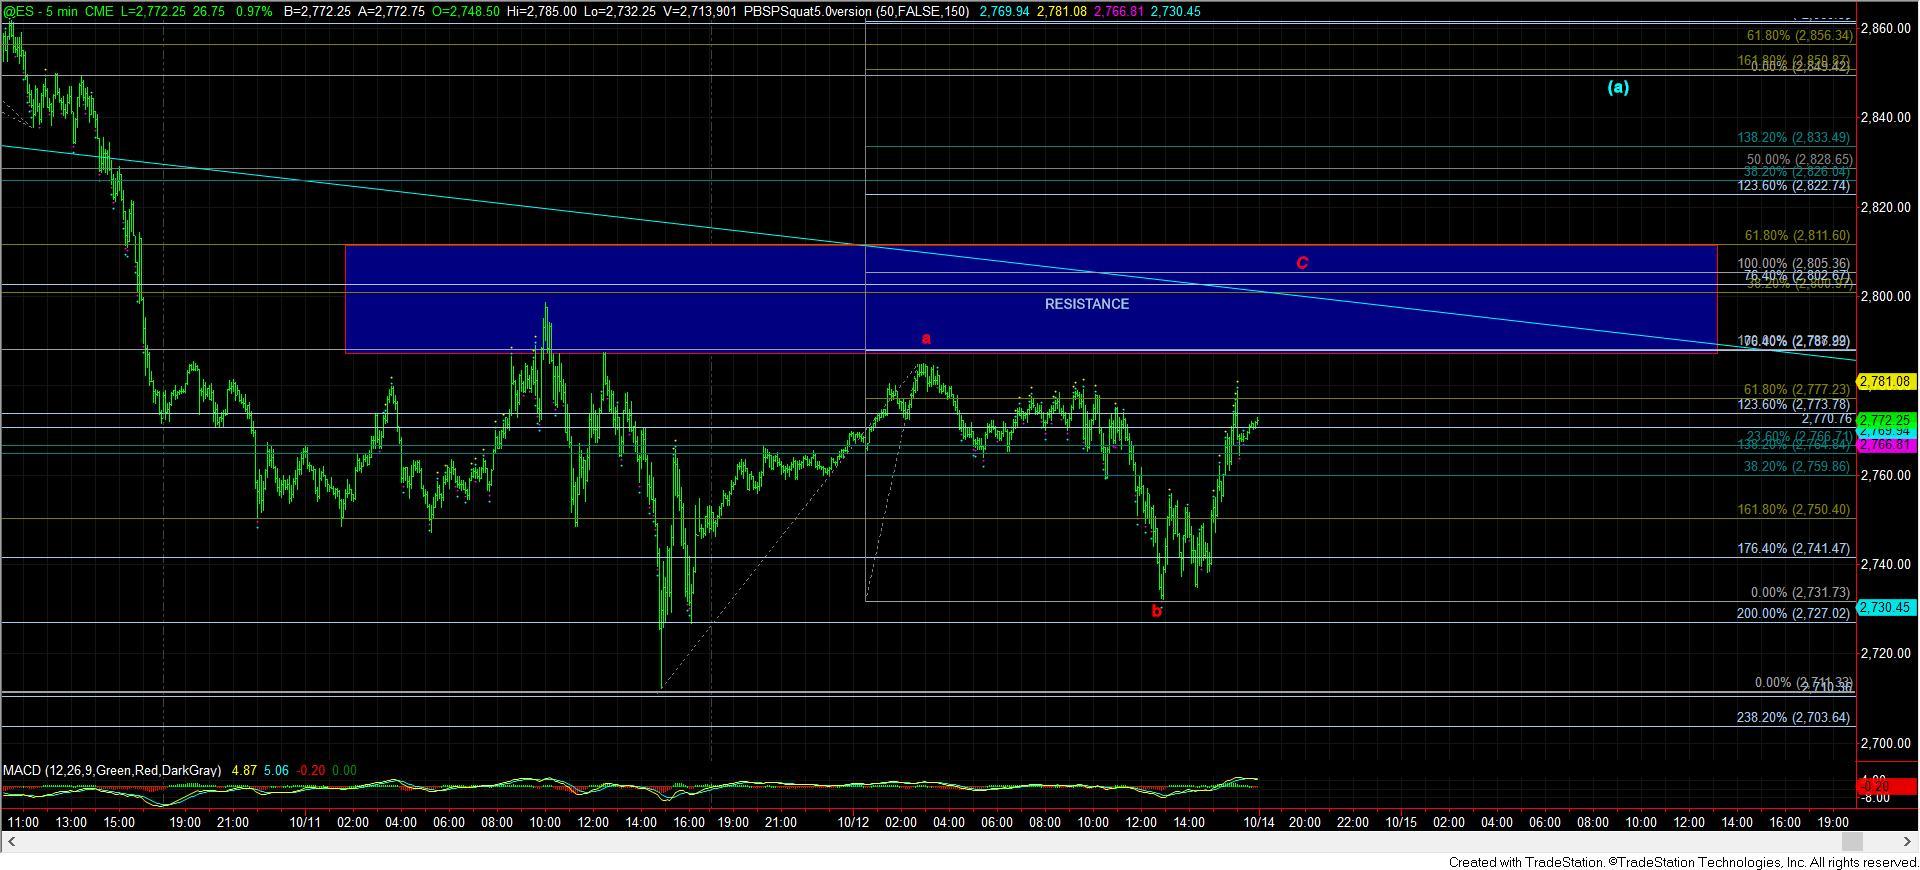
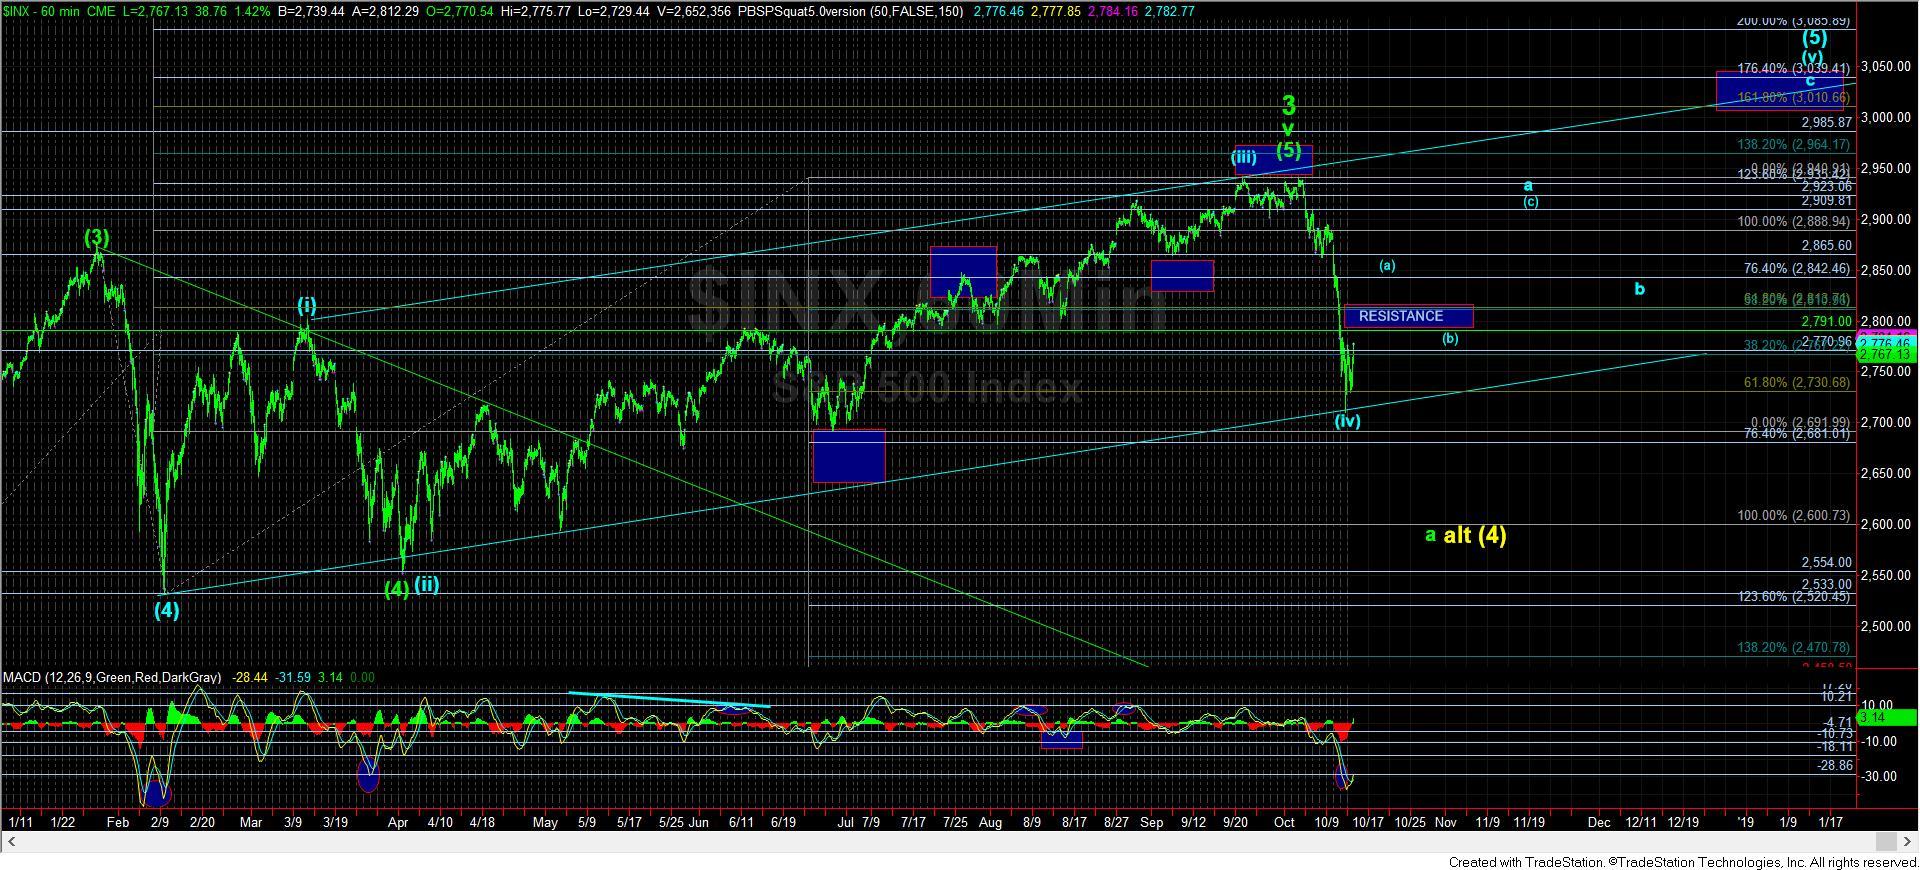
First, I have highlighted the main smaller degree resistance region I am following on the attached 5-minute ES chart, and have replicated that same region as the “resistance” box on the 60-minute chart. The main level I am keying in on is the 2805ES level, wherein we have an a=c off the recent lows (note the red c-wave). As long as the market remains below this resistance region, I am expecting the market to drop towards the 2600 region over the come week.
Second, should the market be able to exceed this resistance region in the coming week, then it opens a small door for the market to still reach the 3011-3050SPX region by the end of this year. This pattern is presented in blue on the 60-minute chart.
But, in order to prove this potential, the market must rally back up towards the 2840-65SPX region, and then hold support over the prior resistance region on a (b) wave corrective pullback, as outlined in the blue wave count. Should this occur, and we begin an impulsive structure for the (c) wave higher, then I will view the wave (5) of v of 3 as not having yet completed until we reach our ideal minimal target of 3011. But, this is really a tight hole through which the market must thread its needle. At this point, it does not look highly probable, especially as long as we remain below resistance.
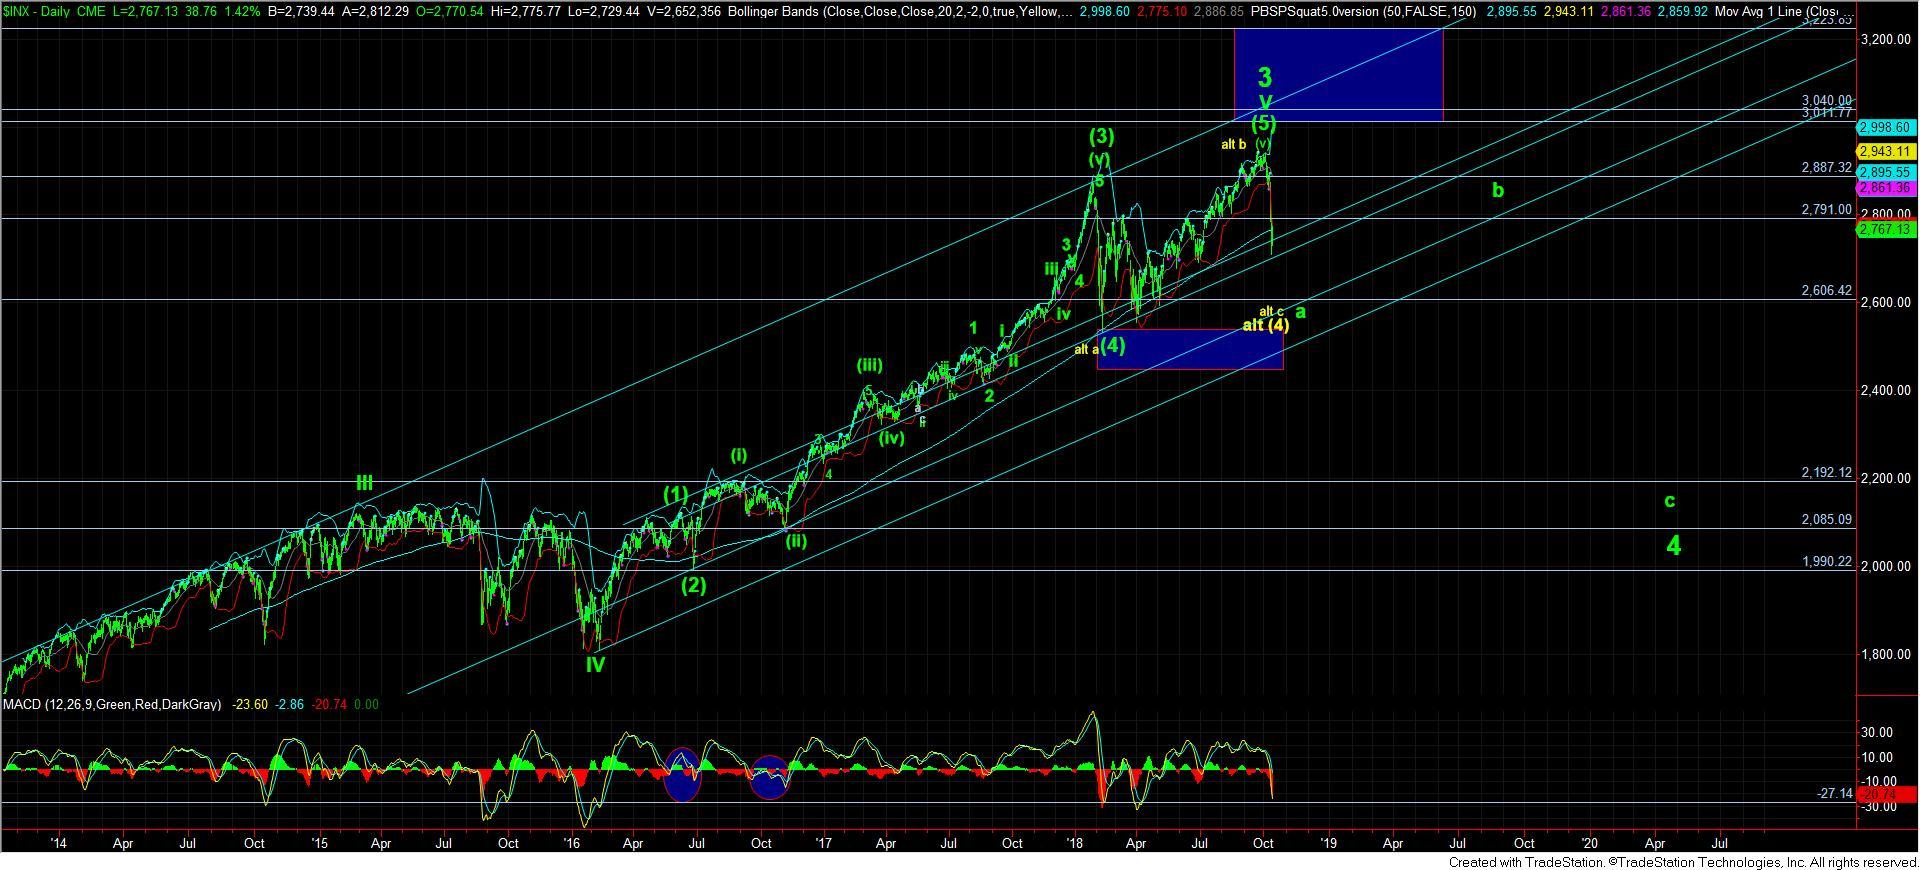
Third, as long as the market remains below resistance this coming week, I am looking for a drop down towards the 2600SPX region. Should that occur, my primary count will remain that wave 3 has topped, and this drop is the a-wave of wave 4. That then means I will be expecting a b-wave rally to start into the end of the year. In fact, that b-wave can take us many months to complete. However, should that rally begin as a clear impulsive structure, and it continues to confirm as such back up towards the 2800-2900SPX region, then I will have to adopt the yellow count, which is currently an alternative wave (4) flat within wave v of 3.
This alternative in yellow would suggest that the drop into the February low was the a-wave of (4), the rally into the 2940 top was the b-wave of wave (4), and this drop is the c-wave of wave (4). This would also point us back up towards the ideal target of 3225SPX into 2019. But, again, the market will have to prove this based upon the structure of the rally off the 2600 region. Unless it is able to prove this clearly, then I will be treating the rally into 2800-2900 as a b-wave rally, and will be looking for the set up to take us down to the 2100 SPX region in wave 4 in the coming year.
In summary, the market does have potential to still take us higher in a more extended wave (5) of v of 3 off the 2009 lows. But, as it stands now, I view that potential as the lower likelihood. Therefore, I am viewing wave 3 as completed, with the market having to prove to me that it wants to head back to our ideal targets for wave 3 in one of the two ways I have outlined above. And, the onus is on the market to make this clear to me, based upon the manner in which I have outlined above.
If not for the market coming short of its minimal target for this wave degree, we would not likely be having this debate about whether wave 3 has completed. But, due to the structure of the rally in 2018, along with the inability to strike our standard targets, the market is providing clues that wave 3 many not have completed. And, as a market analyst, I must respect and be cognizant of these clues being left by the market.
So, for most investors, it would be prudent to re-enter the long side should we see a continuation drop back down towards the 2600SPX region, as long as we do not see a sustained break of 2600SPX (the a=c target for the yellow wave (4)). However, should we break out through resistance in the coming week, even if the blue wave count does take us higher, I would say the risks have become too great for long-term investors to re-enter the market, as the start to wave 4 will have likely only been delayed by a few months.