HUGE Test For Metals
This past week, we got the rally we were expecting. This rally has seemingly re-ignited bullish “feelings” in the market, with many hoping that the market has bottomed. However, the bulls are about to be tested.
Thus far, the market has come to within pennies of our targets for a 4th wave. While this still can push higher in the coming week, my primary expectation is that it will result in a failed break out attempt, and send us down one more time before the real fireworks begin.
However, should the bulls actually be able to prove themselves by pushing through resistance on this attempt, I will gladly join them at that time. But, that is a lot to prove in the coming week.
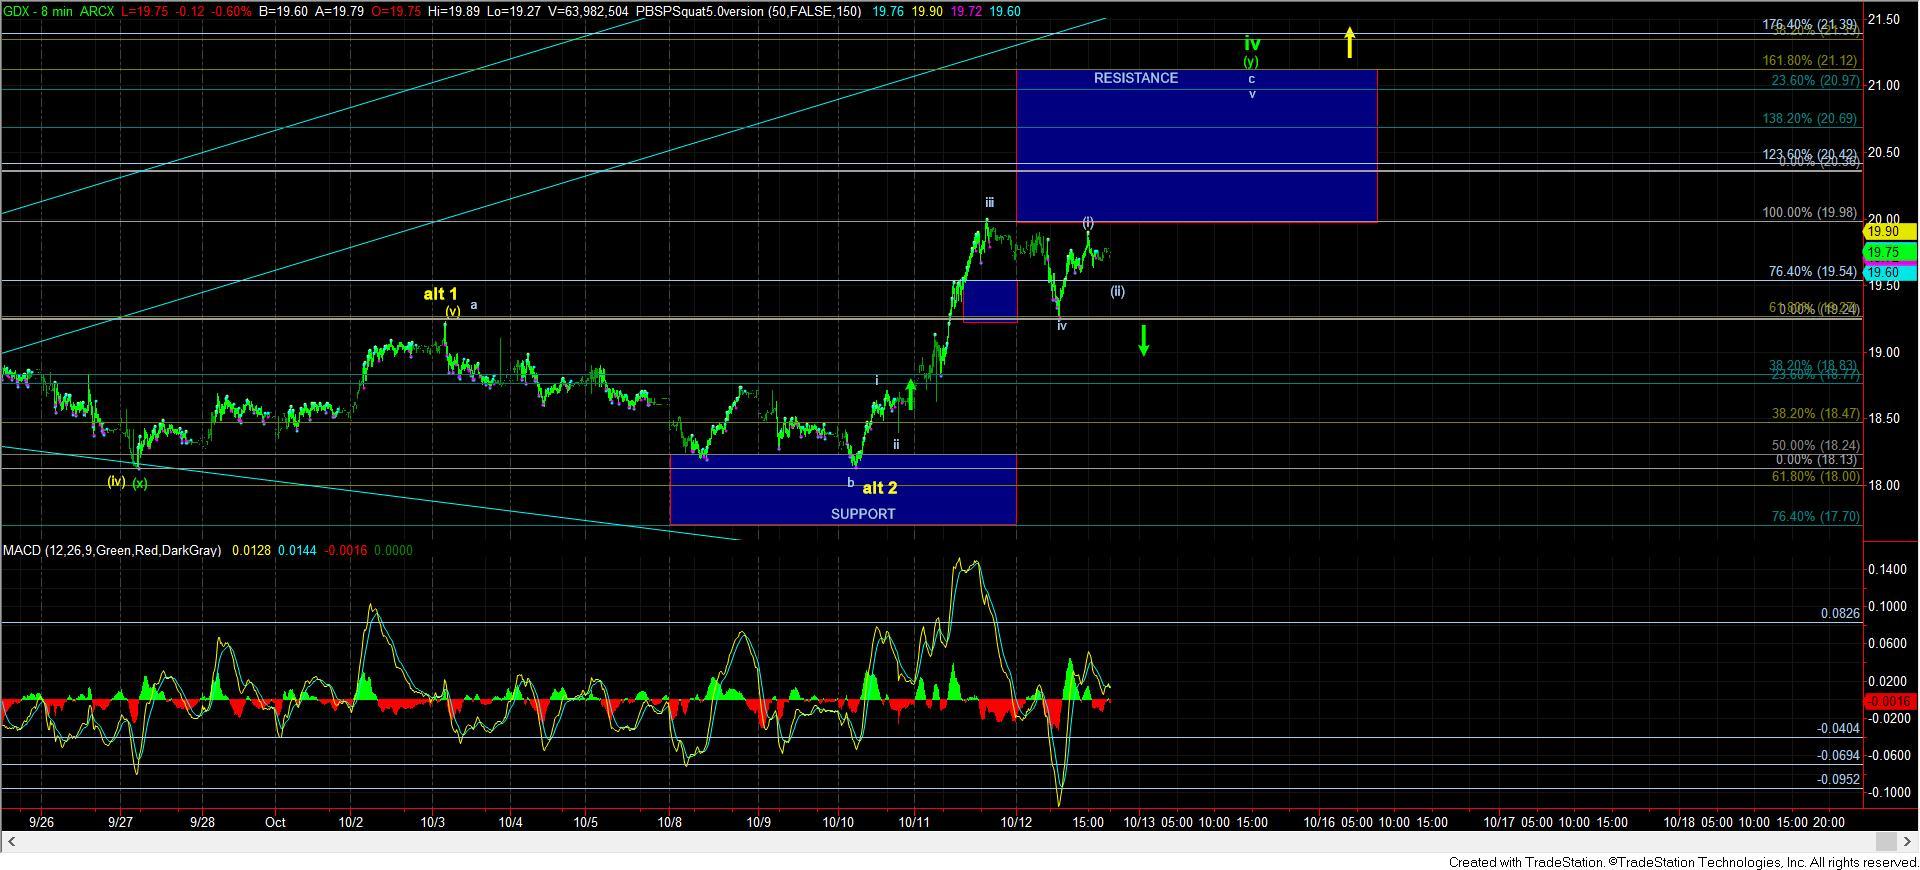
The one point of reference is presented to us in the GDX rally. The current rally has come within a penny of the target I had on my chart. The pullback we had at the end of the week, for which we called on Thursday, dropped to within a couple of pennies of our cited support, and then turned up as it should have. That low that we struck on Friday is now the key to this market rally in my humble opinion.
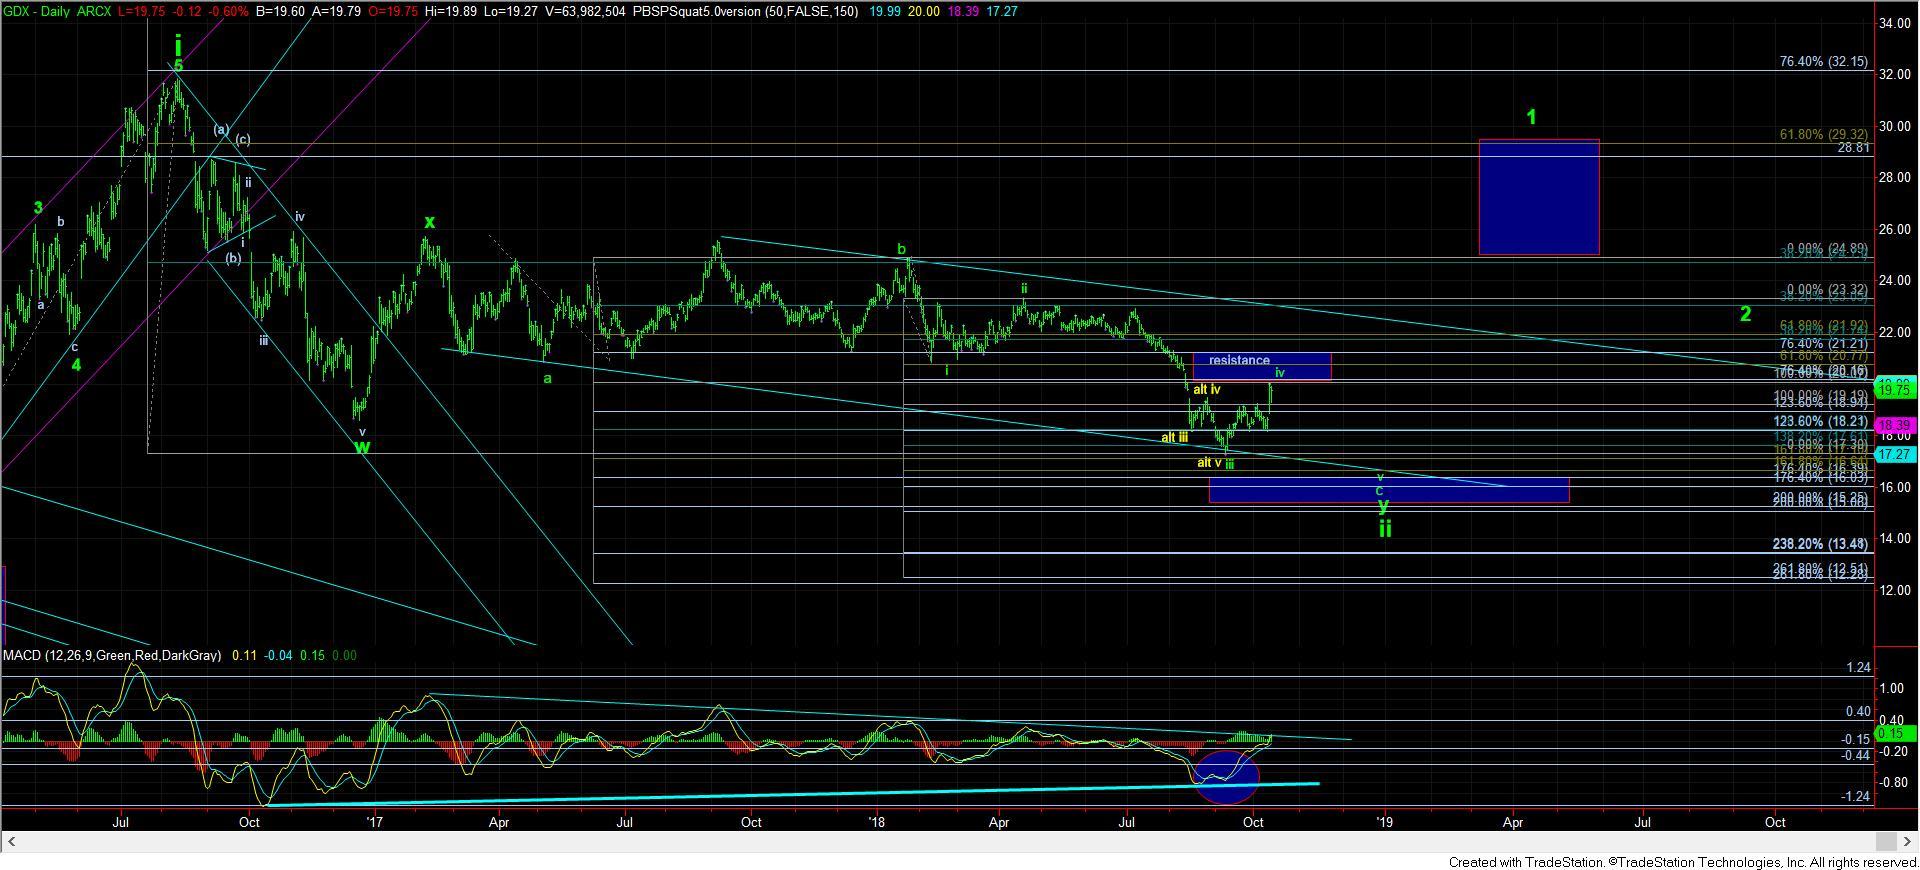
The low struck on Friday was 19.27. As long as the market remains over that level, it has the potential to break out and prove the low is in place. More specifically, we still can see an extension in this wave up towards this 21 region if the rally we experienced on Friday provides us with a (i)(ii) structure, as shown on the 8-minute chart. However, 19.27 MUST hold as support in order to see such an extension. But, should we break down below 19.27 before that extension is seen then it would be our first indication that green wave iv is over, and we have begun a drop to the 17 region or lower.
Should the market be able to extend towards the 21 region, then the 20 region becomes the relevant support which, if broken, opens the door to the drop lower.
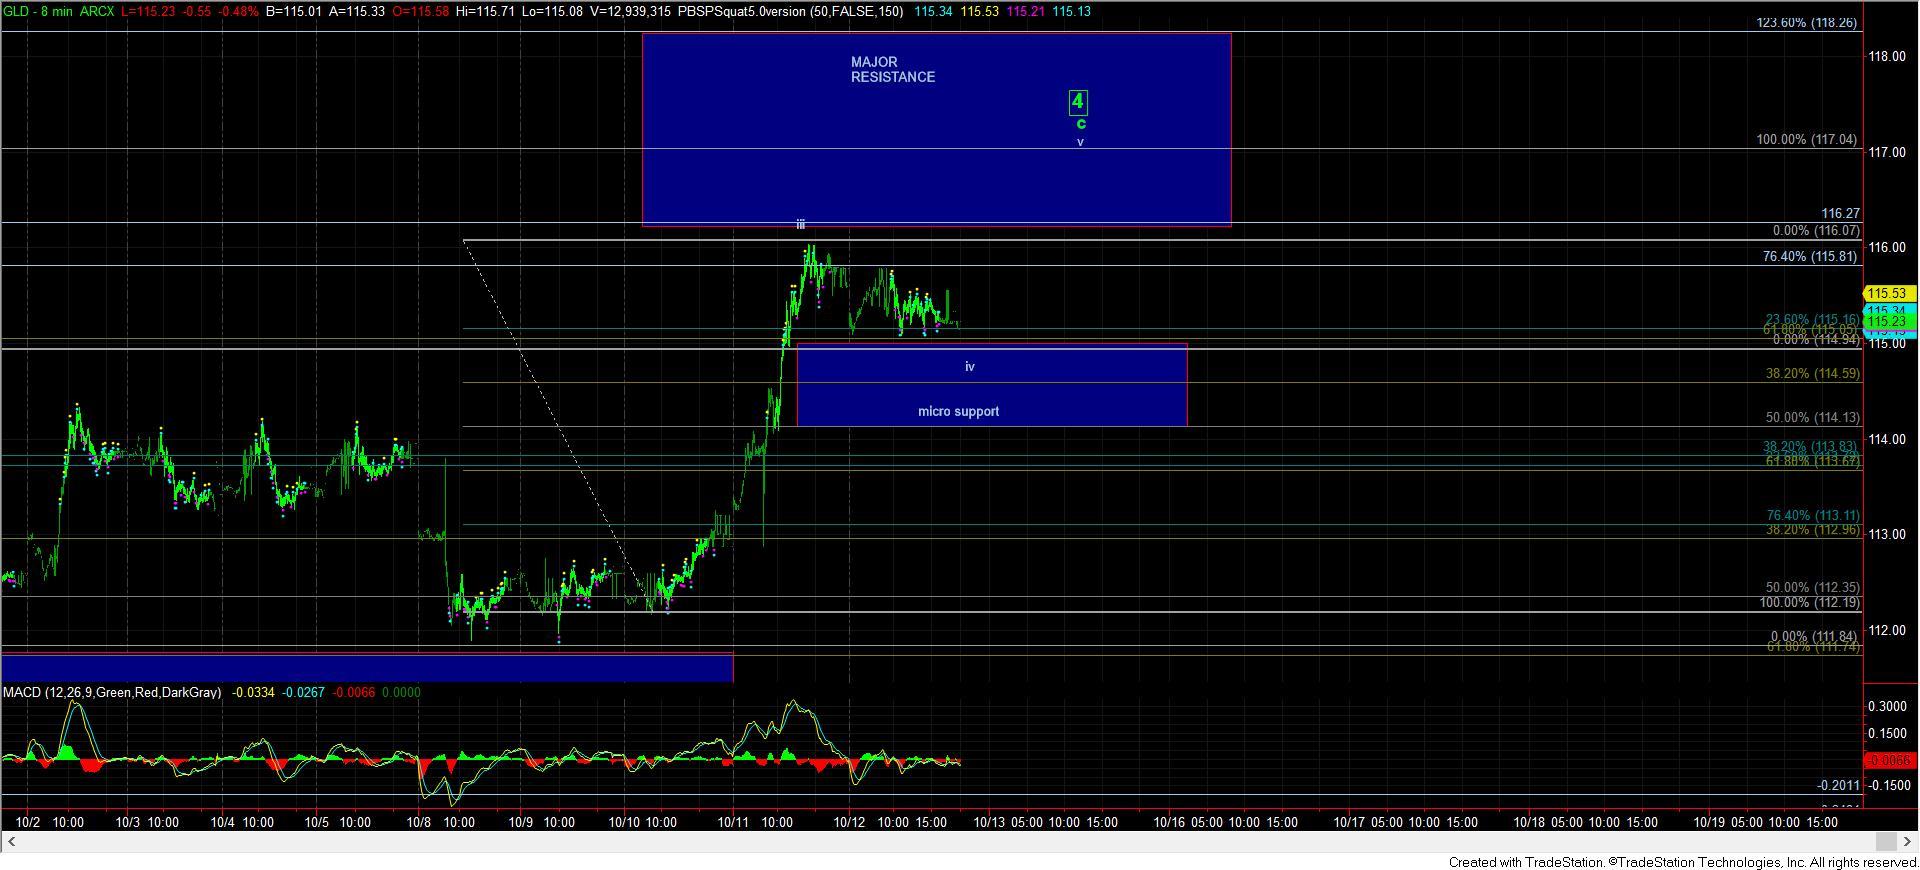
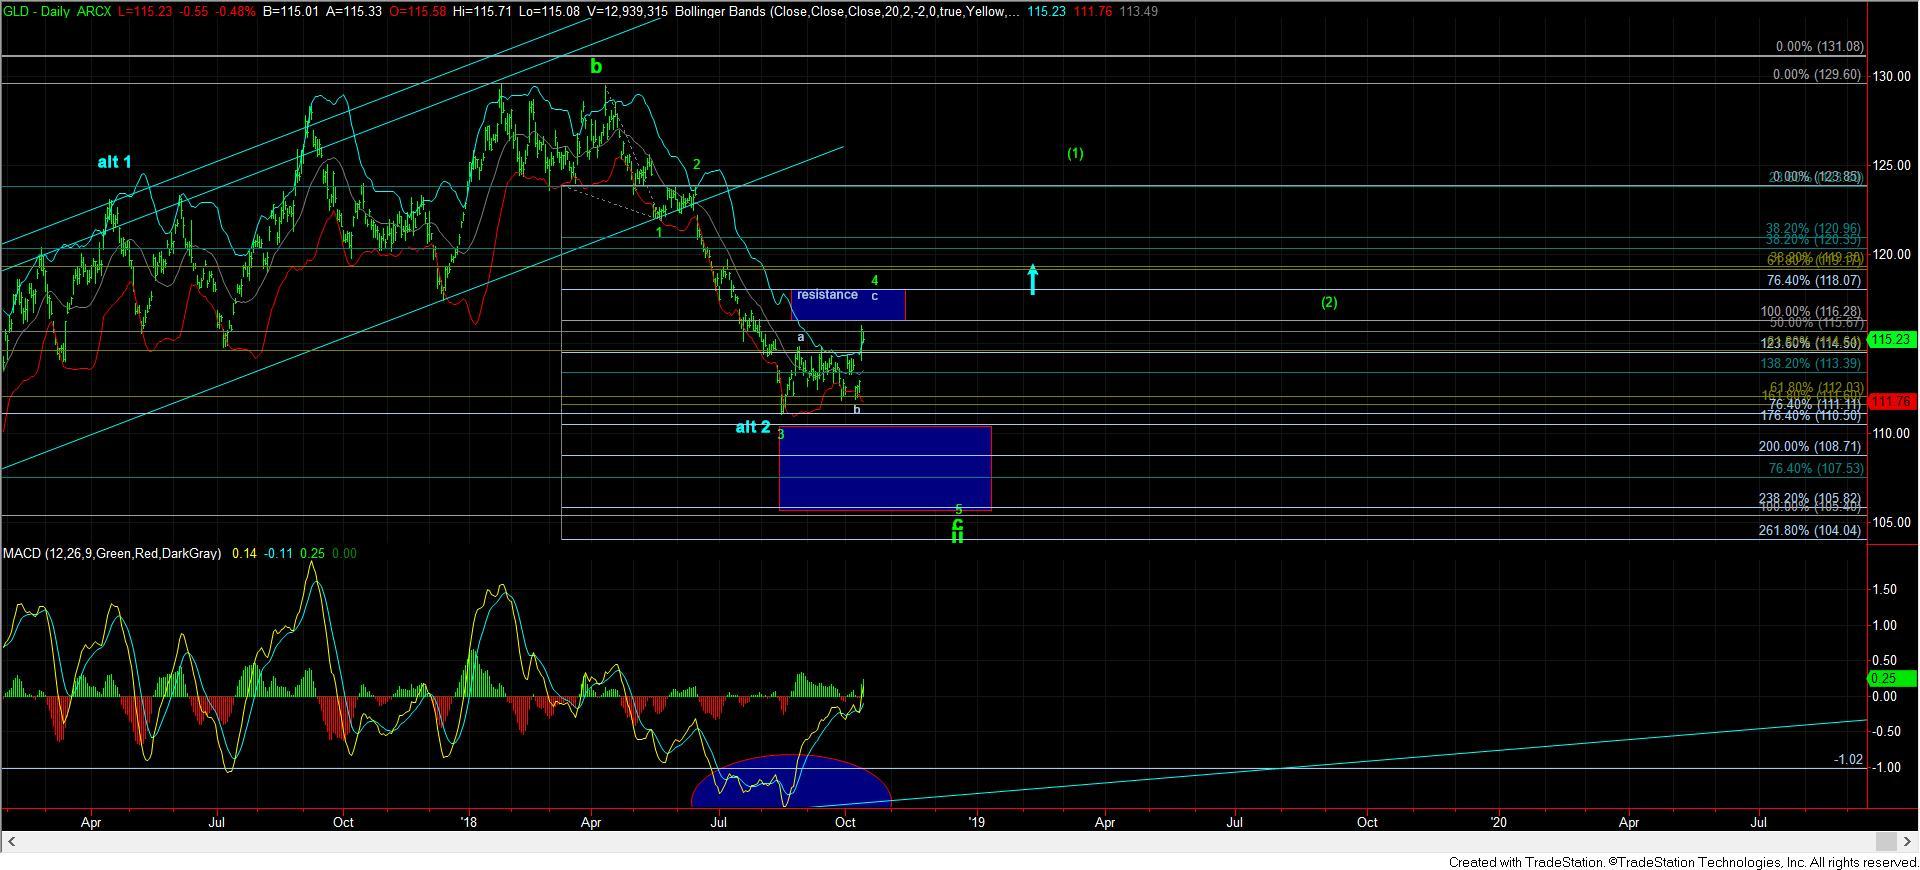
Based upon the GLD structure, I think we may be able to see this extension in the GDX. You see, when the GDX developed this 5 wave structure off the low struck on Friday, GLD continued to consolidate in what seems to be a 4th wave of this c-wave rally. That means that as long as the GLD remains over the 114 region, it can still see an extension up towards the 117 region, which is where the a=c target is off the lows, and a typical target for a corrective rally. A break down below 114 GLD and 19.27 would strongly suggest that we have begun the drop to lower lows. And, if you remember, I am expecting the GLD to AT LEAST strike the 109 region on the next decline, with the potential to drop as deep as the 105 region.
So, the market has now provided us with VERY clear lines of demarcation between the bullish scenarios and the bearish scenarios, especially in the GDX. The reason I say this is based upon our Fibonacci Pinball method. You see, the GDX has now rallied up to the 1.00 extension, and has pulled back to the .618 extension in a corrective retrace. It has rallied off that level with a micro 5 wave structure, which leaves the door open towards the 1.618 extension in the 21 region should the market be setting up a micro (i)(ii) structure.
However, should we break down below the 19.27 level (the pullback low in the pullback to the .618 extension), then that is a strong indication that the current rally has failed, and we have begun the drop to lower levels in the GDX. This is why Fibonacci Pinball is so powerful in assisting us in determining whether the rally is an impulsive structure pointing much higher and opening the door to confirming a major bottom in the complex, or if this rally is simply corrective in nature. So, all stops on longs should be focusing on the 19.27 level of support right now. And, that support will move up to the 20 region should the market be able to extend up towards the 21 region in the coming week.
As you can see, the bull/bear lines have been clearly drawn, and now it is up to the market to tell us which way this is going to turn. For now, my expectation remains that this rally is a 4th wave rally, but I will be listening to the market over the coming weeks should it give me a different indication.
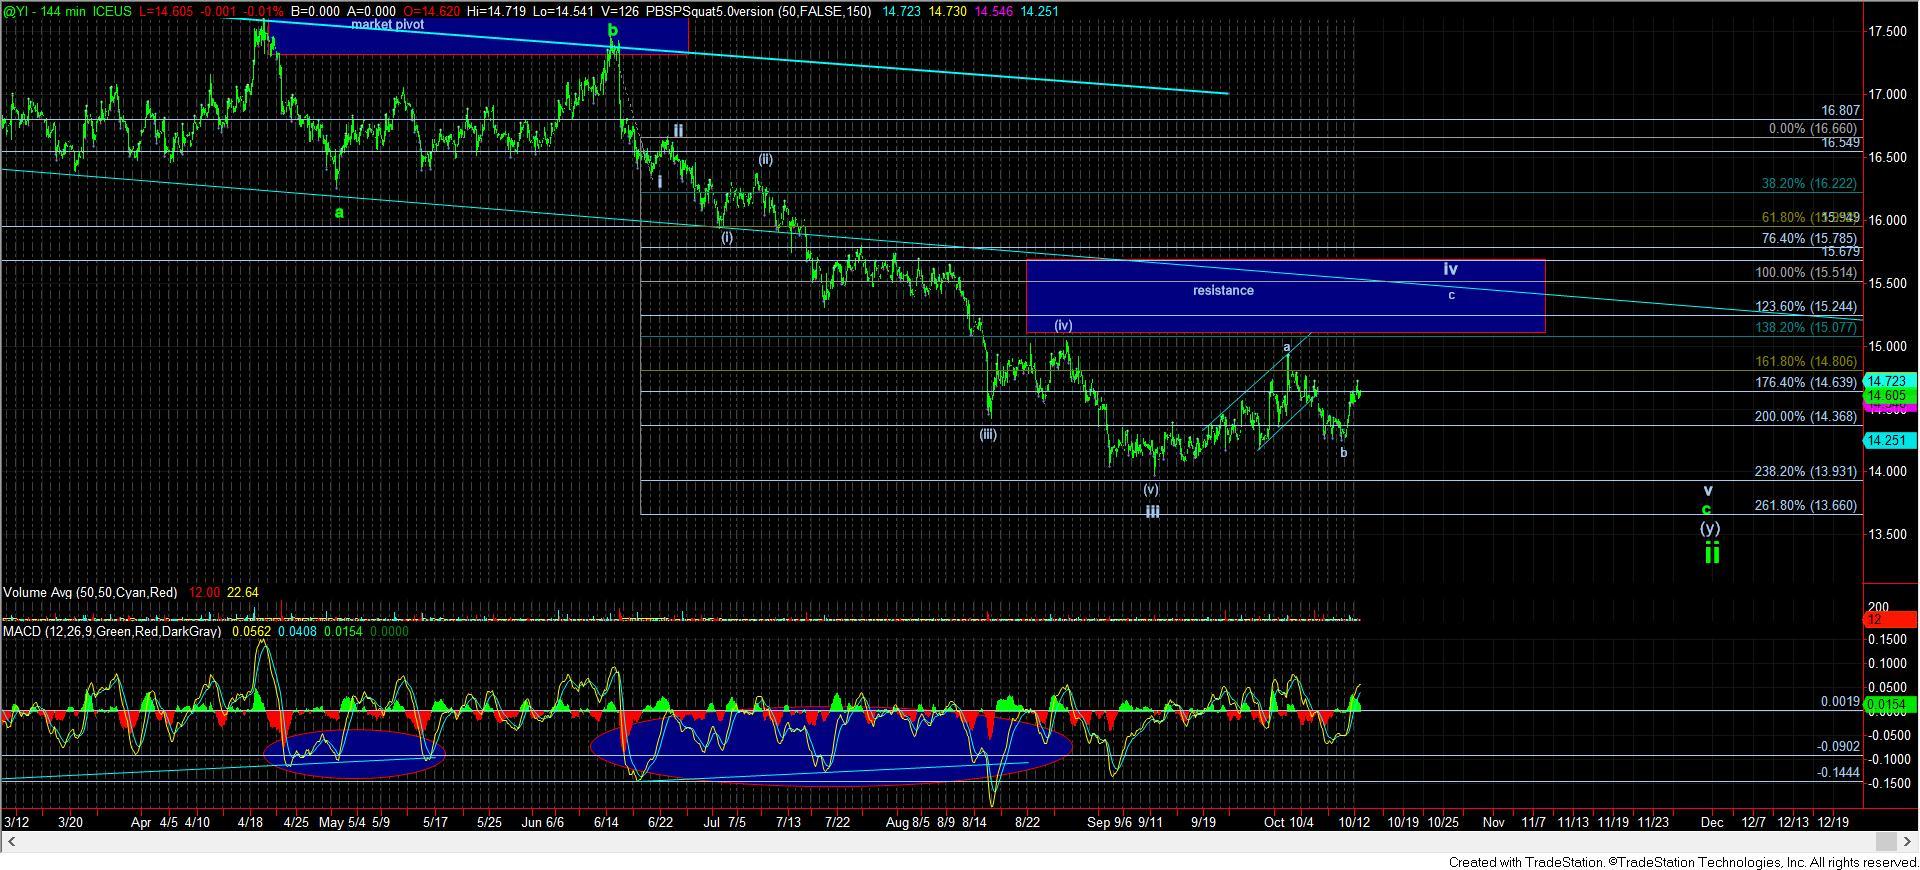
Moreover, silver also does not look like it has completed its c-wave of wave iv just yet. It, too, suggests that it can head higher into our target box to complete a c-wave of wave iv. In fact, silver can very well outperform on this next rally, as long as it holds over 14.26. A break down below 14.26 would suggest that silver is heading to a lower low, with a minimum target in the 13.70 region. But, as long as silver remains over 14.26, it too can prove to us that the lows in the complex have been struck, should it be able to strongly exceed our resistance region for a wave iv.
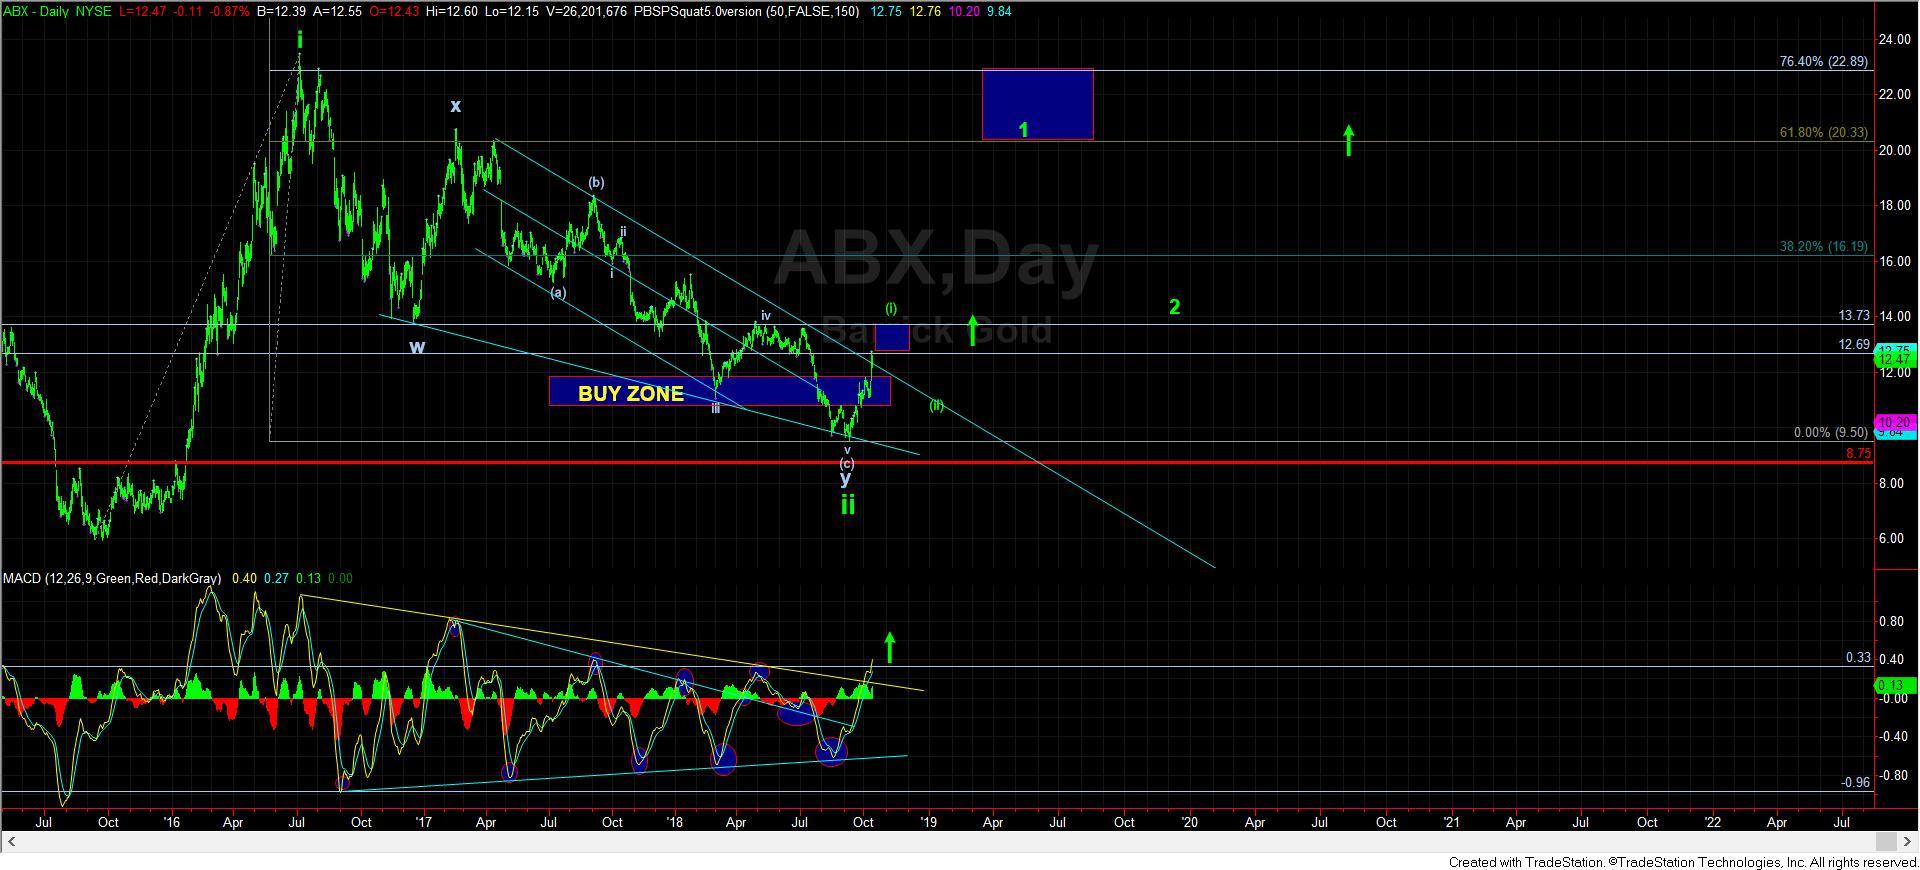
As far as the individual miners are concerned, as you know, I have been giving the ABX room to run since it is the miner which really has seen enough waves in place to consider its wave ii has completed. From a micro structure, I would not want to see ABX top at exactly the 13.25 level, as that “could” still be an a-b-c rally off the lows. I would actually prefer to see it as either having topped in its wave (i) off the lows, or push higher towards the 13.60+ region to provide a more extended wave (i) off the lows. A top at exactly that 13.25 level would concern me a bit that it still could be a corrective rally topping out. But, my preference, based upon the manner in which we have rallied off the lows, is that the bottom is in place for the ABX, and the next retrace “should” be corrective and a wave (ii).
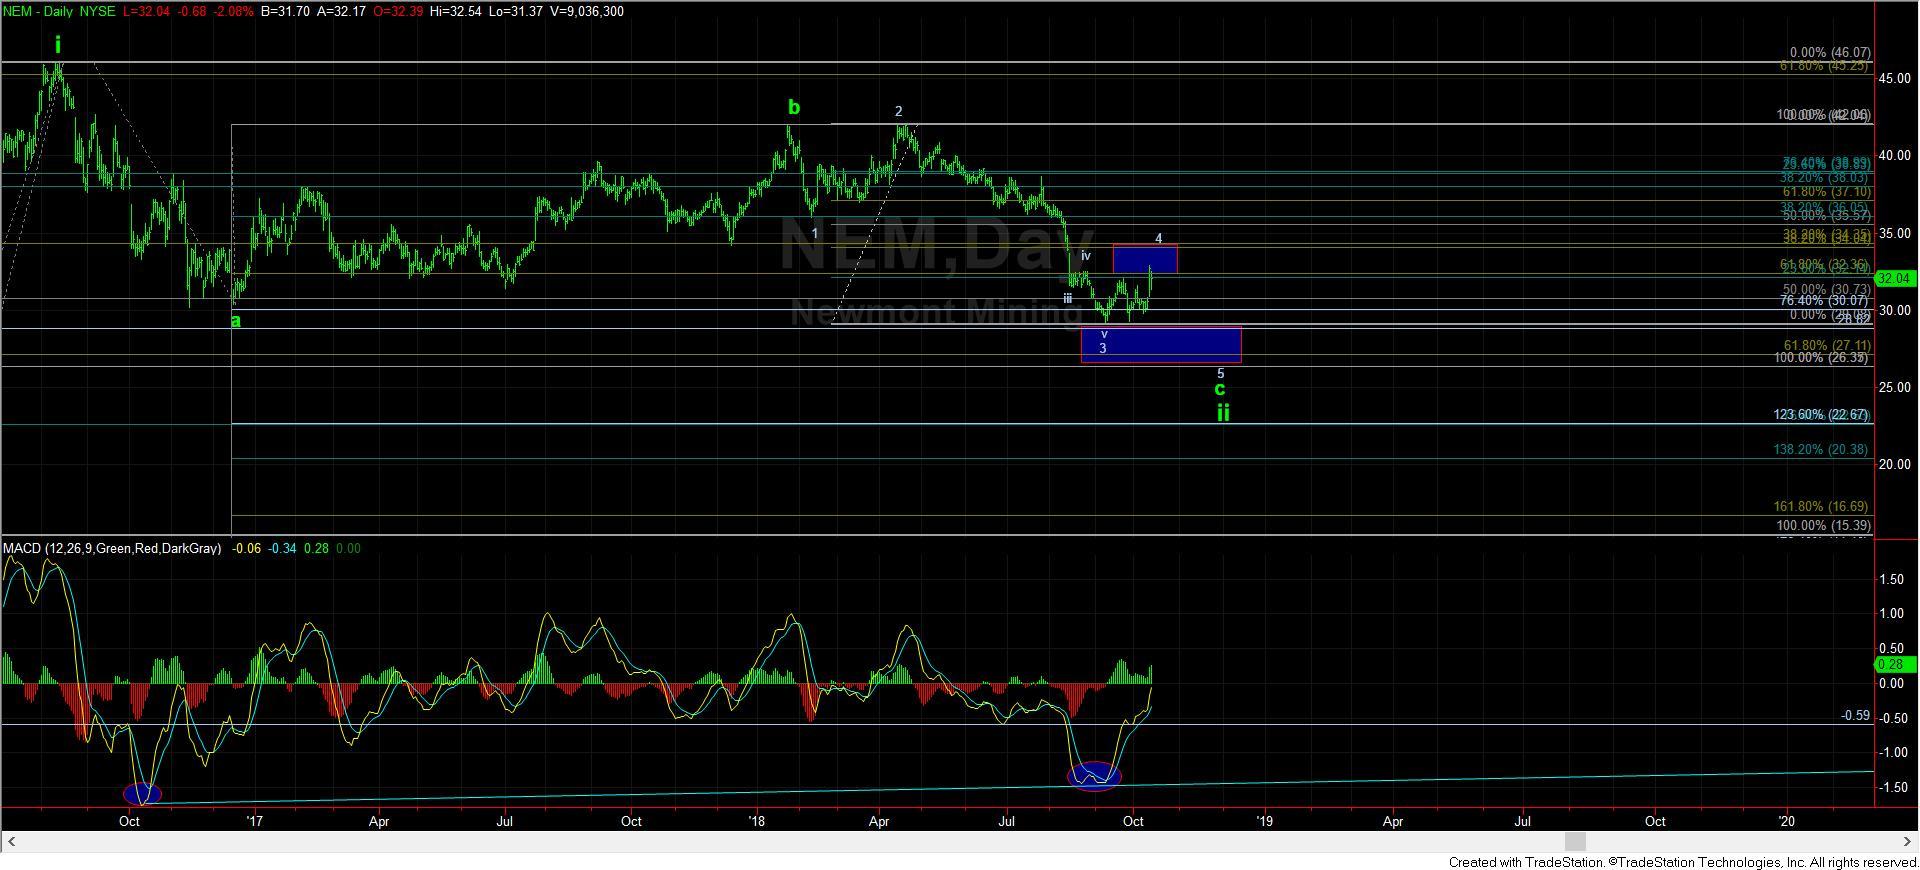
With regard to NEM, the market is filling in its 4th wave as expected. And, as long as we remain below the 35 region, I am still expecting that 5th wave lower. If it can push through the 35 region in the coming week or two, then it would go a long way to confirming that it too may have completed its wave ii, but in a more complex WXY pattern, rather than the standard a-b-c presented on the chart.
So, we have a very important two weeks coming up, which will provide us with the answer as to whether we see lower levels in the complex overall, or if the bull market rally is back. Again, my primary expectation is that this rally is only corrective in nature for most of the charts we are following, but clearly I have laid out the levels which will either confirm or invalidate that potential. Most specifically, 19.27 is of utmost importance to me in GDX, and will be raised to the 20 region should we extend up to the 21 region in the coming days.
For those that are looking to buy physical metals, I would highly suggest you visit a site of one of our trusted members, Doug Eberhardt – http://buygoldandsilversafely.com/EWT