HD and LOW: Will They Be Hammered By High Valuations?
 By
Levi
By
Levi
By Levi at Elliott Wave Trader; Produced with Avi Gilburt
The two home improvement stalwarts appear to be nearing important swing highs in price. How important that high will be remains to be seen. What prompts this opinion? Let’s look at a brief fundamental overview and then dive into the structure on the charts as painted by crowd behavior. When combining these two viewpoints, we then arrive at our current leaning. Follow along as we demonstrate this synergistic method of analysis.
Fundamentals First
Lyn Alden shares her current views regarding HD and LOW. This helps us frame a thesis for the next several months. Note her most recent post:
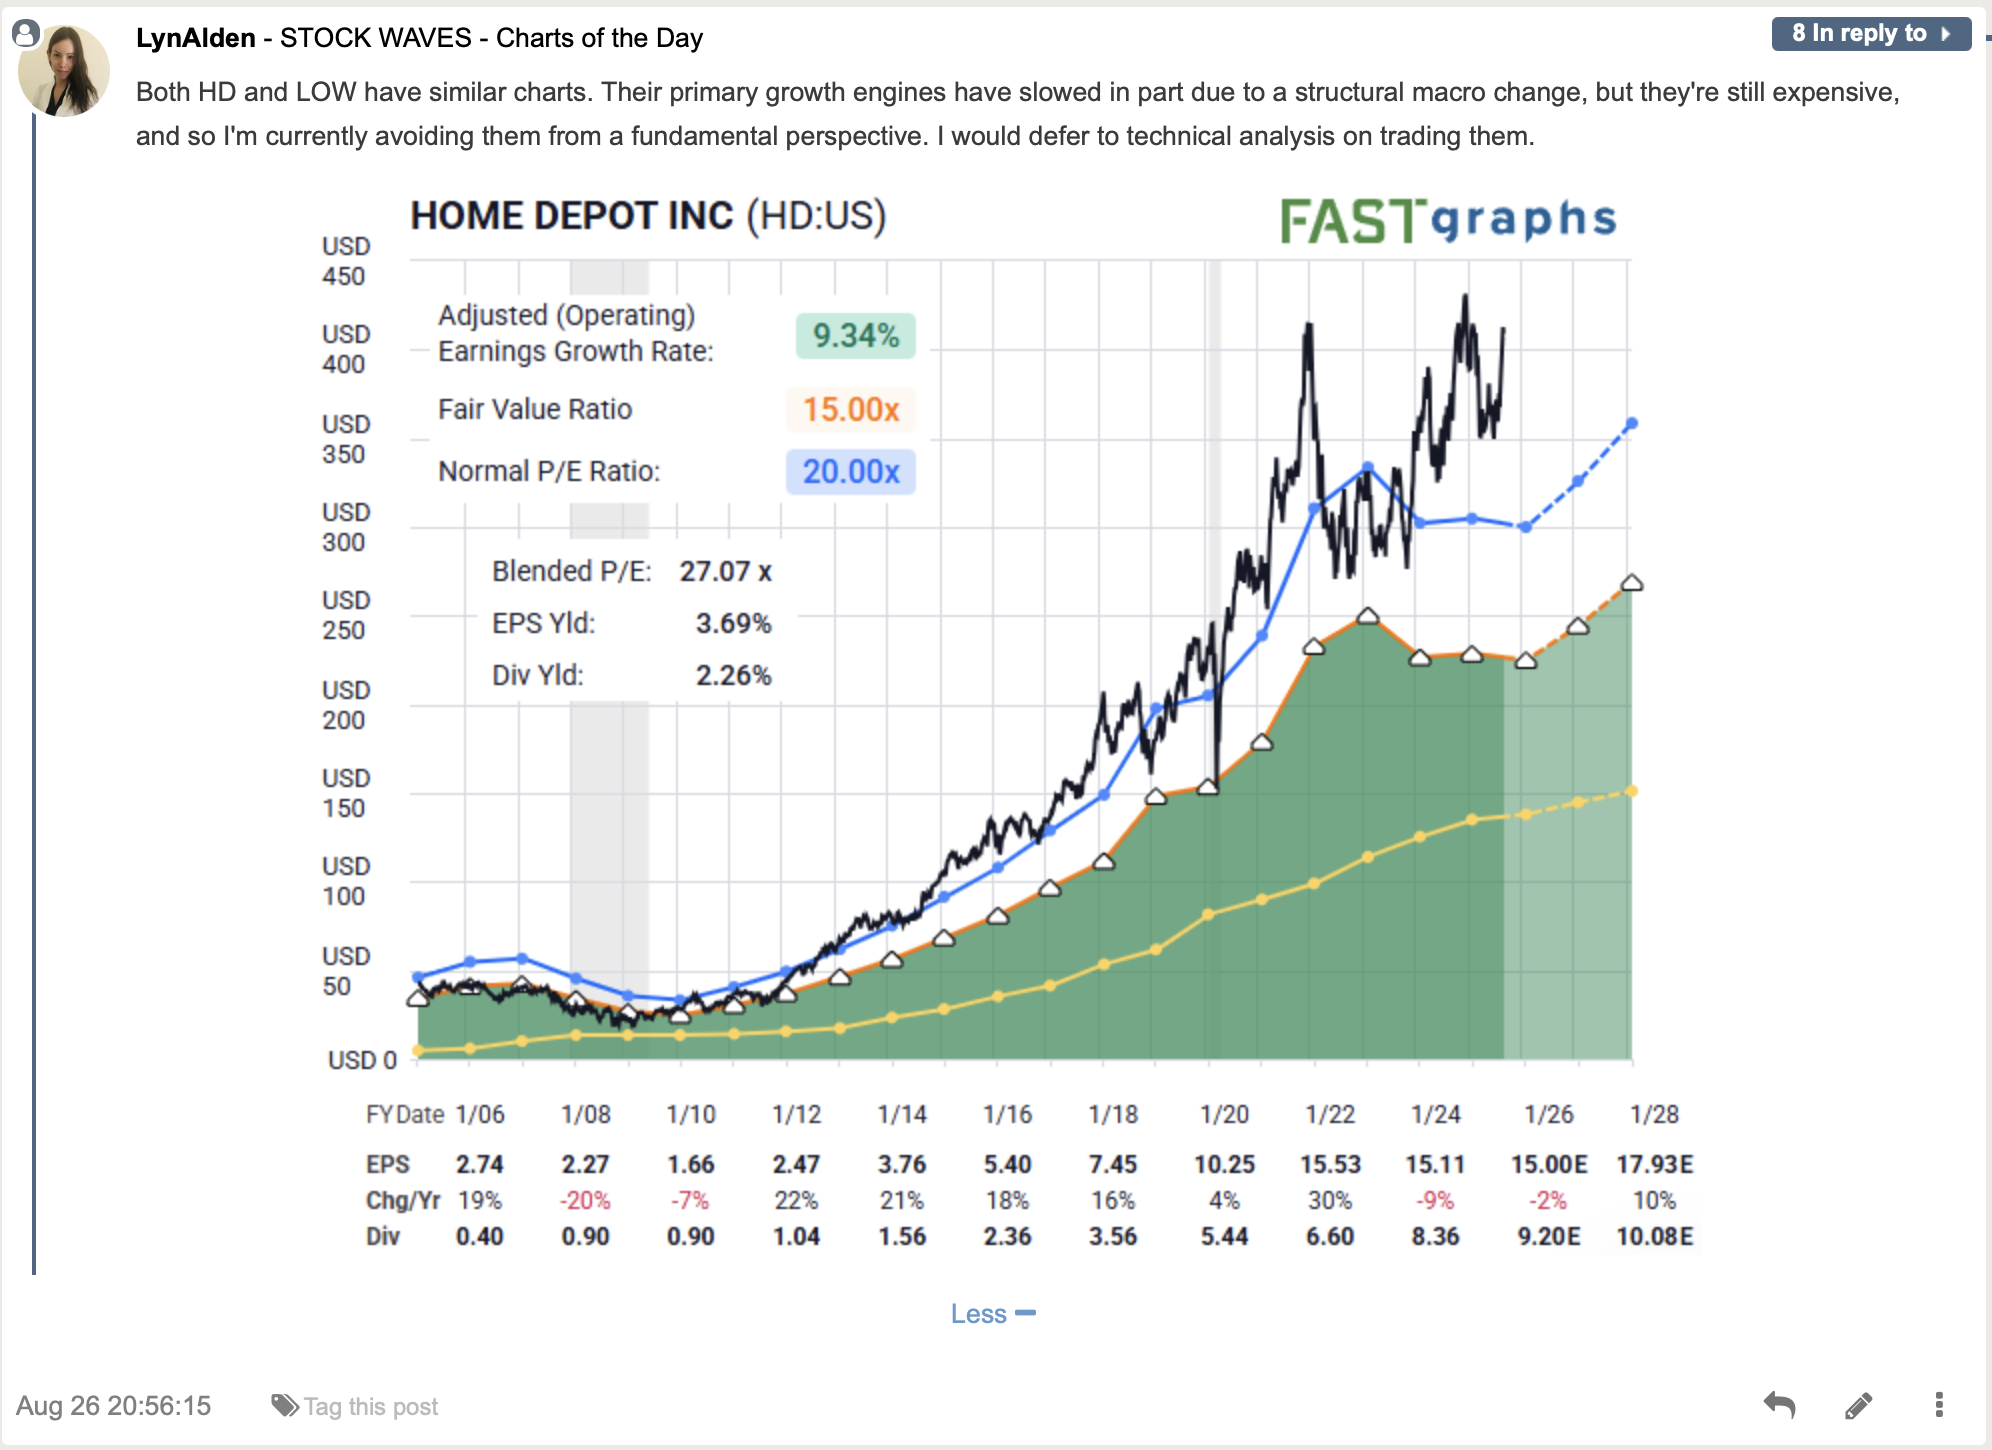
“Expensive” - that’s what stands out here. Now, a fast-growing company can easily support higher multiples. And while HD and LOW are yet technically still “growing”, they are not by any means in a hyper-growth mode as many of the other stocks we cover (see the article regarding WING published a few weeks ago).
So we have two stocks that are at relatively “spendy” prices. What do the charts have to say about this?
Next We Examine Context
HD is actually an active bullish Wave Setup for members in StockWaves. It was first presented on April 10 near the Tariff Tantrum selloff. Let’s briefly review that setup for further context of the moment.
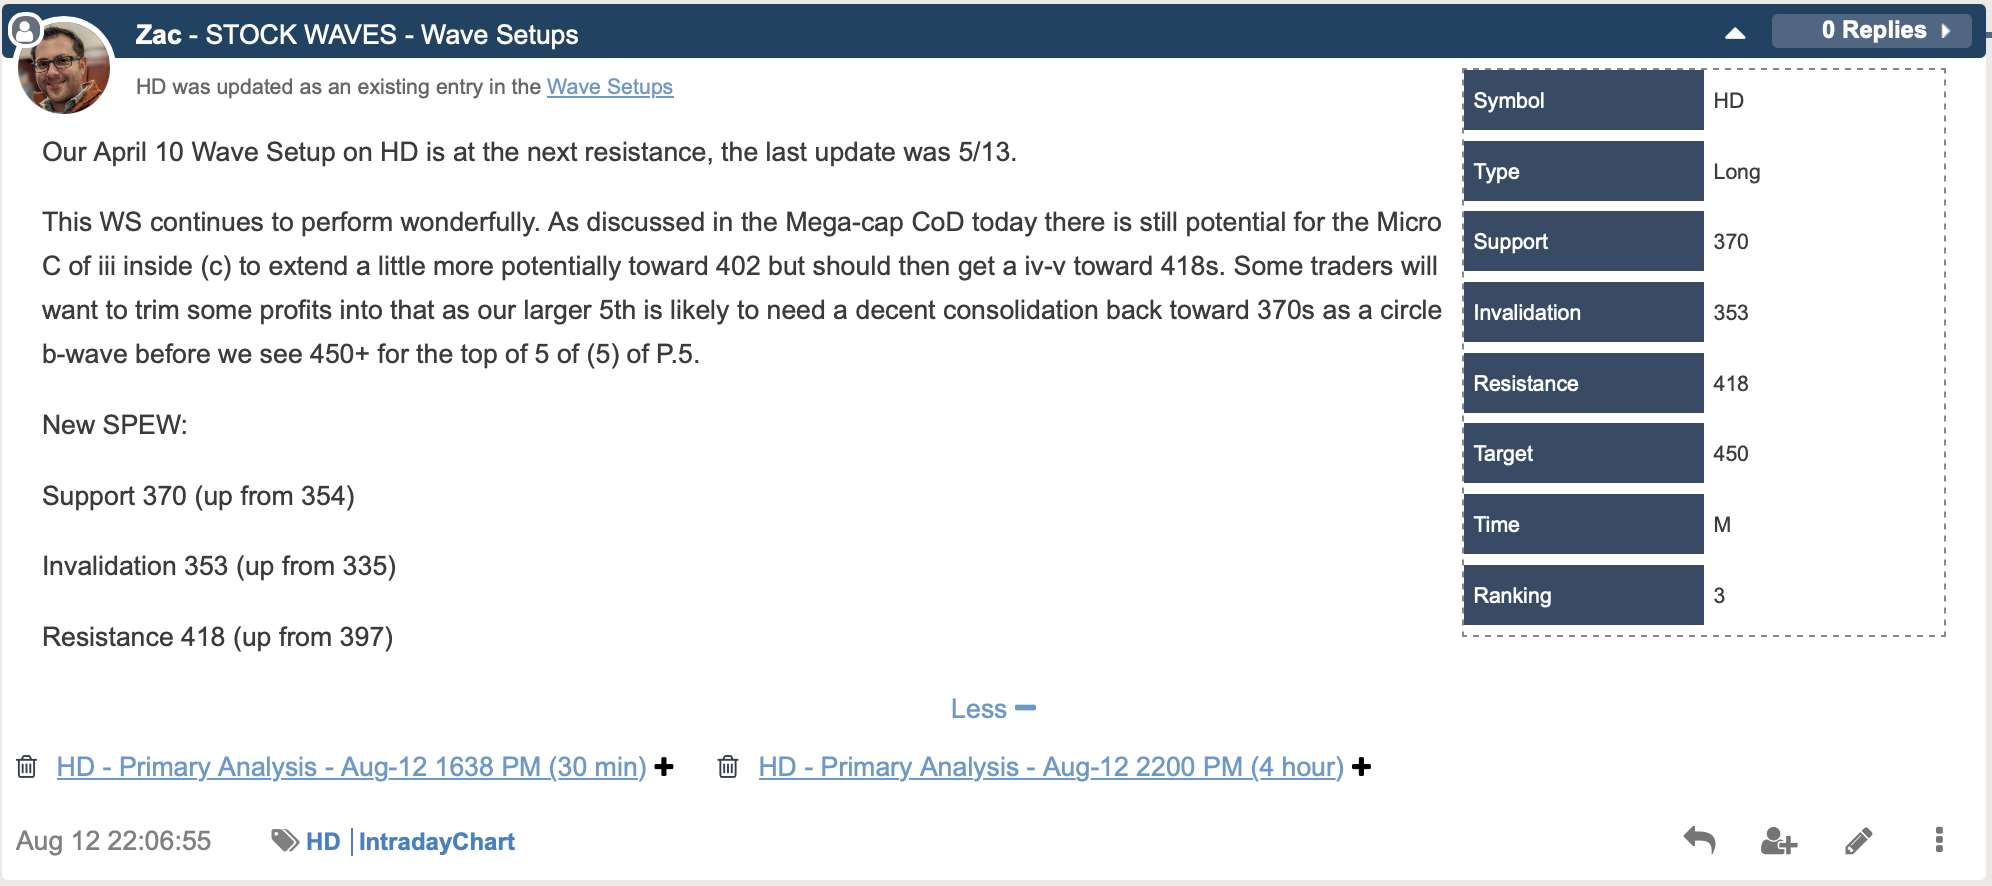
 We can distill a bit more what Zac Mannes is seeing here. The bigger picture presented at those past April lows was pointing to a higher high yet out there, perhaps into early 2026. While timing is not a focus of this method of analysis, simply from a proportional standpoint, that would fit well.
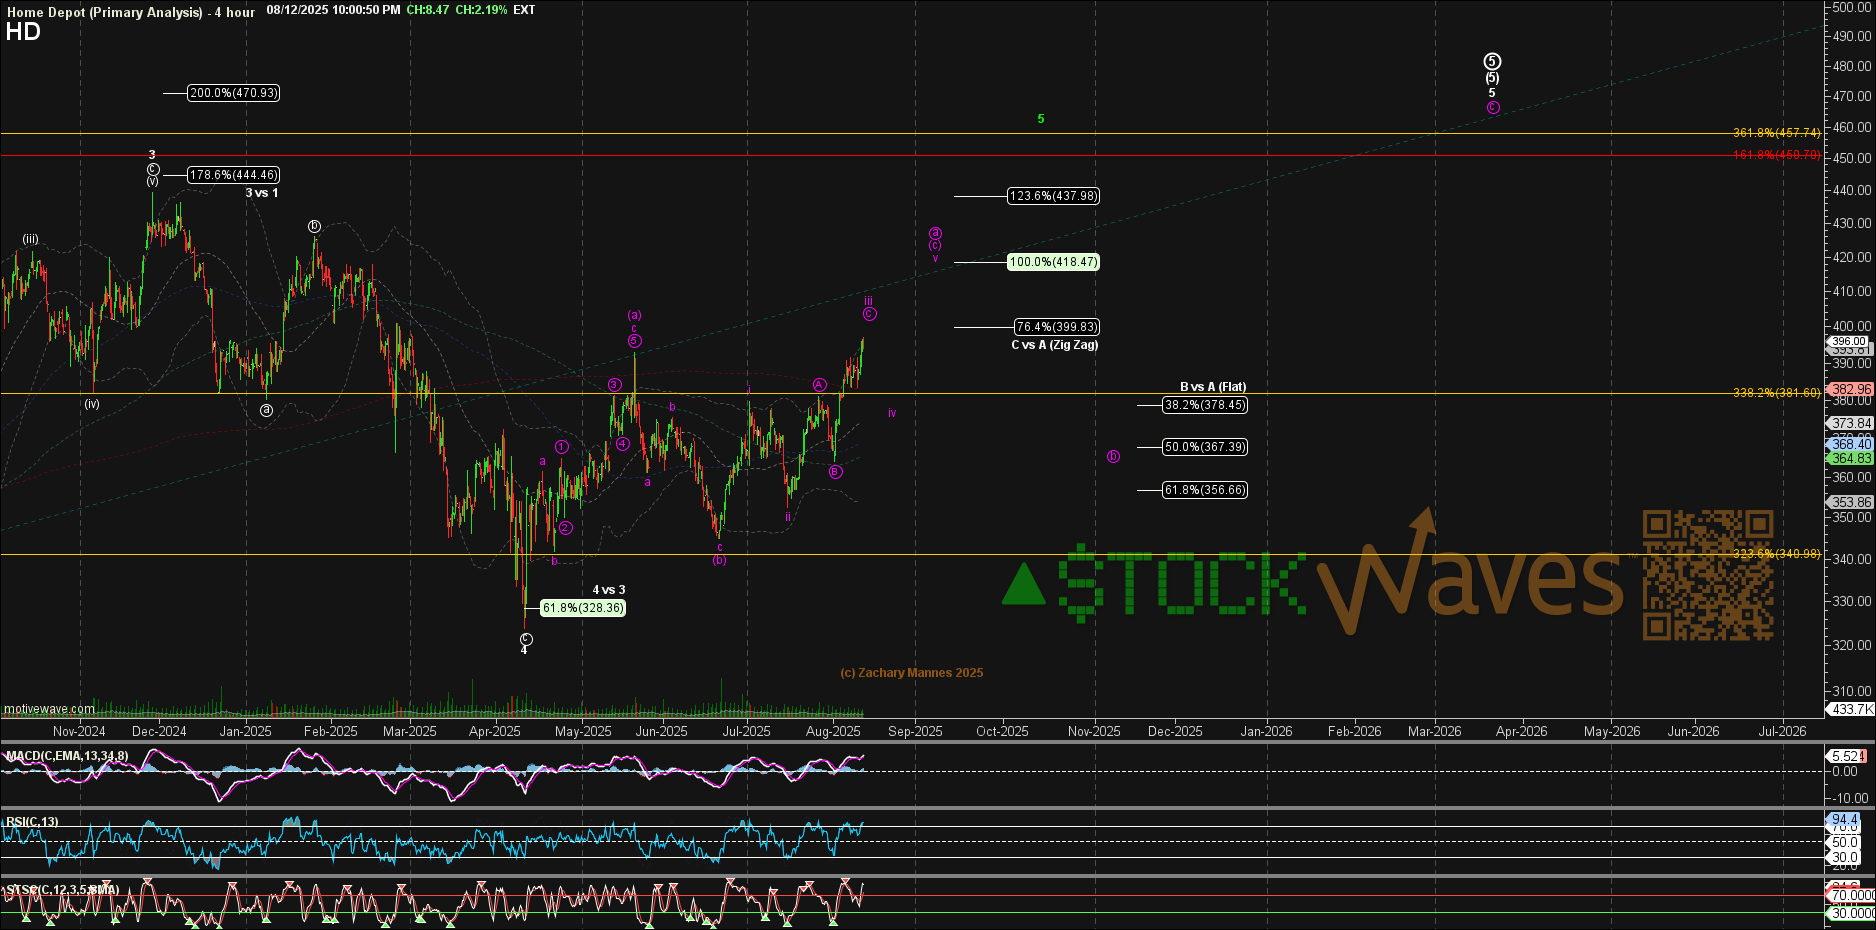
However, as you can readily see, HD, and LOW for that matter, are near completing almost identical patterns and are approaching an area where they may pull back somewhat significantly. Should support hold then we would anticipate the higher high as discussed. This prior chart is from the update on August 12 - let’s look at Zac’s most recent post.
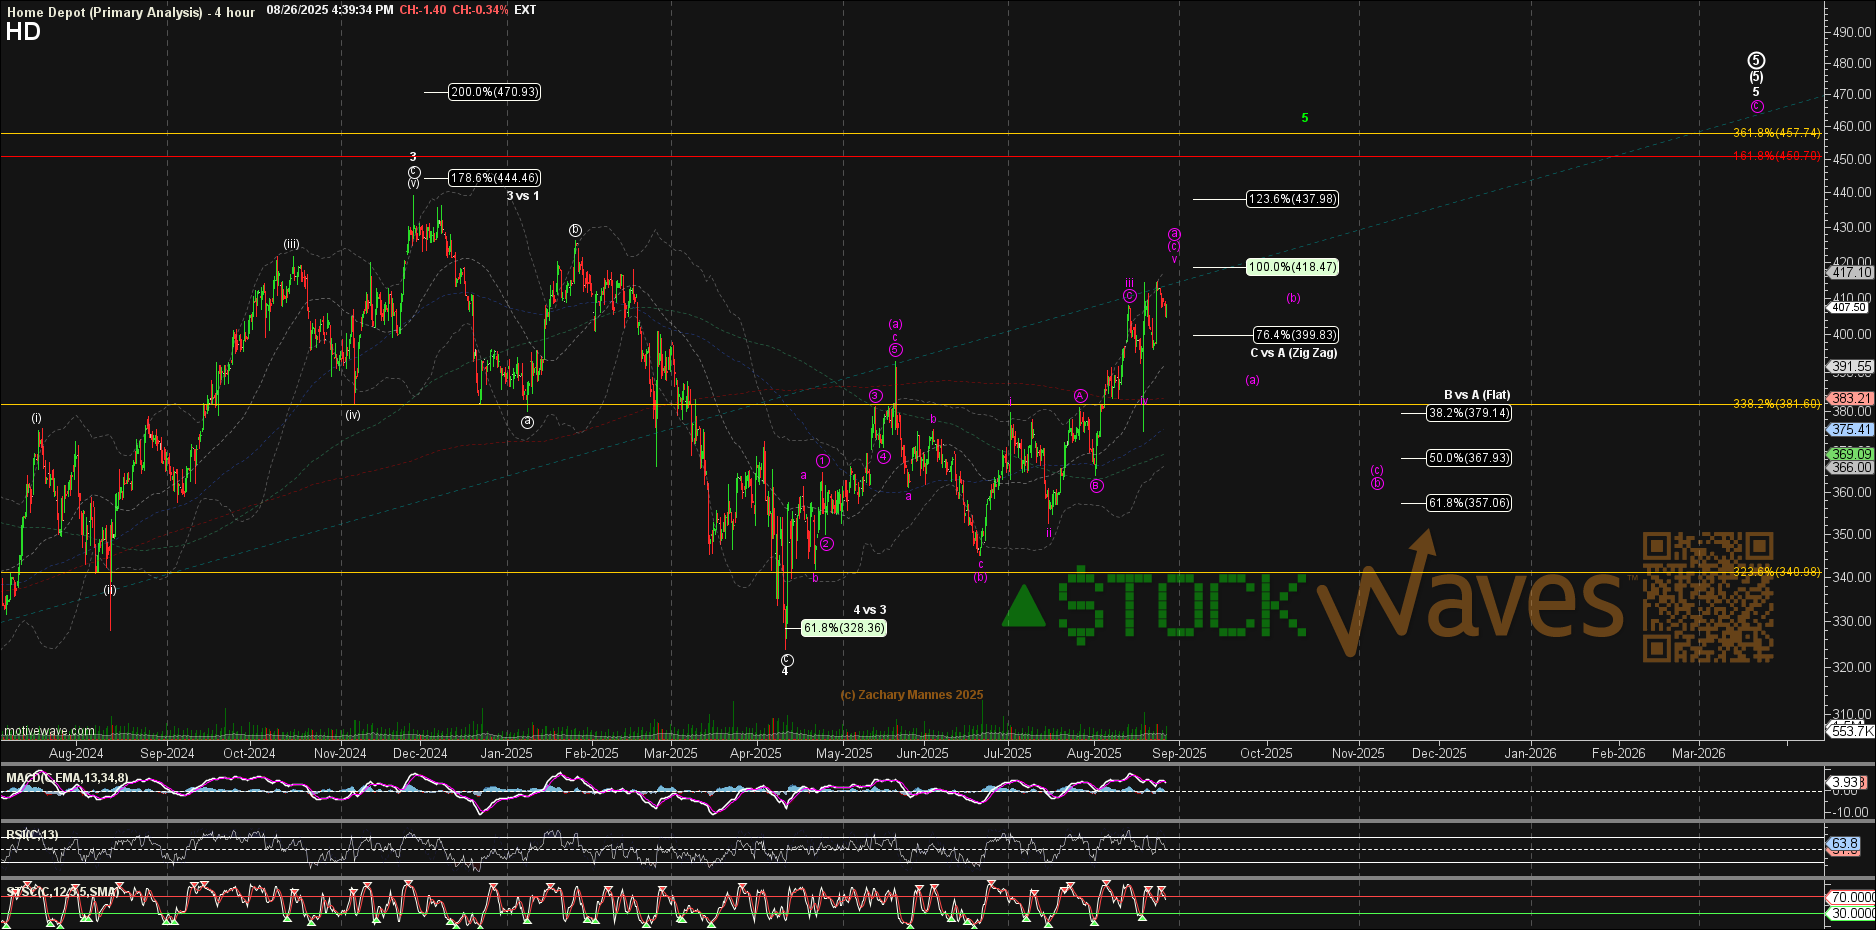
Note how the stock willingly complied with the projection and is inching toward that swing high shown as the circle ‘a’ wave of the larger wave 5. A circle ‘b’ wave naturally follows and may take price down to $357-$368 area next.
There are many ways that one could use this information. Perhaps some choose to hedge longer term holds. Others may seek an outright bearish setup. Looking forward just a bit, the higher probability bearish setup in this scenario would shape up after the (b) wave bounce and then waiting for an initial micro 5 wave decline from that (b) in a wave ‘i’ of (c) - a bounce in wave ‘ii’ of (c) would then show the risk versus reward for a likely wave ‘iii’ down. Stops could be placed at the high of the prior (b) wave.
Also, keep in mind the parameters shared above in the active Wave Setup for the larger bullish scenario still in play.
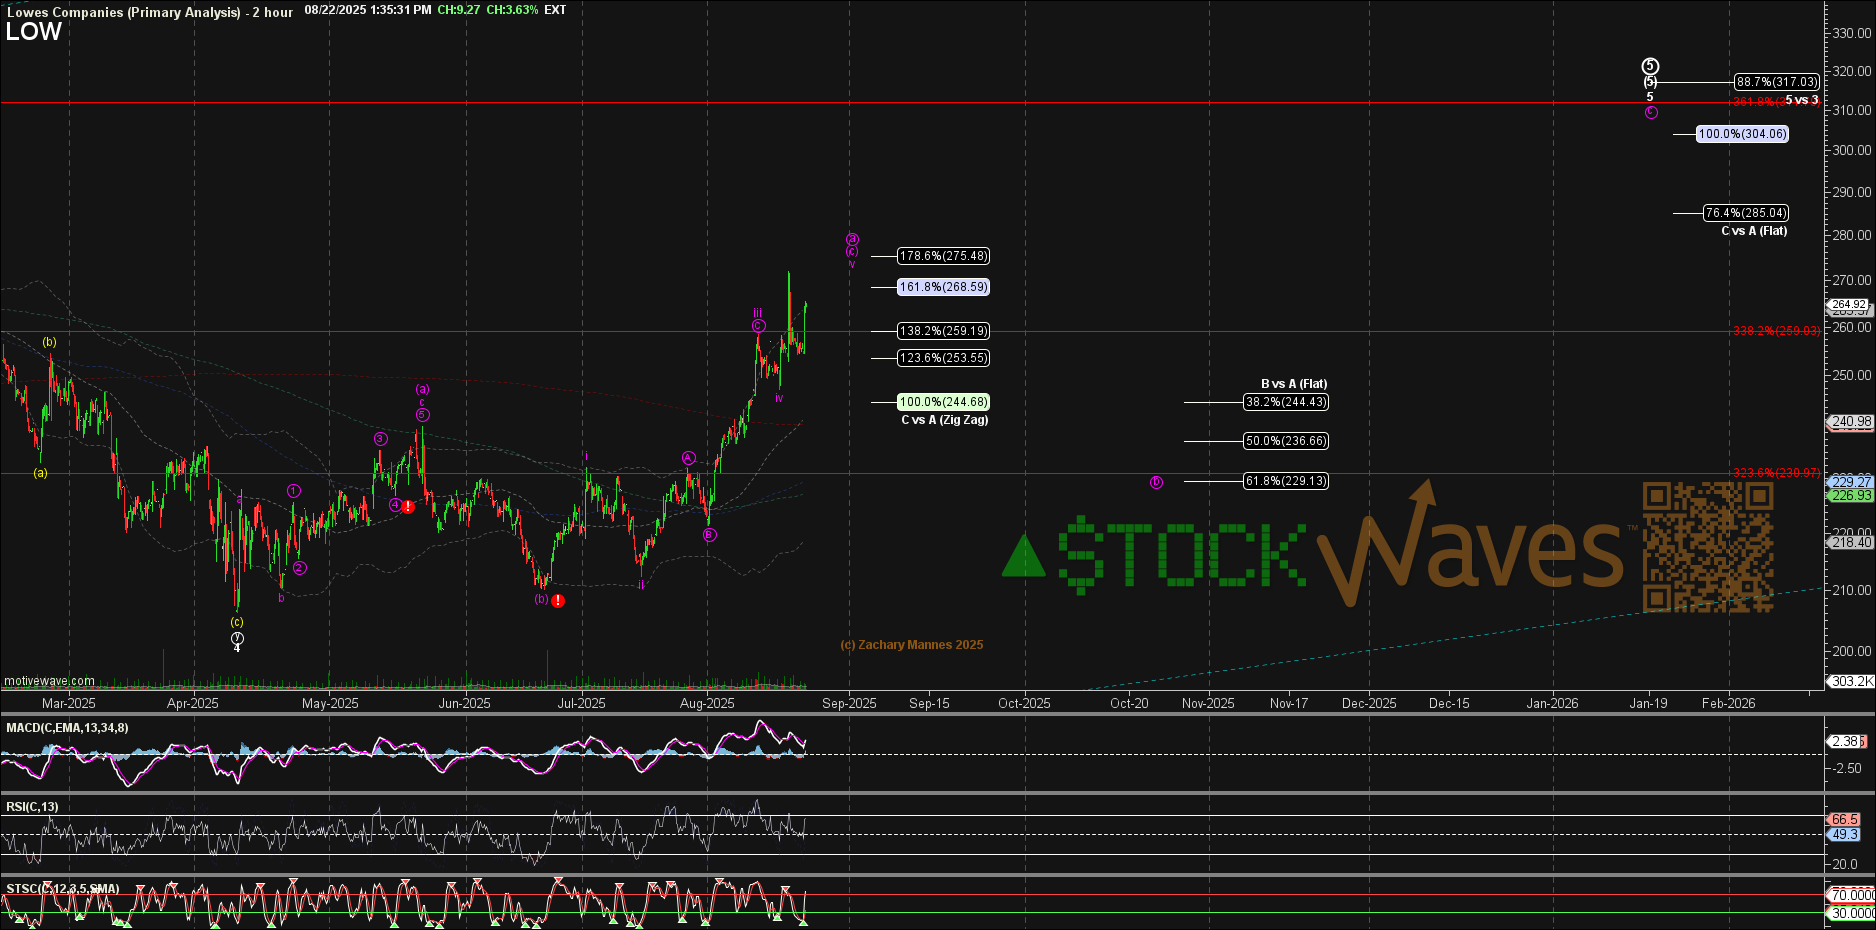
This chart for LOW is following a similar path as HD. A pullback is also anticipated.
This Methodology Provides Context
From all that we have observed in the field of analysis, Elliott Wave is the only method that can provide context at any moment in time. What do we mean by context? The literal definition is something like this:
“The surroundings, circumstances, environment, background or settings that determine, specify, or clarify the meaning of an event or other occurrence.”
Now, we can take that and color in the literal lines to give us a bit more understanding when it comes to the markets. Elliott Wave is based on the fact that markets are fractal in nature. These structures are variably self-similar at all degrees. This means that the smaller structure should basically agree with the larger structure and vice versa. In fact, this is a way that a technician can ‘check’ their own work by making sure the subwaves agree with the larger context.
It is also what gives this way of viewing the markets its true power. Take a look at how Avi Gilburt describes this in one of his educational articles regarding Elliott Wave Theory:
“Back in the 1930’s, an accountant named Ralph Nelson Elliott identified behavioral patterns within the stock market which represented the larger collective behavioral patterns of society en masse. And, in 1940, Elliott publicly tied the movements of human behavior to the natural law represented through Fibonacci mathematics.
Elliott understood that financial markets provide us with a representation of the overall mood or psychology of the masses. And, he also understood that markets are fractal in nature. That means they are variably self-similar at different degrees of trend.
Most specifically, Elliott theorized that public sentiment and mass psychology move in 5 waves within a primary trend, and 3 waves within a counter-trend. Once a 5 wave move in public sentiment has completed, then it is time for the subconscious sentiment of the public to shift in the opposite direction, which is simply the natural cycle within the human psyche, and not the operative effect of some form of 'news’.
This mass form of progression and regression seems to be hard-wired deep within the psyche of all living creatures, and that is what we have come to know today as the ‘herding principle’, which gives this theory its ultimate power.” - Avi Gilburt
Let’s unpack this just a bit more. Because markets are fractal and self-similar at all degrees, smaller patterns can be used to project the completion of larger structures. This is exactly what we do. It’s not based on voodoo or the reading of tea leaves. This is science and math that can track and project likely human behavior going forward.
Conclusion
We have specific price levels to provide guidance along the likely path as shared for HD and LOW stocks. Can these projections invalidate? Of course. And it’s OK to be wrong - just don’t stay wrong. Not all setups are certainties, just as projections are not prophecies.
Our preferred method of analysis has proved the most reliable that we have found and keeps us on the right side of the trade much more often than not. Nothing is perfect in this world, but for those looking to open their eyes to a new universe of trading and investing, aren’t you just a bit curious to know more about it? We are happy to share what we have learned with you.
Come see how we put this theory into practice every day!
