Grinding Upside Path For NDX
 By
By
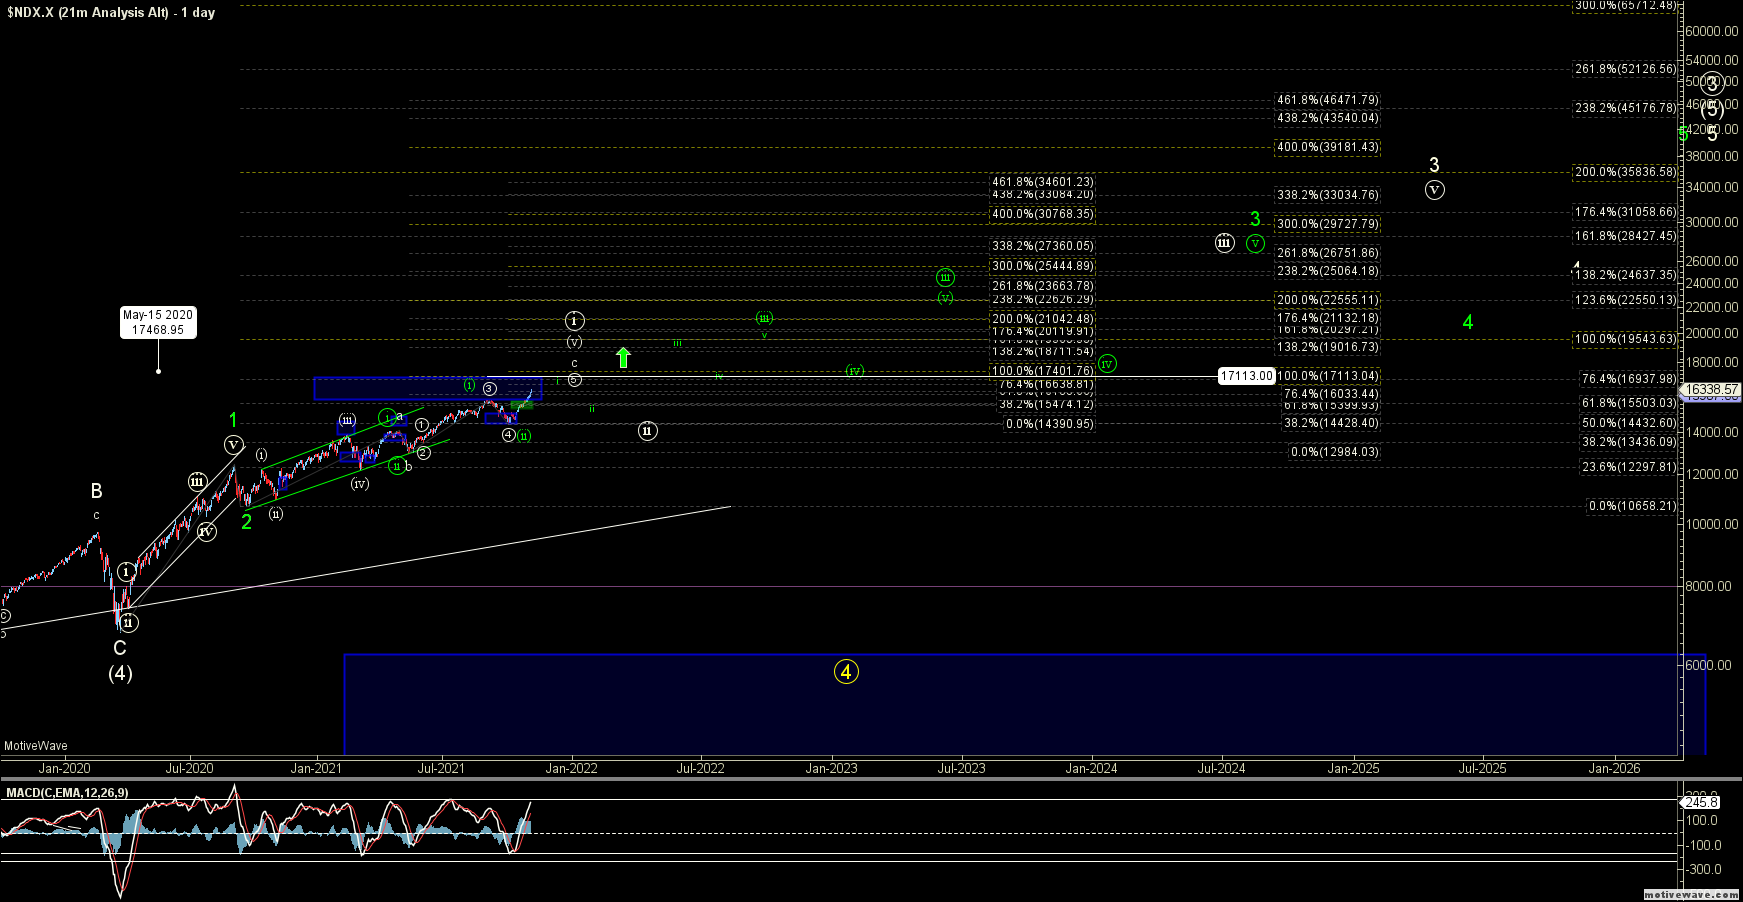
With this push to new highs on the Nasdaq 100 (NDX), we now have a potentially full pattern under the white path which I had been watching for some time. Under that case I would be expecting to see a pullback in this region before making a more sustained break higher over the next several years. Because we are at a point in which the pattern is potentially full, I spent quite a bit of time running through the fib calcs on this chart and am also going to present another path which is similar to the white path. However, the NDX would not need to see quite as deep or long of a pullback before breaking out higher under this other path.
After running through the fibs, I do think this green path is cleaner, so as long as we can maintain the support levels which I will lay out under this path, I am going to adopt this as my primary count at this point with the white count becoming the alternate. I do want to note that while both paths are ultimately bullish, there still is certainly the potential to see a pullback in the not-too-distant future. But based on where we are within these counts (heart of a third of a third bigger picture), those pullbacks can certainly be shallow in nature.
Under both the green and white counts I am counting the move up off of the March of 2020 low as having topped in a wave 1 in September of 2020. Where the two paths differ is where the next nested wave ((i)) of 3 lies. Under the white path, I am counting the entire move up off of the September of 2020 low (bottom of wave 2 same fore both counts) as one larger leading diagonal for the wave ((i)) of 3. Under the green path, I am counting that same wave ((i)) of 3 having already topped back in April of this year.
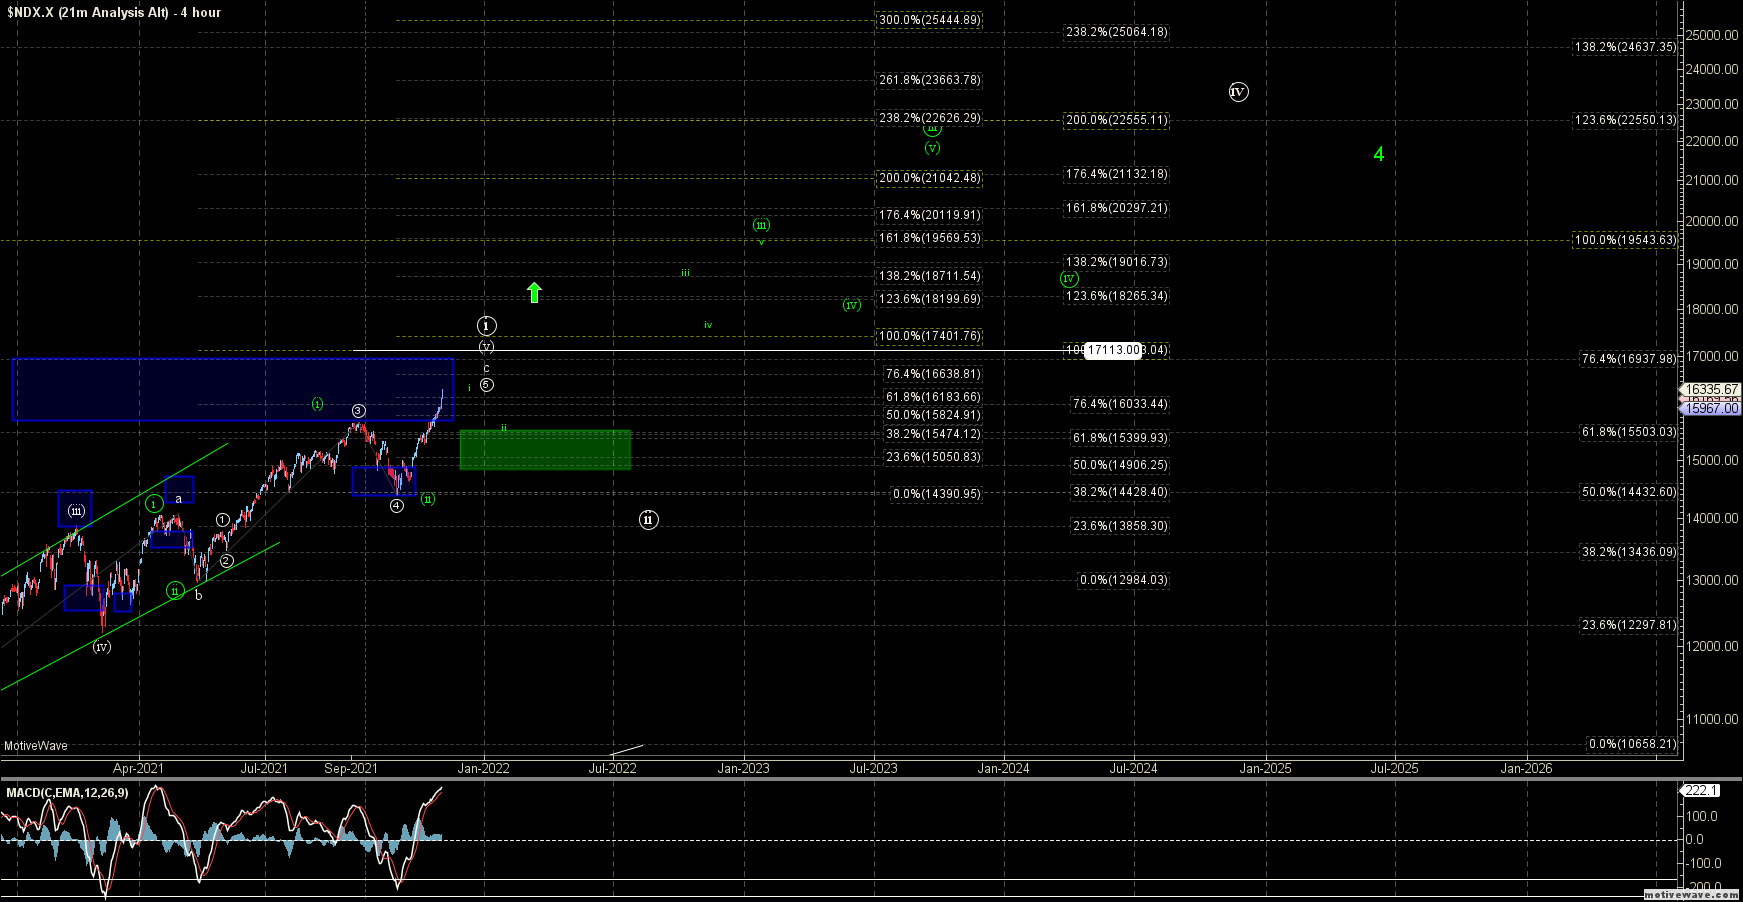
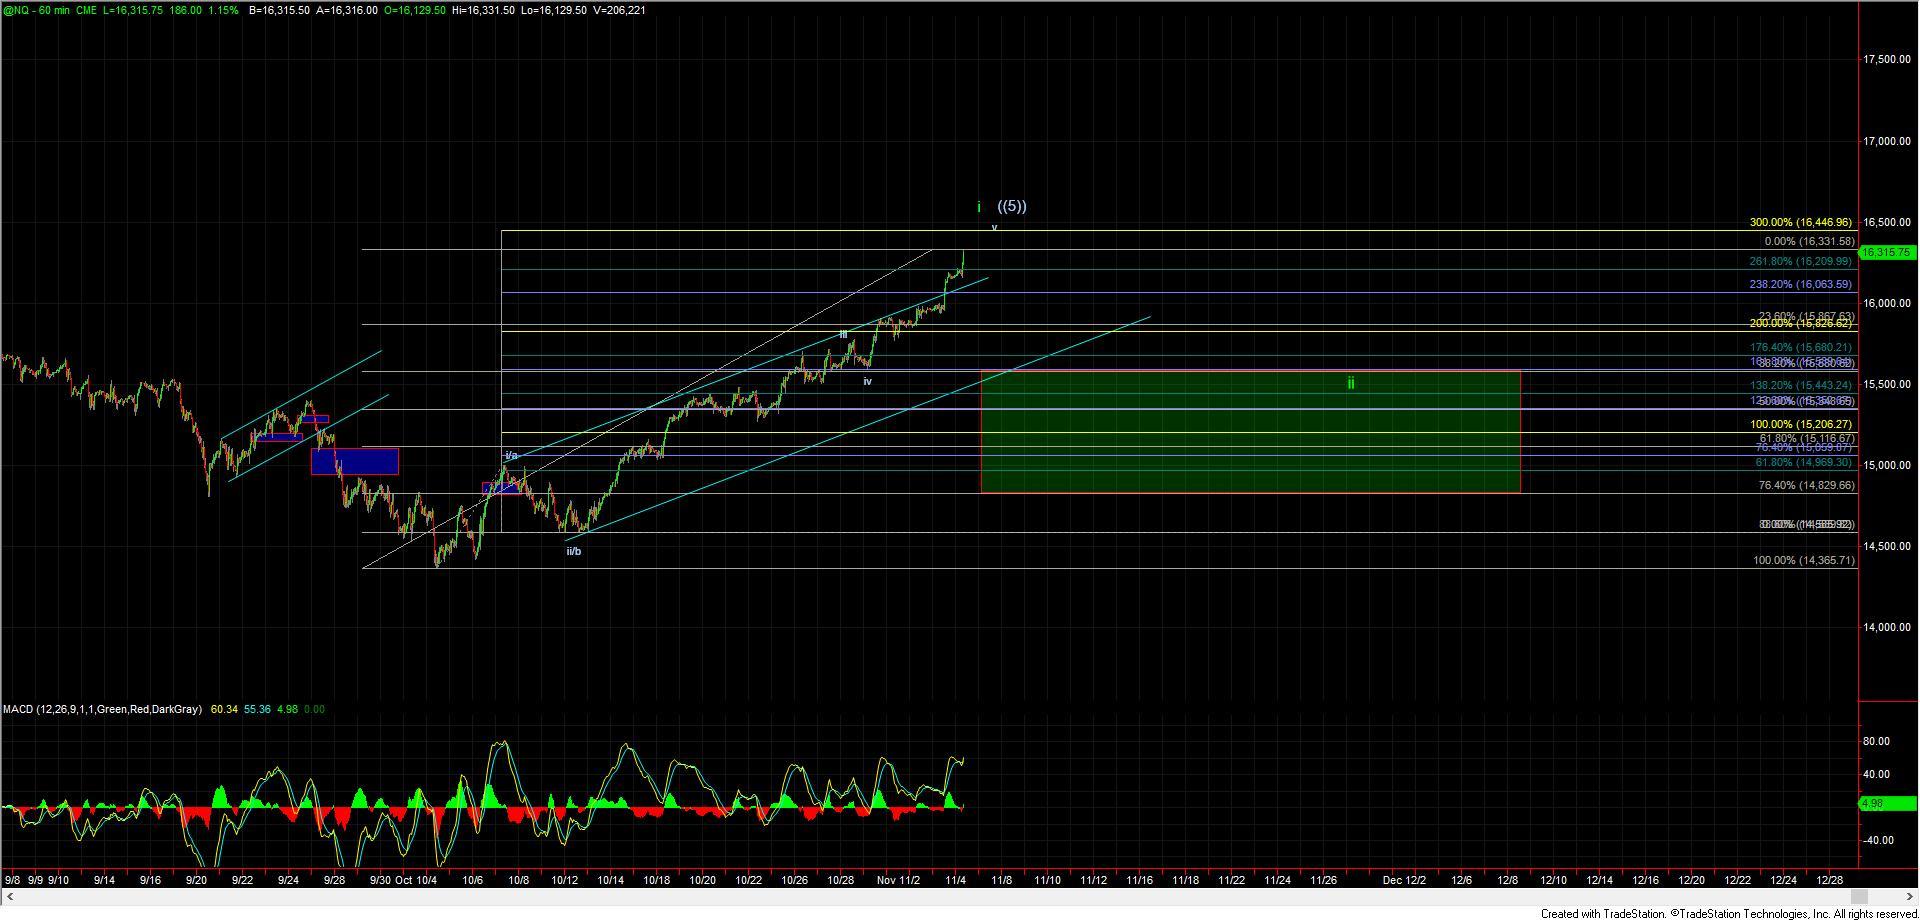
That green wave ((ii)) then would count as very shallow, thus already putting us in the heart of the wave ((iii)) of 3 up on the NDX. This part of the wave structure would typically be characterized as having fairly shallow pullbacks as we entire a grinding upside path towards the larger degree targets. So far this is what we have seen. From a fib pinball perspective, this green path does work quite well although I do not love the fact that the potential wave ((ii)) under this path was so shallow. So, for this reason, I am still going to keep the white count, on the charts for now, although if we see a breakout over the 17,113 level then I will no longer view this white path as viable.
Although the green patter is still ultimately quite bullish, we are heading into a region that has resistance on multiple degrees. This could suggest that we will see a pullback for either the green wave ii or the larger degree wave ((ii)) if we are indeed following the white path. Just keep in mind and especially if we are following the green path these pullbacks could certainly be fairly shallow from a fib perspective.
If we are following the white path, then we could see a bit deeper of a pullback as laid out on the NDX chart. However, as long as this can maintain over the 15,566-14,829 zone on any pullbacks, the green path will remain my base case. If, however, we were to see a break of that zone, then it would give us the initial signal that we may indeed be seeing that deeper pullback under the white count ,which again would likely see a longer and more drawn out corrective pattern as we head into the end of the year.