Gold: Ready For Blast-Off
 By
Zac Mannes
By
Zac Mannes
Contributed by Steven Kirkpatrick, produced with Avi Gilburt.
If you think that now may be a good time to invest in gold, you may very well be right. But more than likely, you will be right for the wrong reasons. Indeed, there's more confusion and misunderstanding about gold prices than any other investment I can think of. We presently have a bullish outlook for gold and other precious metals, but not for the reasons most people expect.
A great many analysts and pundits like to draw correlations between various exogenous factors that will cause the price of gold to rise or fall. I submit to you that almost every one of these analysts is wrong.
Perhaps you’re familiar with the TV show “MythBusters.” It's often silly, but always entertaining. They never did a show about what impacts the price of gold, but if they did, it would likely begin as follows:
Myth – There are several different exogenous factors that impact the price of gold. When properly analyzed and understood, it's possible to determine the most opportune time to buy gold. Some of these factors include: Employment, money supply, inflation, the strength of the dollar, central bank activity, interest rates, economic recessions and expansions, etc.
Are you ready? OK, let’s do some MythBusting!
MythBusting #1 – Money Supply Affects Gold Prices
Between March 1, 2020 and Oct. 1, 2022, the money supply increased by a whopping 40%, by far the biggest increase in such a time frame since World War II. In spite of this massive increase in the money supply, the price of gold actually fell during this period, from $1,715 per ounce to $1,632, a decline of almost 5%.
More recently, the price of gold has bounced around near $2,000 per ounce while the money supply has dropped by about 6%. Still, one might think that, with such a such a huge increase in the money supply, the price of gold would go up quite a bit. But it turns out that there's essentially no meaningful correlation between money supply growth (as measured by M2), and the price of gold. See for yourself:
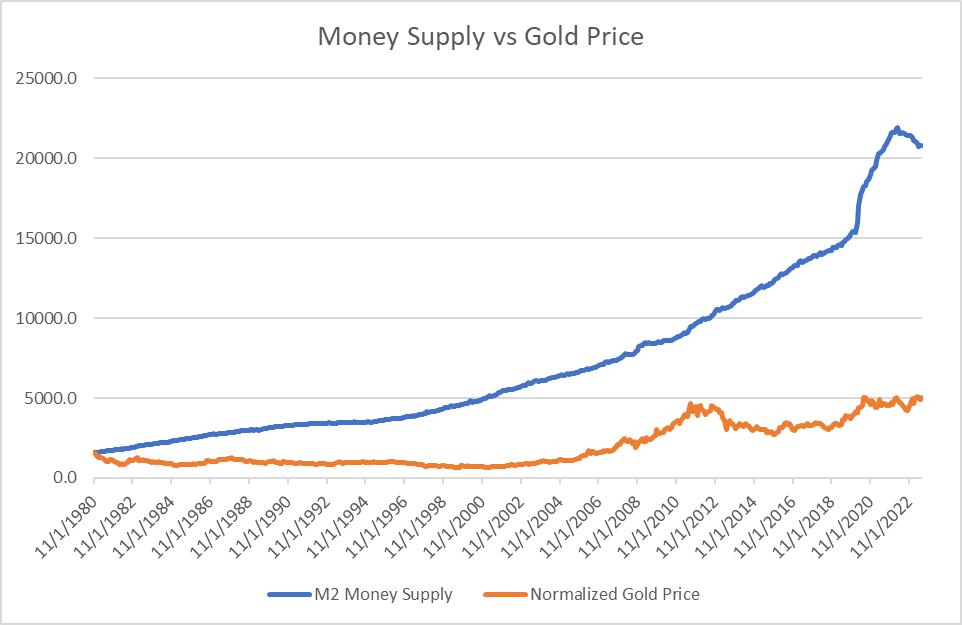
Money Supply vs Gold Price (Federal Reserve Bank of St. Louis)
I have normalized the gold price data in this chart to match the money supply at the start of the timeline (November 1980), which effectively multiplies the actual price of gold by 256%. This makes the comparison – and lack of correlation – easier to see. Notice that the massive increase in money supply beginning in 2022 has had no impact on the price of gold.
MythBusting #2 – Recessions Impact Gold Prices
I’m sure you’ve heard comments like this many times: “Gold is a good investment during a recession.” The thesis behind this argument is that stock prices go down during recessions, and gold is a safe place to weather the storm. Sorry, but that’s wrong. Recessions have essentially no impact whatsoever on the price of gold, as shown below:
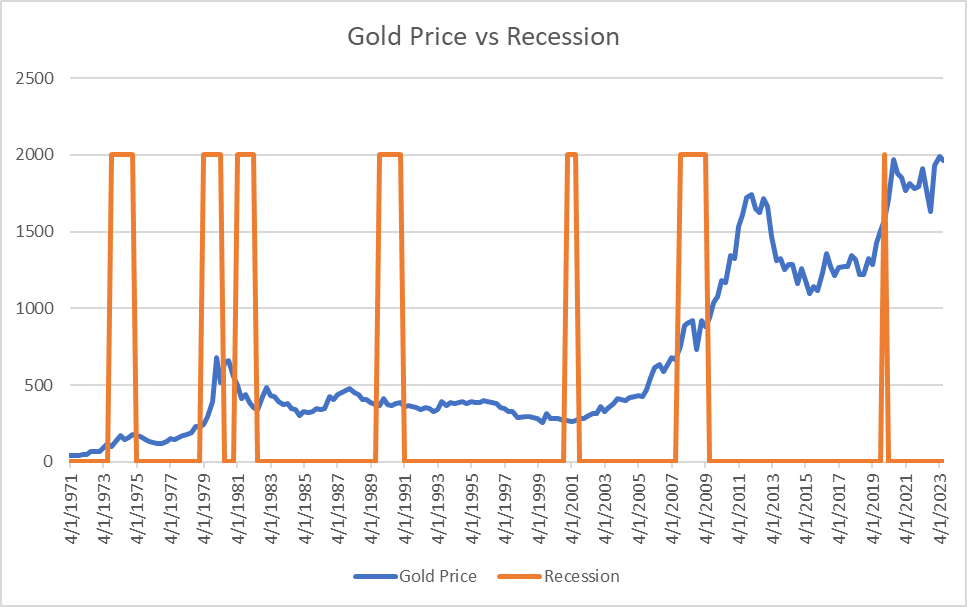
Gold Price vs Recession (St. Louis Federal Reserve)
Can you find an “cause and effect” relationship between gold prices and a recession? I can’t.
MythBusting #3 – The Value of the Dollar Affects the Price of Gold
Another commonly cited reason for the price of gold to change is based upon the premise that a weakening dollar is bullish for gold, while a strong dollar is bearish.
The theory is quite simple: If the dollar is strong today, and goes down tomorrow, then – ceteris paribus – you can buy more gold today than you can tomorrow. That suggests that when the dollar is stronger, gold prices should be higher. That sounds logical, but it isn’t true. Over the past 40 years, the value of the dollar (i.e., DXY) has ranged from a high of about 160 (February 1985) to a low of 72 (March 2008).
In recent weeks the dollar has been trading in the range of approximately 100 to 105. Here is the value of the dollar compared to the price of gold:
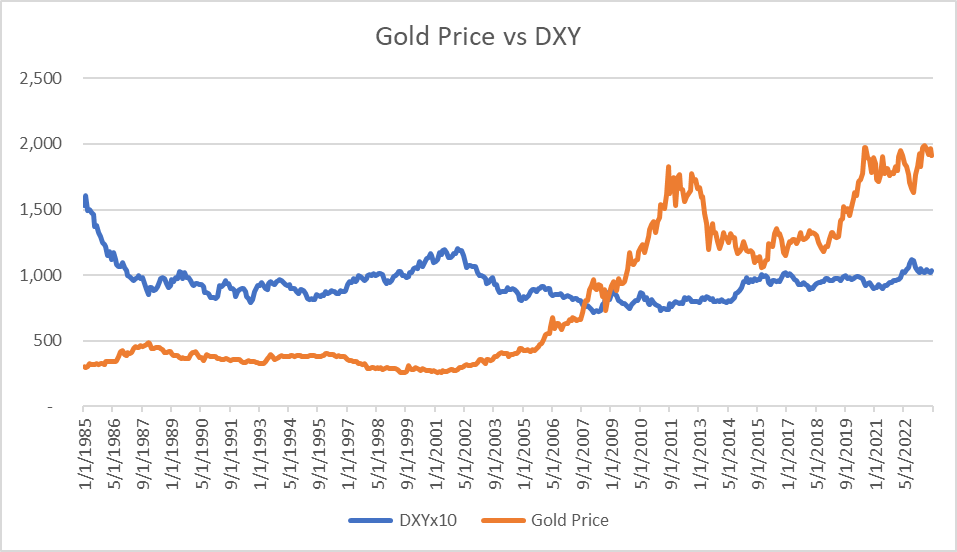
Gold Price vs DXY (St Louis Federal Reserve)
Note that I have multiplied the actual value of DXY by 10 to make the lack of correlation easier to see. Clearly, the value of the dollar does not affect the price of gold.
MythBusting #4 – Inflation Will Cause Gold Prices to Rise
It's almost universally considered a fact that gold is a good hedge against inflation. The only problem with this thesis is that, for most of us, it simply isn’t true. Take a look:
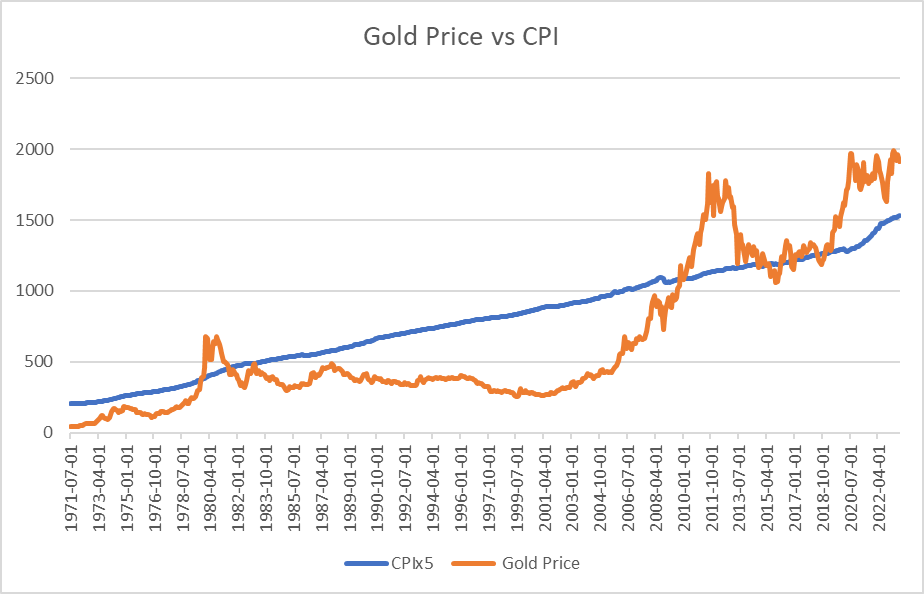
Gold vs CPI (St Louis Federal Reserve)
Note that I have multiplied the CPI data by five to make the lack of correlation easier to see. There's a vague correlation in that both CPI and gold prices go from lower left to upper right, but all of the relatively sharp swings in the price of gold have no connection with changes in CPI.
You may be old enough to remember that there was a significant period of inflation that began in the late 1960’s and continued for decades. Does this mean gold was a good investment at that time? As noted by Robert Prechter in his book The Socionomic Theory of Finance:
“Inflation continued during the decade from 1970 to 1980, and gold and silver soared… Inflation continued from January 1980 to April 2001, during which time the money supply nearly tripled. But gold and silver lost a stunning 83% of their combined value during those 21 years…”
People who feared inflation in January 1990 were right. Yet gold and silver investors lost dollar value for two decades and lost even more buying power because the dollar itself was losing value against goods and services, and they lost even more wealth in the form of missed opportunities in other markets. Gold and silver’s bear market produced a 94% loss in terms of these metals purchasing power of goods and services…”
Wow! Now, ask yourself: How many times in the past few years have heard and read about gold as being a great hedge against inflation? But what about Turkey? And also Venezuela, Egypt, Iran, Argentina – and all those other countries with high rates of inflation? Again quoting Robert Prechter: “The only monetary condition under which people reliably – and quite sensibly – prefer gold over money is hyperinflation.”
MythBusting #5 – Higher (or Lower) Interest Rates Will Cause Gold to Rise
I have seen analysts and pundits argue both sides of this myth, but trying to connect gold prices to interest rates is a losing man’s game. Take a look:
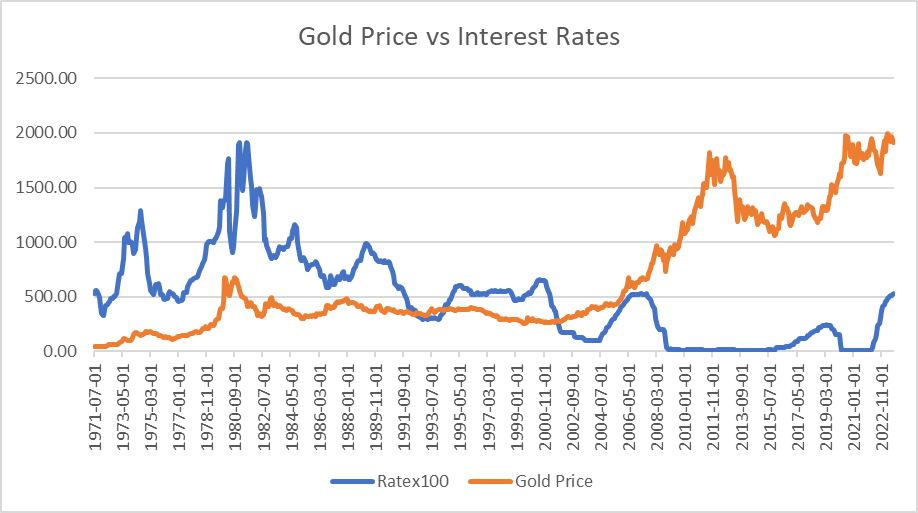
Gold vs Rates (St Louis Federal Reserve)
Note that I multiplied the actual interest rate by 100 to make it easy to see relative to gold prices. There appeared to be some correlation during the late 1970s into the early 1980s, but it then becomes quite obvious that this pricing was coincidental and not correlational.
MythBusting #6 - Gold Prices Will Soar if China Attacks Taiwan
Sure, it’s possible, but consider that the biggest war in Europe since WW II began when Russia attacked Ukraine in February 2022. One month before the invasion, the price of gold was $1,796 per ounce. Six months after the invasion, in August 2022, gold was selling for $1,708 per ounce. Go figure.
MythBusting #7 - Central Banks Buying Gold Is a Bullish Indicator for Gold
Wrong again. Central banks have been net buyers of gold for the past 12 years, including a staggering 1,130 metric tons in 2022, by far the most of any year in records going back to 1950 (Source: Reuters). Even so, in May 2022, as the buying was underway, the price of gold was $1,847 per ounce, and by the end of the year, it was selling for $1,824 per ounce. Again quoting Robert Prechter: “The common sense conviction that direct, heavy central bank buying or selling of an asset would force its price to rise or fall is flat-out wrong.”
If you’re starting to feel a bit confused about what really determines the price of gold, you’re not alone. But if exogenous events don’t impact the price of gold, what does? And why, for example, did the price of gold increase by over 550% in 10 years ending in August 2011, and then fall by 40% over the next four years? Relax, dear reader, because we have the answer. It’s called Elliott Wave analysis.
Conceptually, Elliott Wave analysis can be explained in rather simple terms. To wit: Prices for speculative investment assets, notably stocks and precious metals tend to move in distinct, wave-like patterns that repeat in various fashions over time. A skilled analyst, in looking at past prices, can often make startlingly accurate predictions of future prices by analyzing these wave patterns.
What actually drives the price of speculative assets – including gold – is little more than sentiment, but what exactly does that mean? Simply speaking, sentiment is a subtle, subliminal mood or outlook about the market, including optimistic and pessimistic drivers that form our attitudes and behaviors toward investing.
Elliott Wave patterns are precisely that: Patterns. Suffice it to say that these patterns – these waves – give us clues as to where price action is likely to go. We are not always right, but our analysis puts us on the right side of a trade far more often than not.
Avi Gilbert uses Elliott Wave analysis to anticipate future price action in gold that goes back more than 20 years. For example, as gold began its meteoric rise around 2001, Avi identified a price peak in 2011 – and also predicted where gold would decline from there – well before the peak was reached.
Subsequently, on December 30, 2015, Avi wrote the following message to his readership:
"As we move into 2016, I believe there is a greater than 80% probability that we finally see a long-term bottom formed in the metals and miners and the long term bull market resumes. Those that followed our advice in 2011, and moved out of this market for the correction we expected, are now moving back into this market as we approach the long term bottom. In 2011, before gold even topped, we set our ideal target for this correction to be a decline of $700-$1,000 in gold. We are now reaching our ideal target region, and the pattern we have developed over the last four years is just about complete. . . For those interested, I would highly suggest you start moving back into this market with your long term money..."
Gold jumped by more than 60% over the next few years, hitting $2,028 per ounce in August 2020.
From there, gold meandered downward for about two years. Subsequently, on Sept. 22, 2022, Stock Waves analyst Zac Mannes presented the following chart which indicated that (NYSEARCA:GLD) was about to hit a low point. Indeed, it bottomed out at $151 per share the following month, just as expected. But take a closer look a “P.5” on the chart showing GLD soaring to over $200 per share in late 2024. It now appears that we are well on the way to hitting this target.
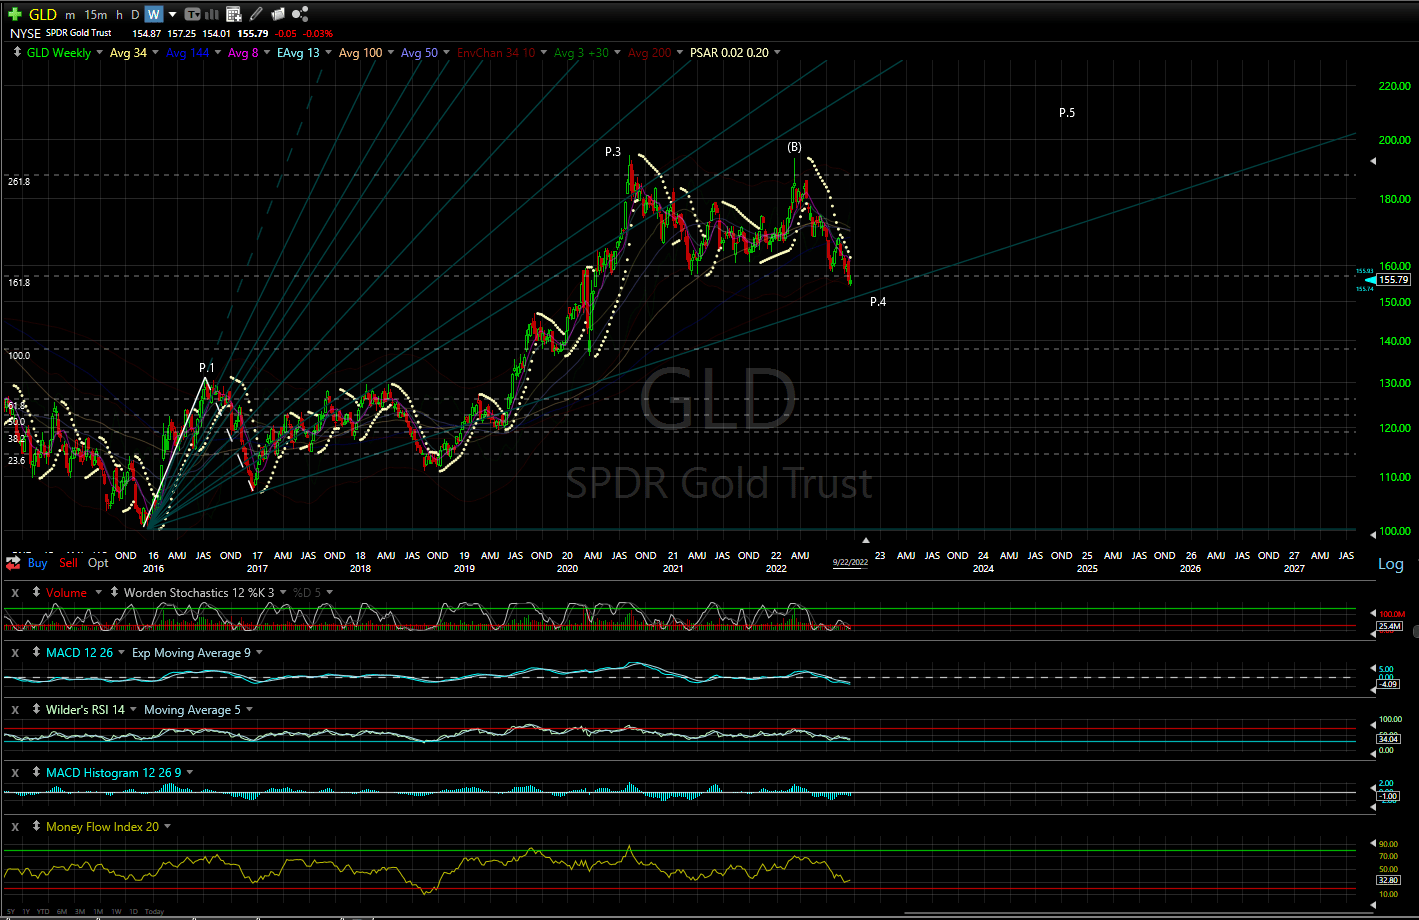
GLD chart by Zac Mannes Sep 2023 Wkly (EWT)
If anything, GLD may well achieve this price point a bit sooner than we expected. Avi’s chart that was presented on Dec. 27, 2023, (shown below) tells us that a strong rally in gold will get underway as we move into 2024, with a minimum target to eventually reach the $2,428 region. (You might want to write this down and make a note to check your calendar in about a year or so.)
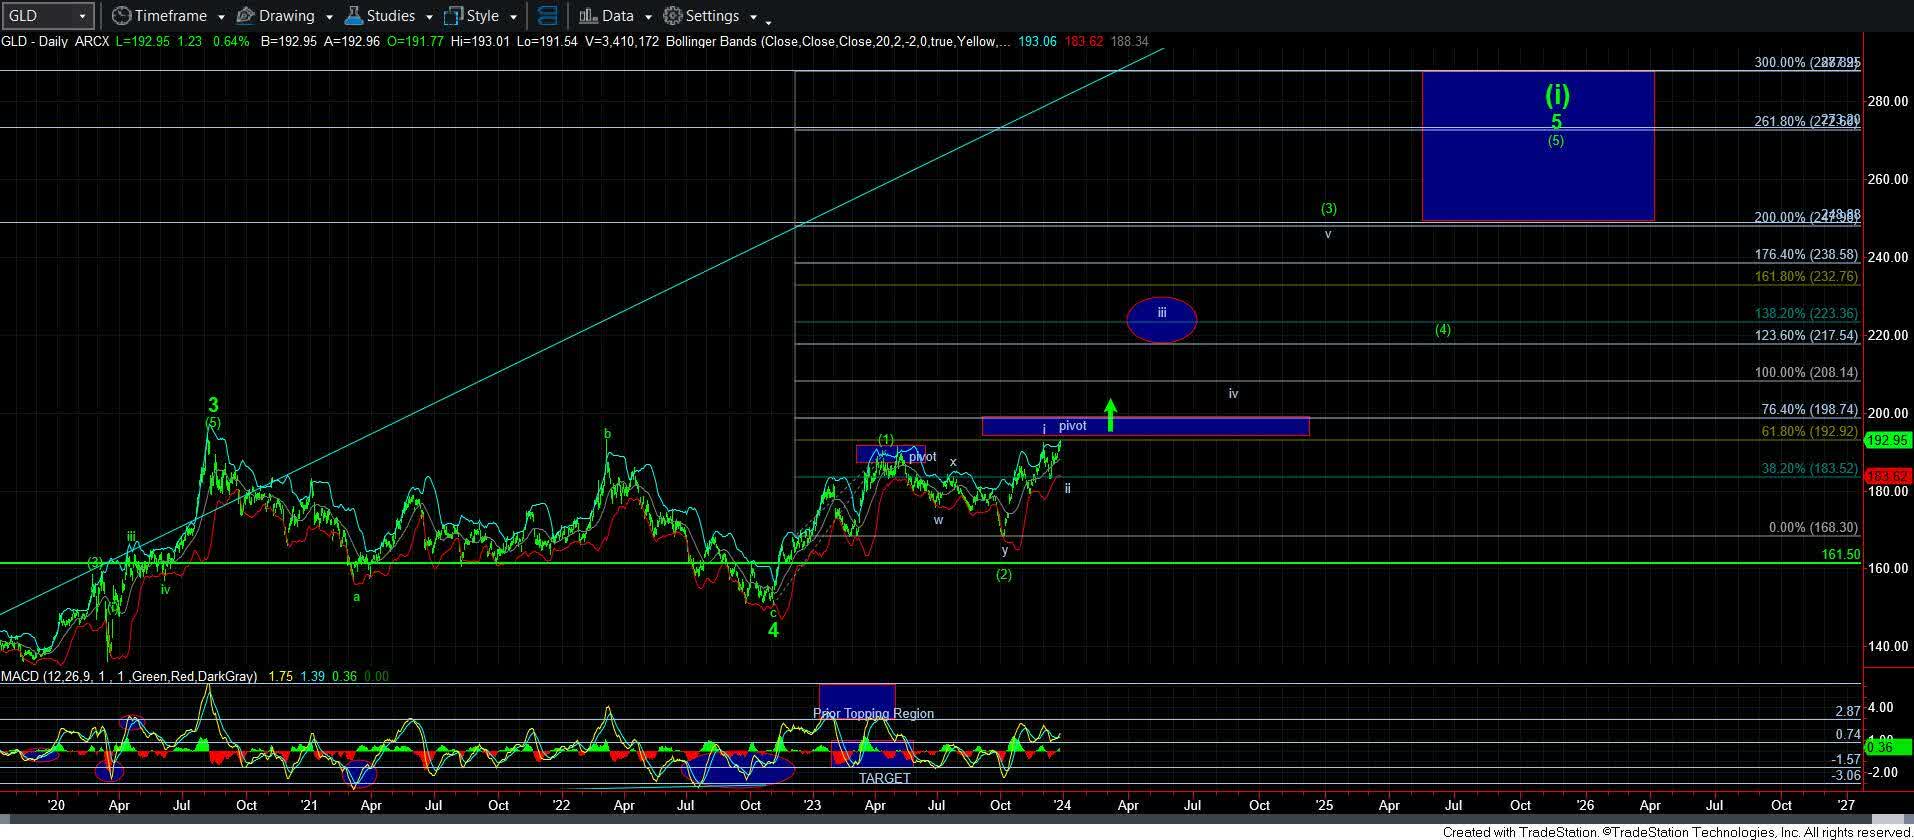
GLD chart by Avi 12-27-23 (EWT)
But note also that we often see very strong extensions during rallies in precious metals, so it's entirely plausible that gold will go as high as the $2,700 region before the next multi-year correction begins.
