Getting A Bit More Complex
While the metals market provided us with another bounce, the structure of that bounce was not at all indicative of a standard c-wave rally, which would have completed a larger b-wave bounce. You see, c-waves are most often 5-wave structures. And, thus far, all we have seen is another 3-wave bounce. This leaves the door open for several paths.
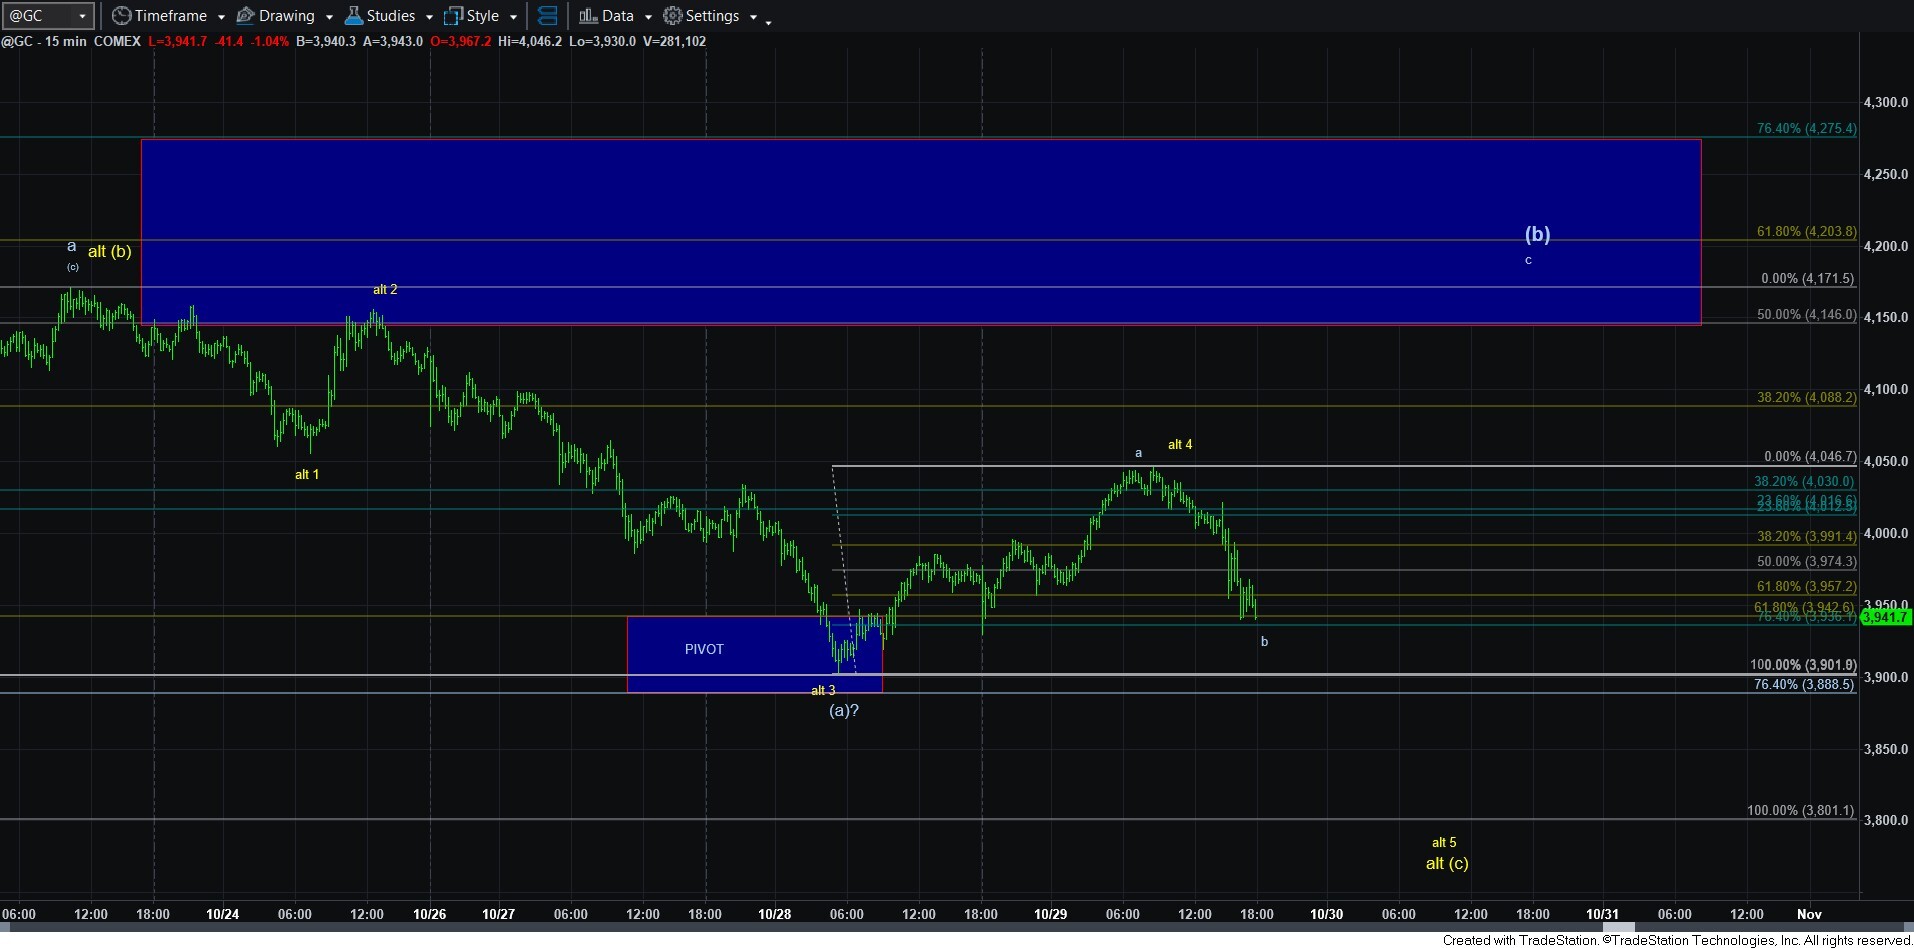
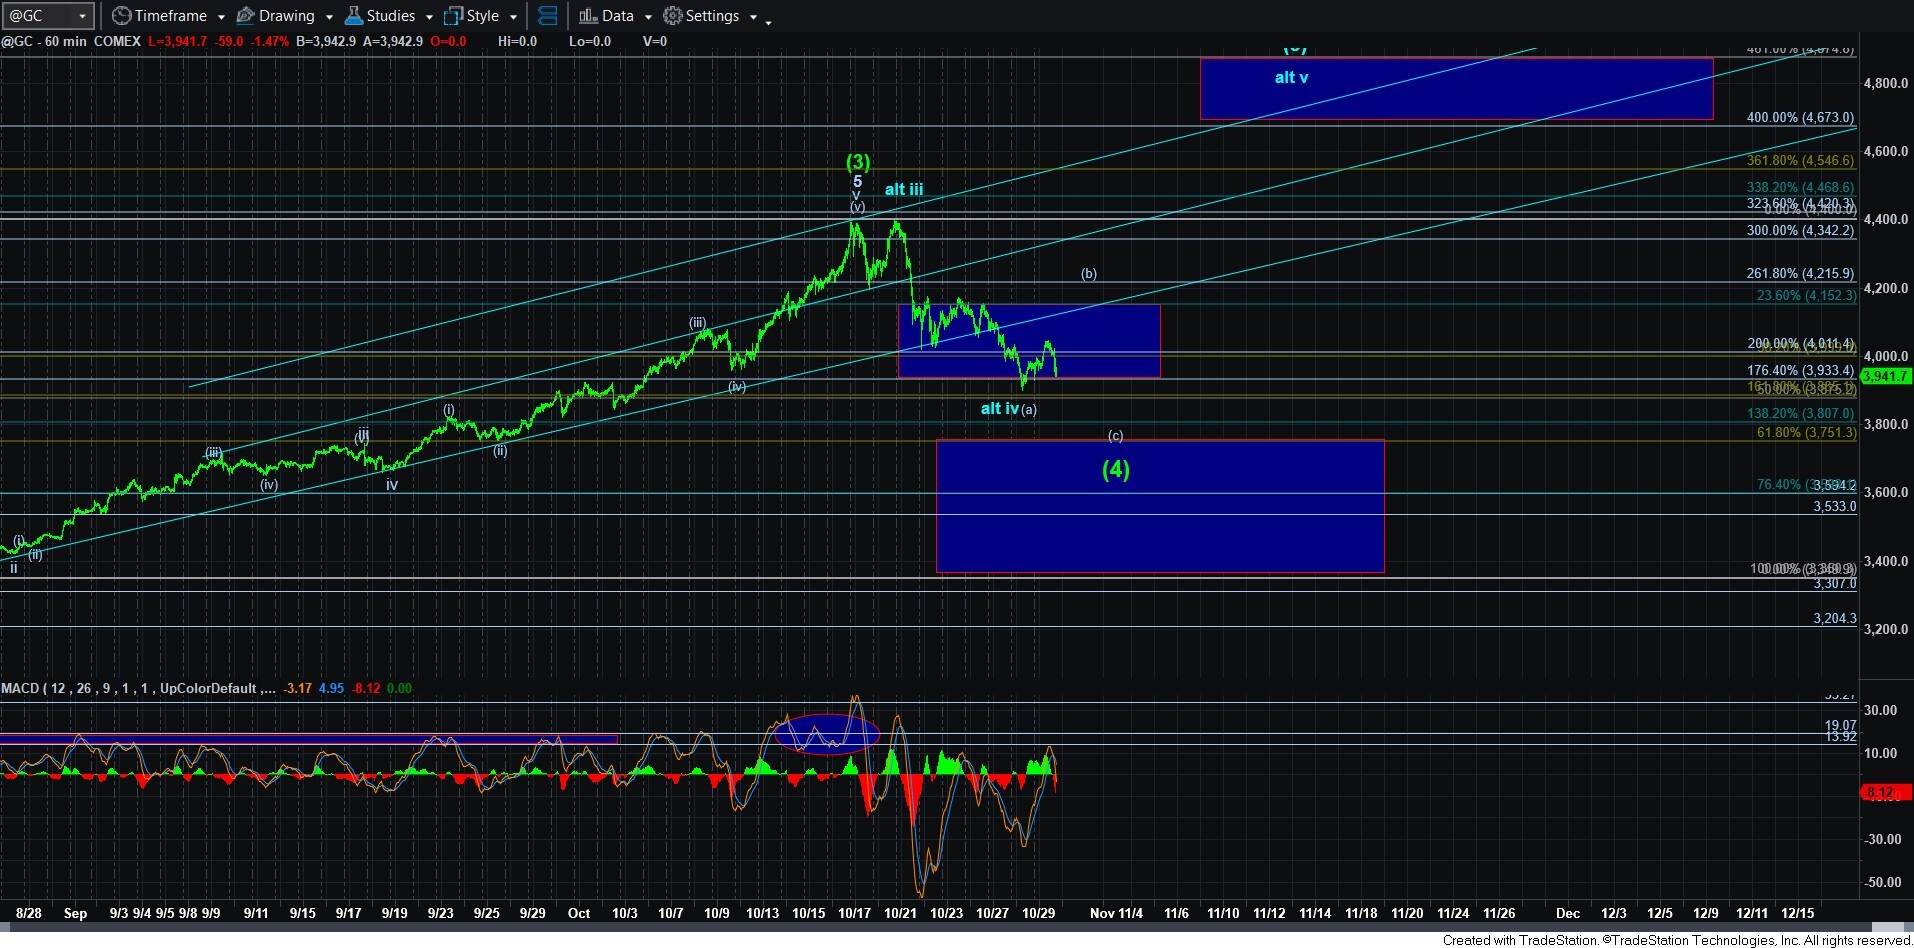
Let’s start with gold. As you know, I am trying to track a (b) wave bounce, which would set up a (c) wave decline. However, if we are going to see a (b) wave bounce taking us higher in the coming days, we are now at important support for a b-wave within that structure. Ideally, we should be holding over 3930 in gold in the overnight market, and begin a 5-wave rally for the c-wave of the (b) wave.
The alternative is now being presented in yellow, wherein the (c) wave is already in progress, and it is taking shape as an ending diagonal. The ideal target for that is the 3800 region wherein we have an (a)=(c) target. Should we follow that path, the next question we will have to determine is if that is all of wave (4) (as it is a bit short of the ideal target box for wave (4)), or is it just a bigger a-wave of wave (4)? I cannot answer that question at this time.
The one other point I would like to make is that the alternative in blue would have a lower likelihood to the point I would take it off the chart should we break down to the 3800 region. Moreover, it is also less likely since we did not begin this rally with a clear 5-wave structure, so it is hard to assume that wave v in blue has begun without that 5-wave structure.
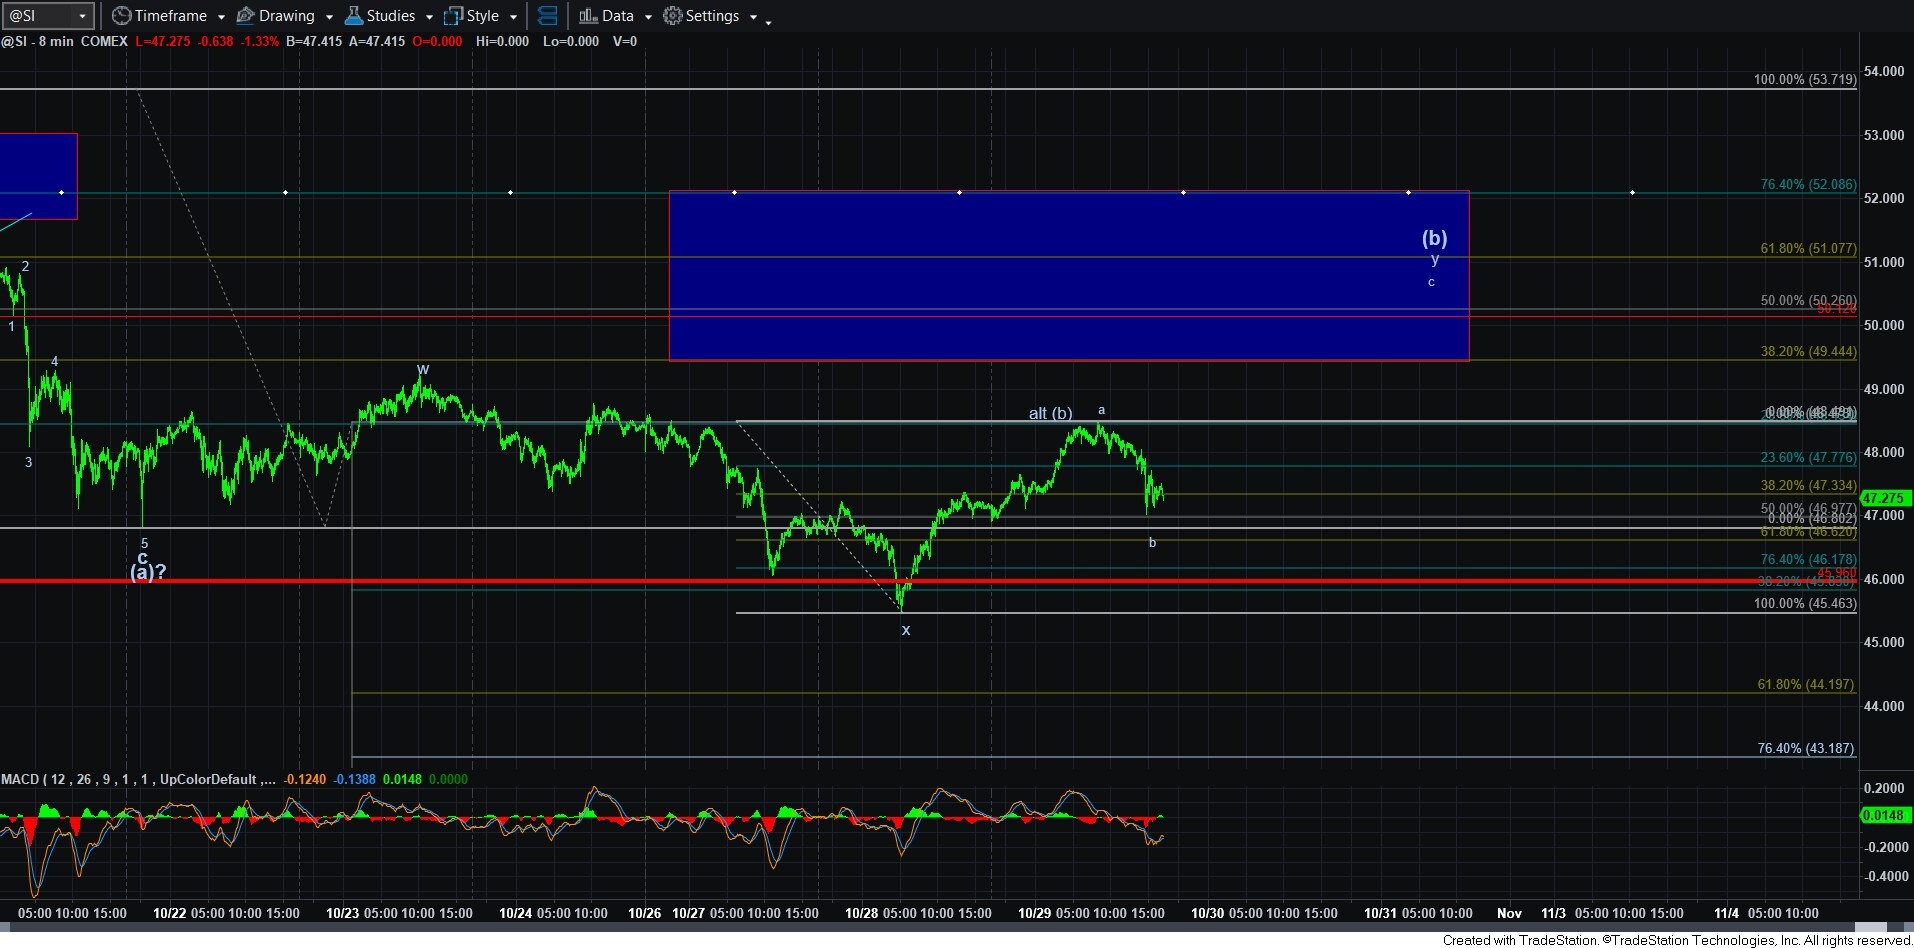
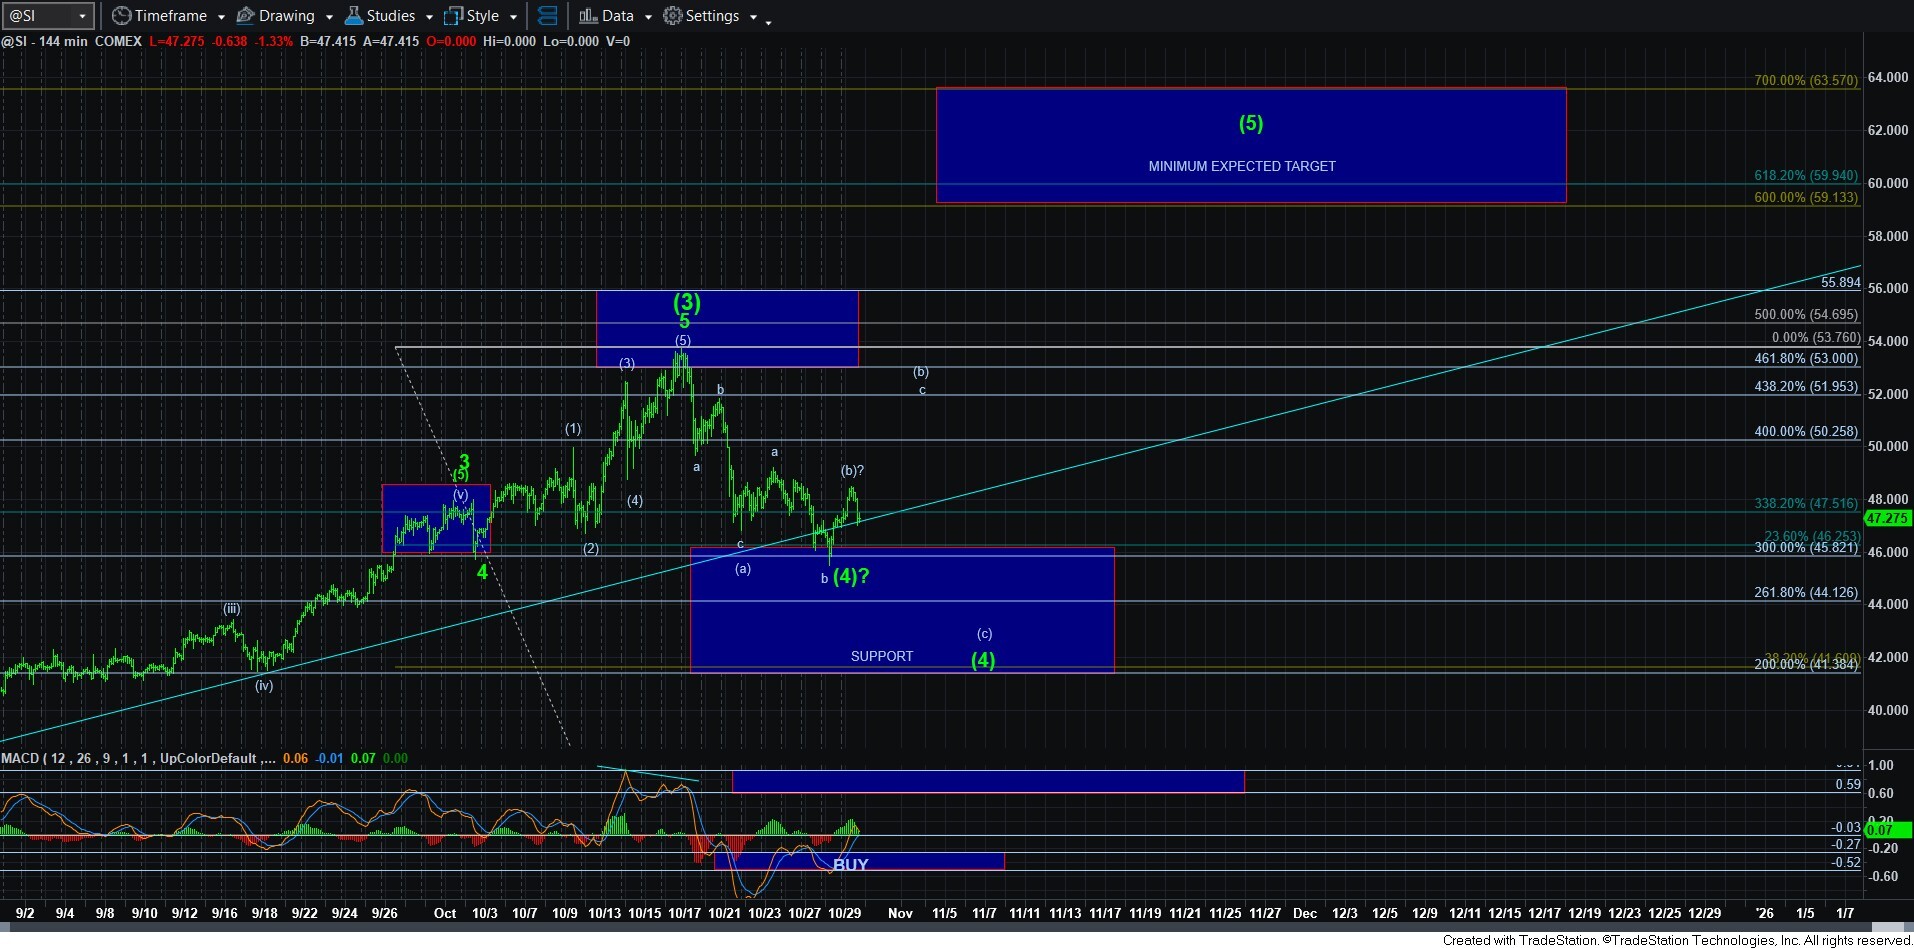
In silver, it has really become complex, as the only way we get a more direct (b) wave higher is through an expanded (w)(x)(y) pattern, which is not terribly common. But, as long as the market holds the 46.15-46.65 region, I am going to maintain this as my primary count. Below that, and I have to assume that the (c) wave down has already begun, with today’s high being the top to the (b) wave. In this alternative, we would be targeting the bottom of the support/target box on the 144-minute chart in the 41 region for the (c) wave of wave (4).
Moreover, since the rally really does not count well as a 5-wave structure into today’s high, I have taken off the bottom to wave (4) being in already. Of course, it is still “possible,” but I do not see that as a higher probability at this time.
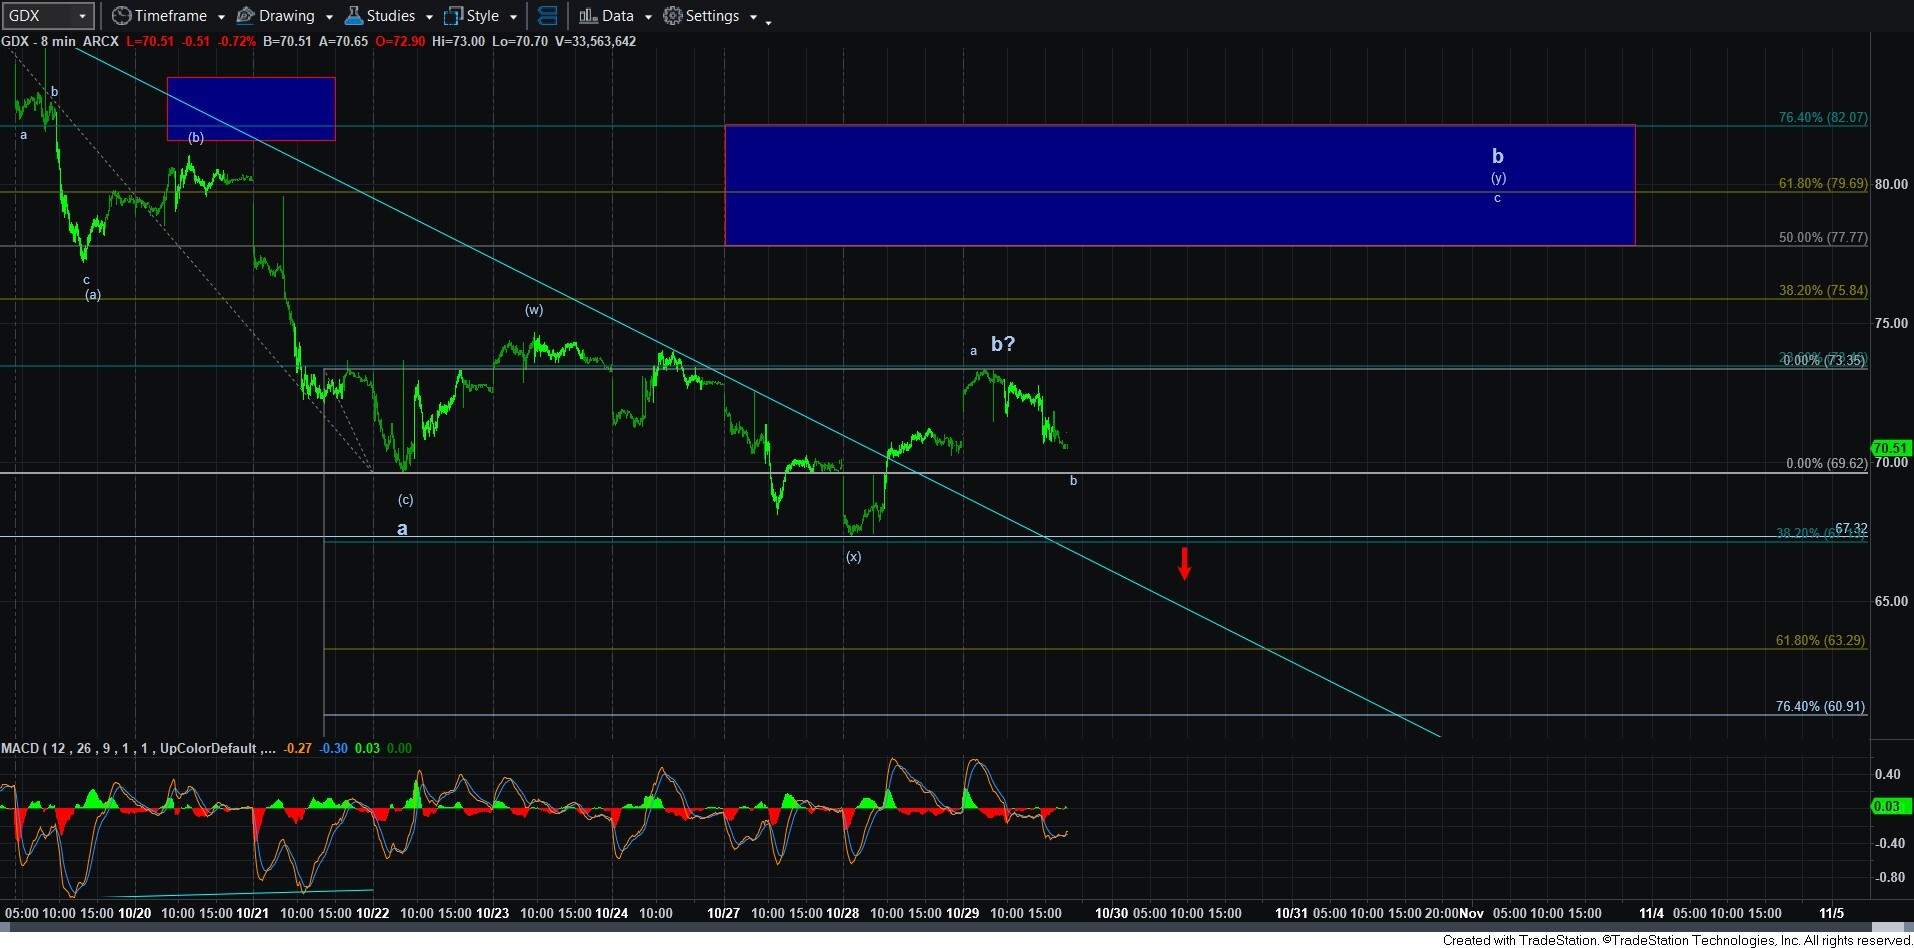
GDX is basically in the same posture as silver, wherein any b-wave rally higher would take shape as a (w)(x)(y) structure. And, within that (y) wave, the after hours action is attempting to bottom in the b-wave of that (y) wave. Again, it is a more complex structure, but seems somewhat reasonable as long as we remain over this week’s low. Should we break down below this week’s low, it opens the door to the c-wave down, pointing us to at least the 63 region, wherein the c-wave would be equal to .618 the size of the a-wave. But, the more traditional target would be the a=c region which is in the 57 region.
So, at this time, I am leaning to the more complex path higher to complete the respective b-waves. But, admittedly, this is a complex structure upon which it is hard to rely. So, just recognize the potential for a break down sooner than expected based upon the parameters outlined above. Either way, it does seem as though the market is pointing lower before this 4th wave completes.