Gap Up and Crap Down
 By
Ricky Wen
By
Ricky Wen
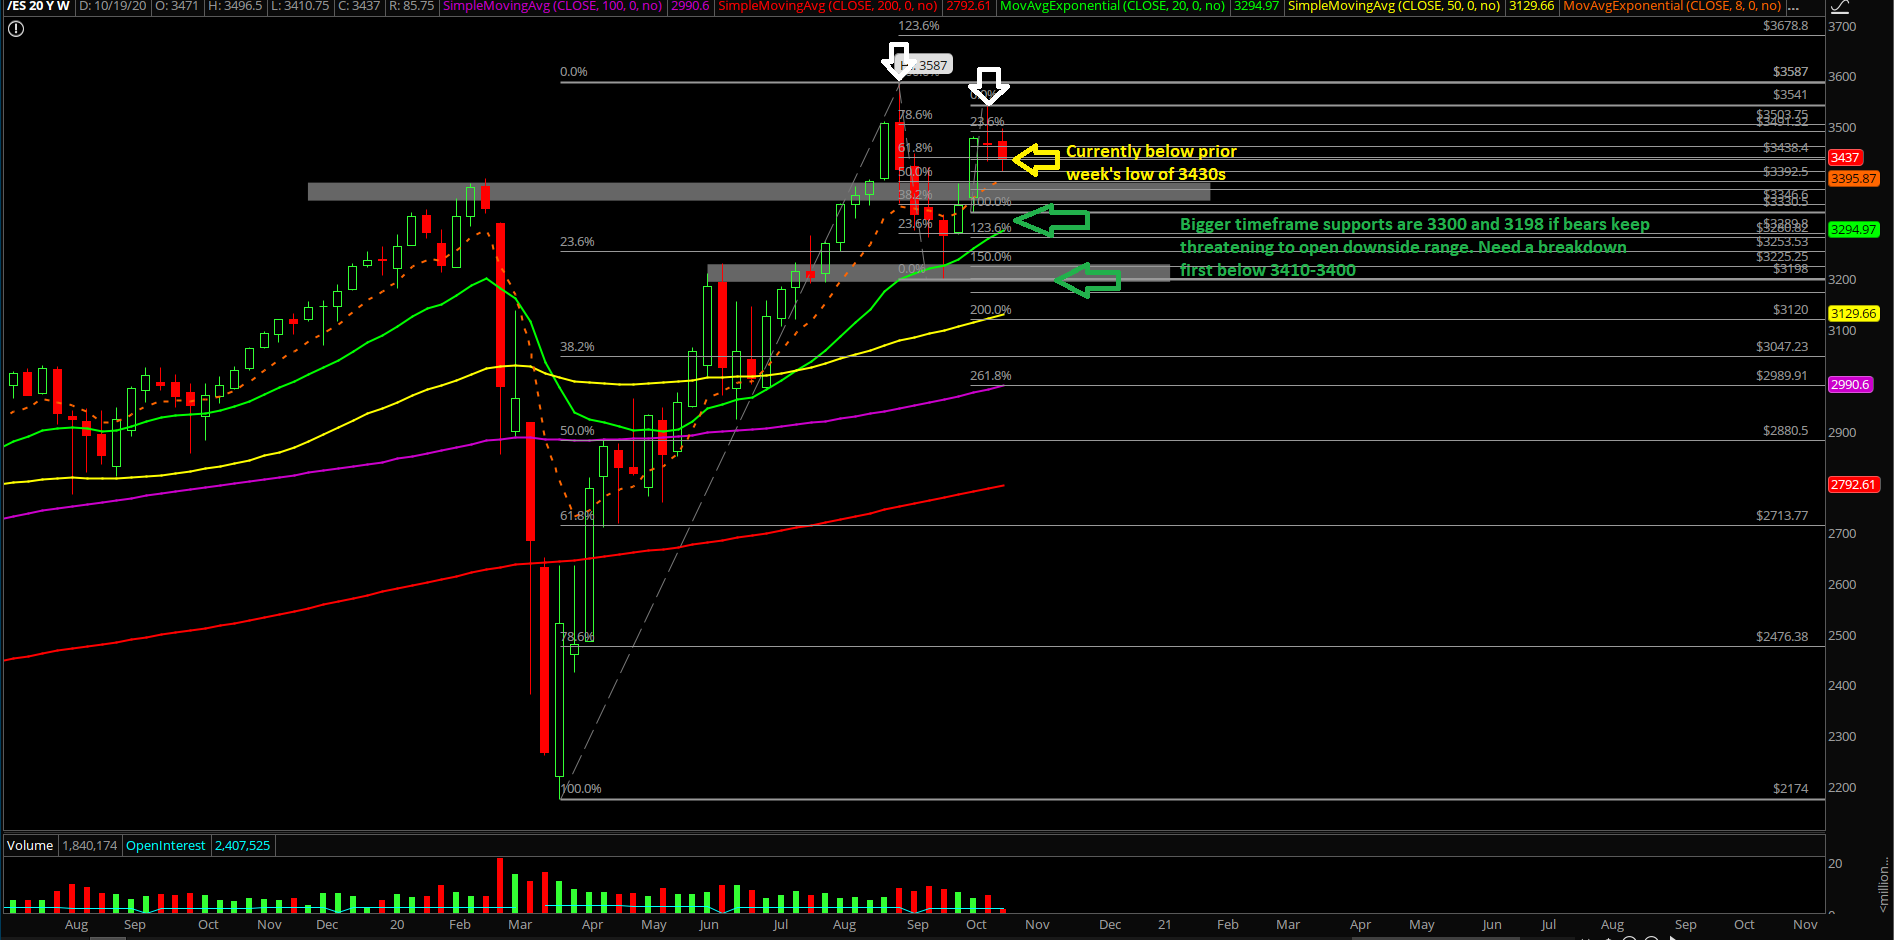
Monday’s session showcased the first surprise of the week as price action established a "gap up and crap down" that made a reversal into lower lows in a swift manner. Price action couldn't hold the prior Friday’s low of 3460s, which was the first warning shot, and then it couldn’t hold the prior week’s low of 3430s in the Emini S&P 500 (ES). This meant that it was a trend day down after the +1% gap up move from the RTH open and confirming that bears are back in business.
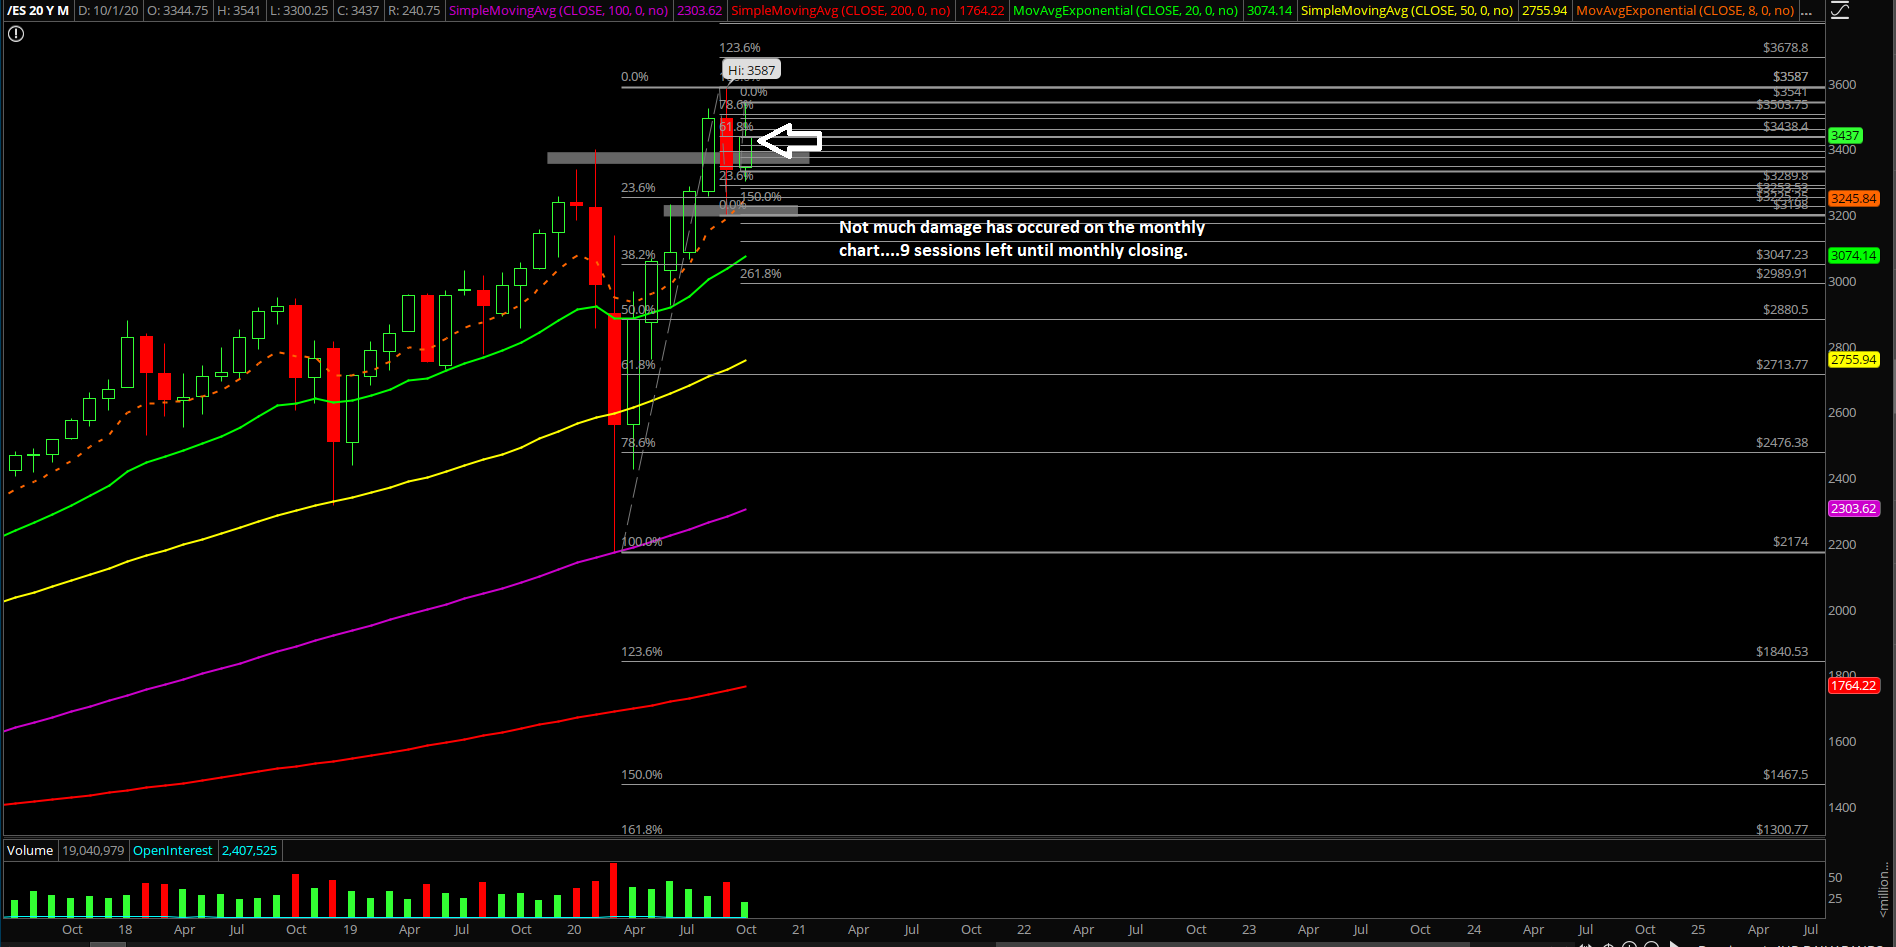
The main takeaway/context for the bigger picture remains the same again given that last week’s low could be treated as in. Short-term timeframes back into alignment with the higher timeframes. Repeat existing context: ES 3198 temporary bottom could be the bigger picture bottom as we head into the rest of Q4 2020. This is a possibility given that price sticksaved/bottom against a key support confluence and has been building a basing pattern since then. Obviously, the wild card is the upcoming elections and likely the volatility/whipsaw will commence shortly and test this theory. We just have to implant that idea if this year is going for the year end highs closing print again as we discussed a few times since the V-shape reversal from March.
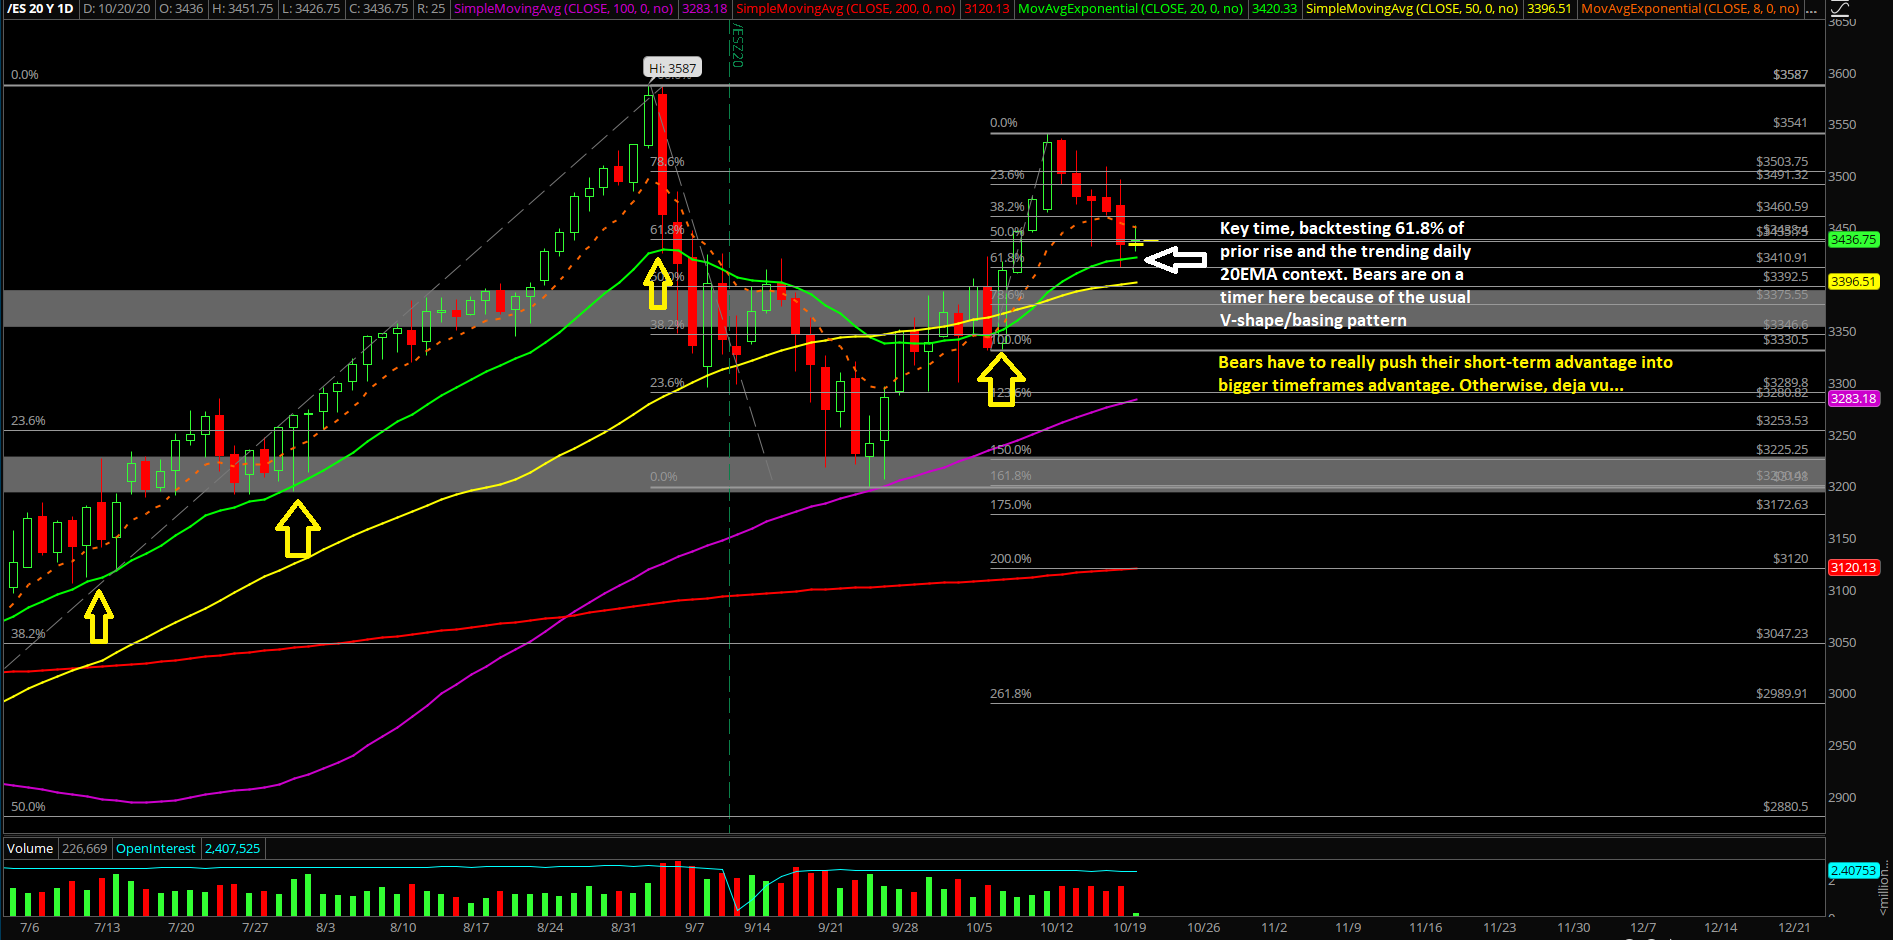
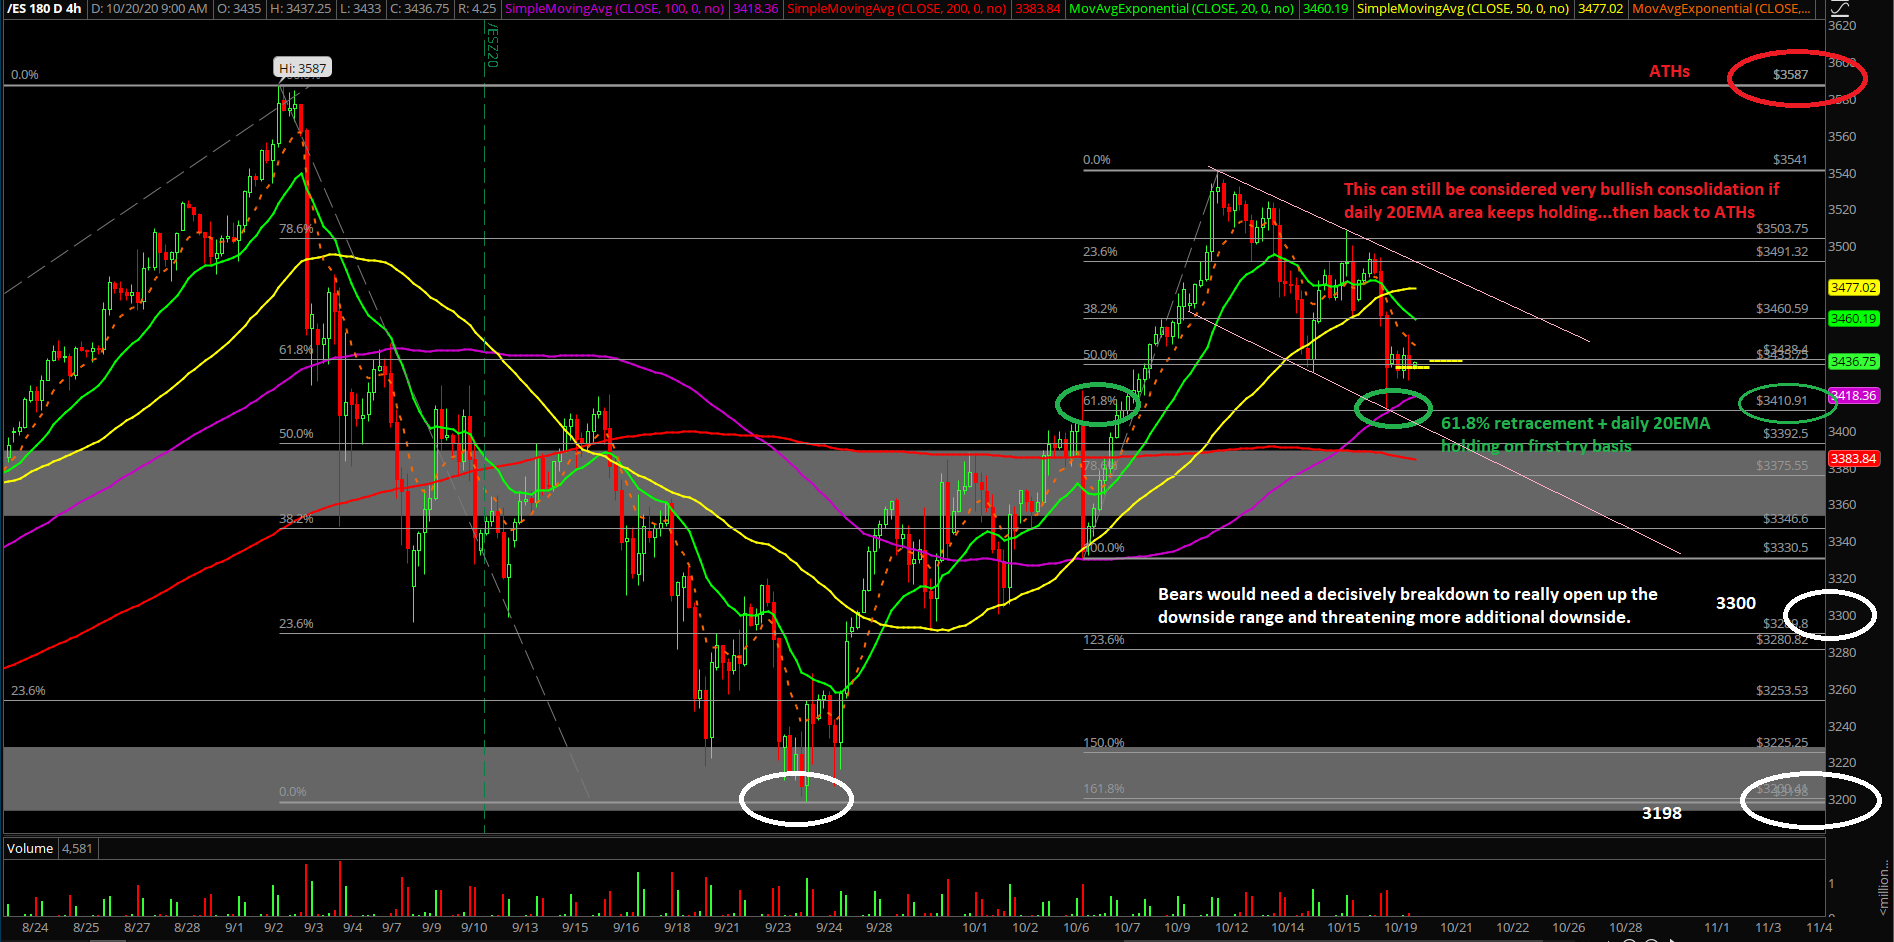
The current wild card is that last week’s high could be potentially considered as a double top/lower high given 3587 ATHs vs 3541 temporary high. It is up to bears to follow through and show additional continuation/commitment to the downside pattern. They are on a timer here and must decisively break below daily 20EMA to disallow yet another V-shape recovery/sticksave vs the main trend of the past few months.
What’s next?
Monday closed at near the lows at 3433.75 on the ES, which was a couple points above last week’s low of 3431.50. Today could be a digestion day or it could be an immediate continuation attempt to the downside, so we’ll know more after the RTH open and how price action reacts vs our key levels from homework.
Summarizing our game plan:
- Utilize the key levels identified, 3410 as key temporary support and immediate resistances of 3465/3485.
- We are neutral bias on daily chart timeframe as price broke below last week’s low of 3431.5 and closed at 3433.75, which was almost below it so it was a good tease. The low of yesterday was located at 3410.75 where the 61.8% (3410.91) and daily 20EMA aligned.
- We are bearish bias on short-term timeframes as long as price is below 3465/3485.
- A break above 3465 would be a warning sign for bears. A break above 3485 would indicate that a V-shape reversal may be in the process given that it would mean 3410s held/sticksaved and price cannot hold the immediate bearish continuation pattern…déjà vu.
- For bears, for today or tomorrow (today could be a digestion day) they must break below 3410 decisively followed by a continuation into the 3397-3365 zone quickly. If accomplishing that feat, it would threaten and open up the massive range of 3300/3198 levels again. Otherwise, the double top weekly chart pattern of 3587 vs 3541 goes to waste without a big threat of additional downside.
- There’s still a big battle on the timeframes here so knowing your timeframes is here critical.
- For reference, daily 20EMA has been the main trend for the past few months ever since the market bottomed in March, followed by the April V-shape reversal reclaiming the daily 8/20EMA and then running continuous higher lows and higher highs combined with bull flags/pennants/general continuation patterns off the existing trend.