GDX Is Trying To Stretch
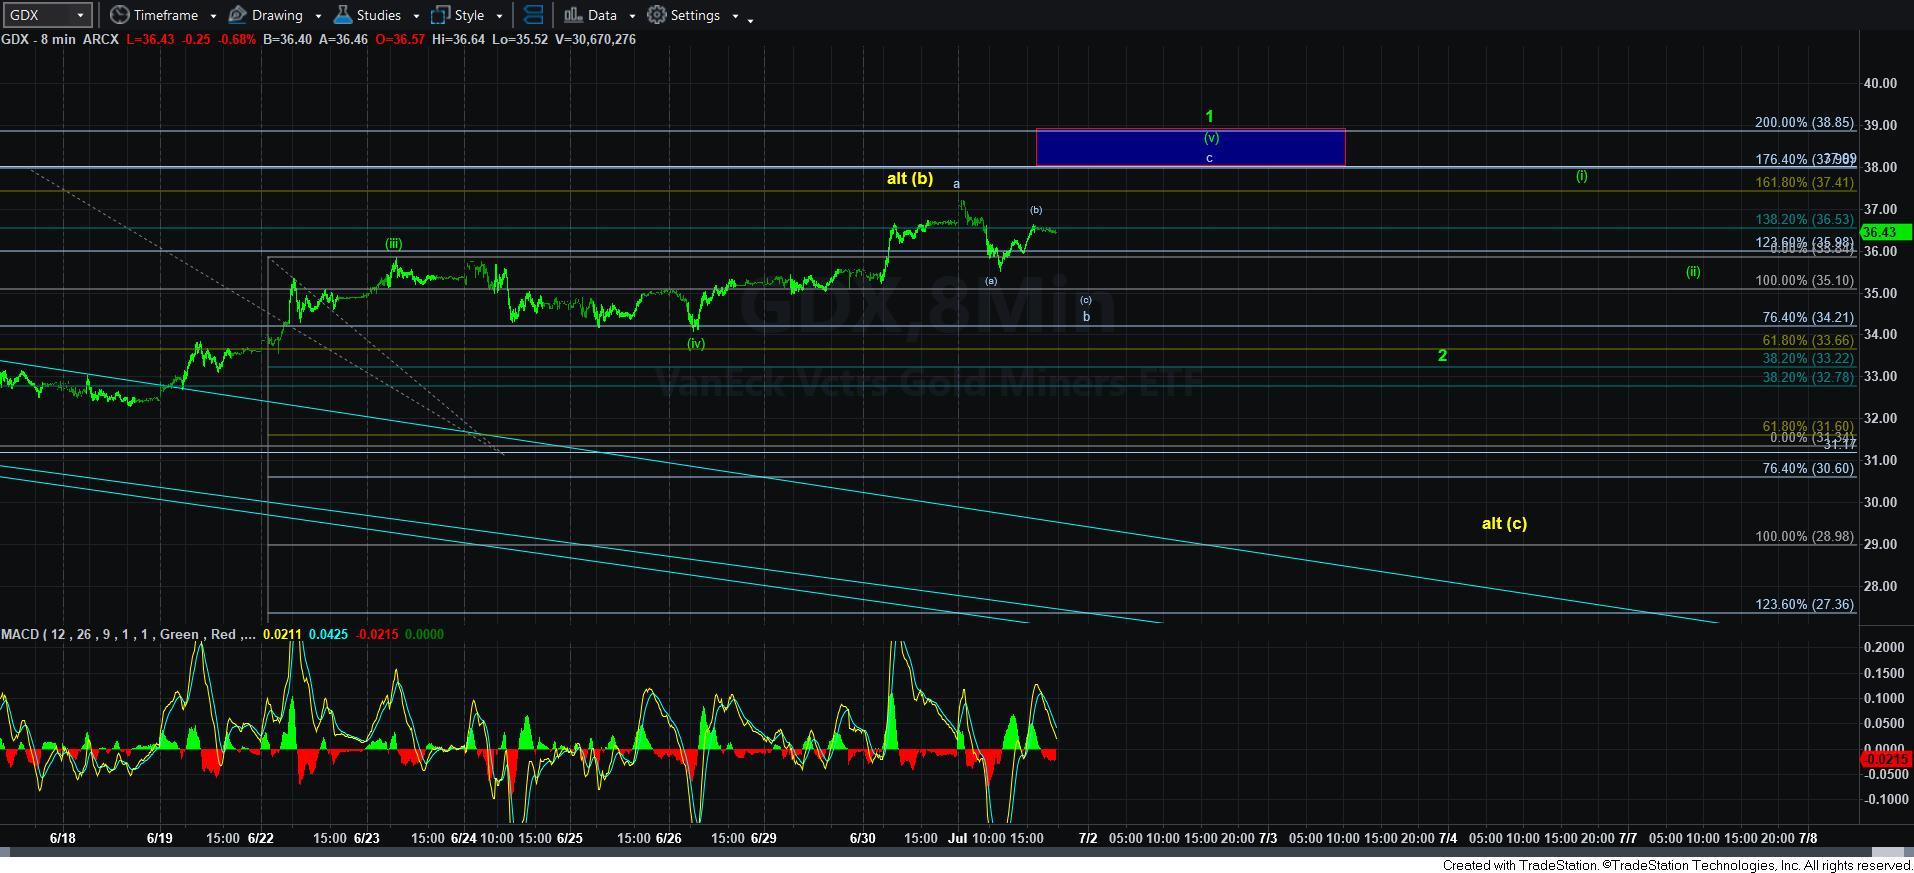
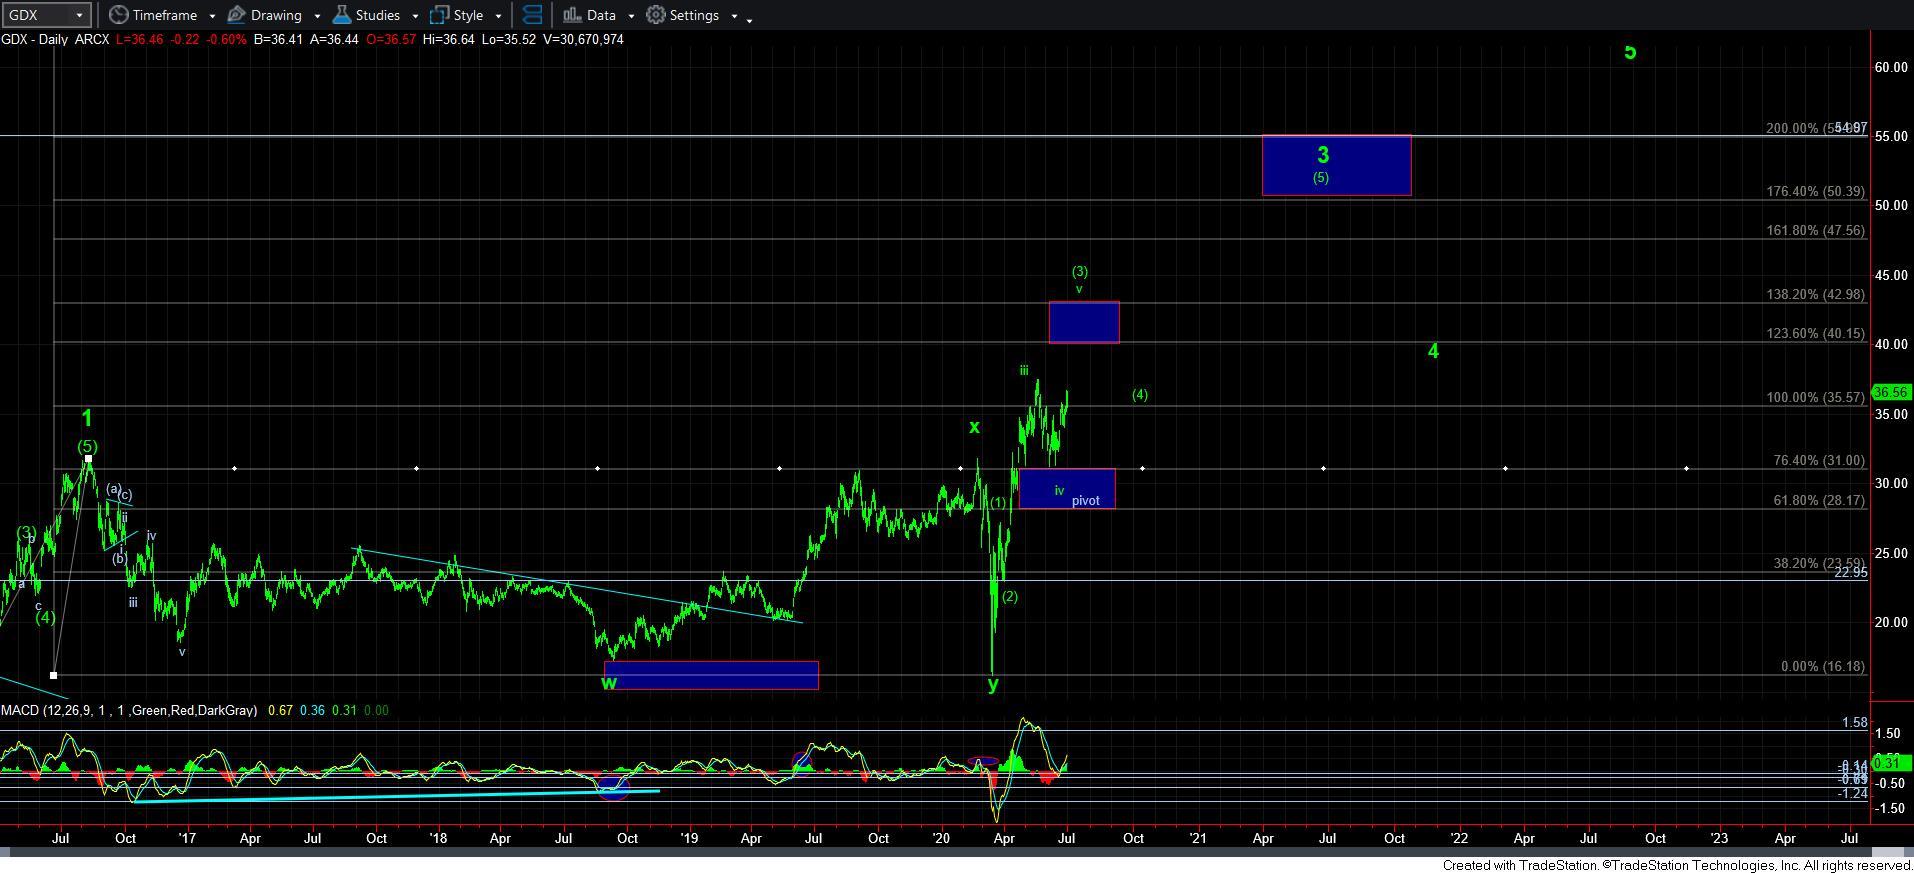
As I have been outlining over the last few weeks, the only way I can even consider that we may have begun wave v of [3] is that wave 1 of v of [3] is taking shape as a leading diagonal. And, if that is the case, then we really should hold the 34.75 support level, and rally towards the 38 region to complete a c-wave of wave [v] of 1 in green, as you can see on the 8 minute GDX chart.
In the very micro count, the drop today counts best as 3-waves, with the rally off today’s low also looking like 3 waves thus far. And, if the GDX is unable to push much higher, then we may still be within the b-wave pullback, as shown on the chart. But, as long as we hold over 34.75, then I can reasonable expect one more push higher towards the 38 region to complete wave 1 off the lows.
Since I have a hard time trusting diagonals as trading cues, I will still need a corrective wave 2 to take shape, followed by a [i][ii] structure, as also shown on the 8-minute chart, before I am willing to consider turning aggressively bullish for the rally I still expect over 40.
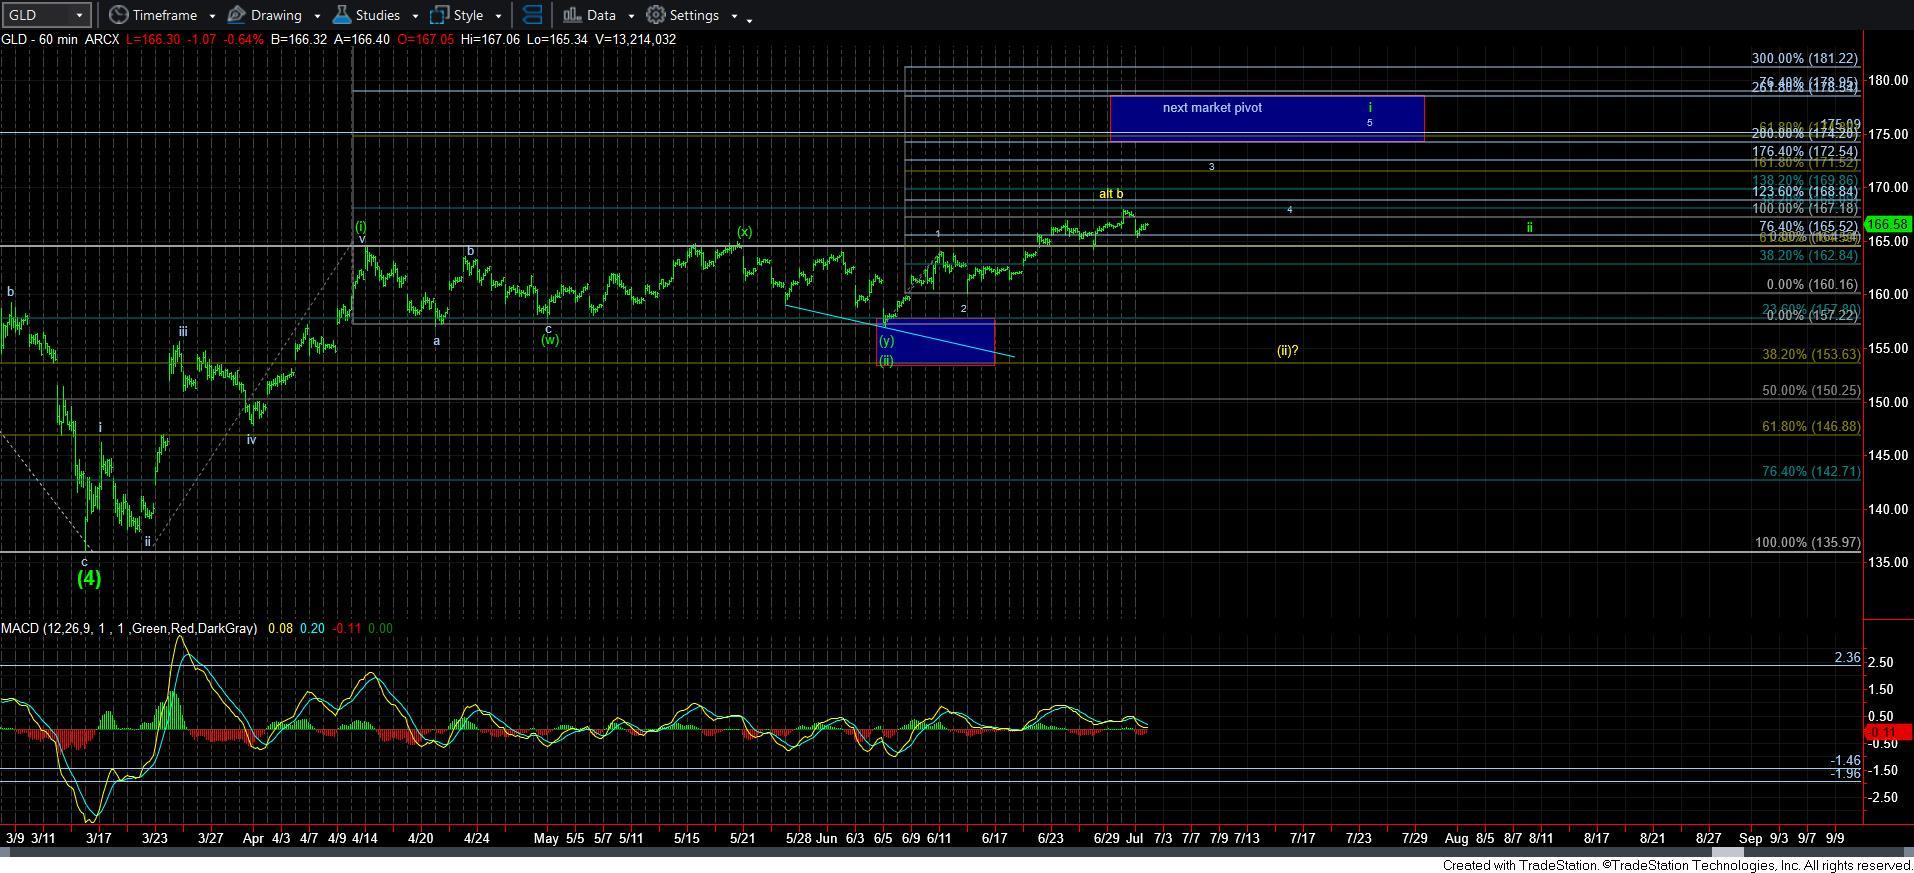
With regard to GLD, it was truly rallying in a textbook fashion. While today’s pullback was a bit more than I had wanted to see, as long as we remain over the 164 region, I am still looking for an extension up towards the 171.50-172.50 to complete wave 3, as shown on the 60-minute chart. A failure to hold 164 will open the door to the expanded b-wave shown in yellow on the chart, which would mean that wave [ii] has actually not completed. But, even if that does happen, an expanded b-wave structure – as this would be if we broke 164, is a very bullish structure, suggesting that higher levels will likely be seen once wave [ii] completes.
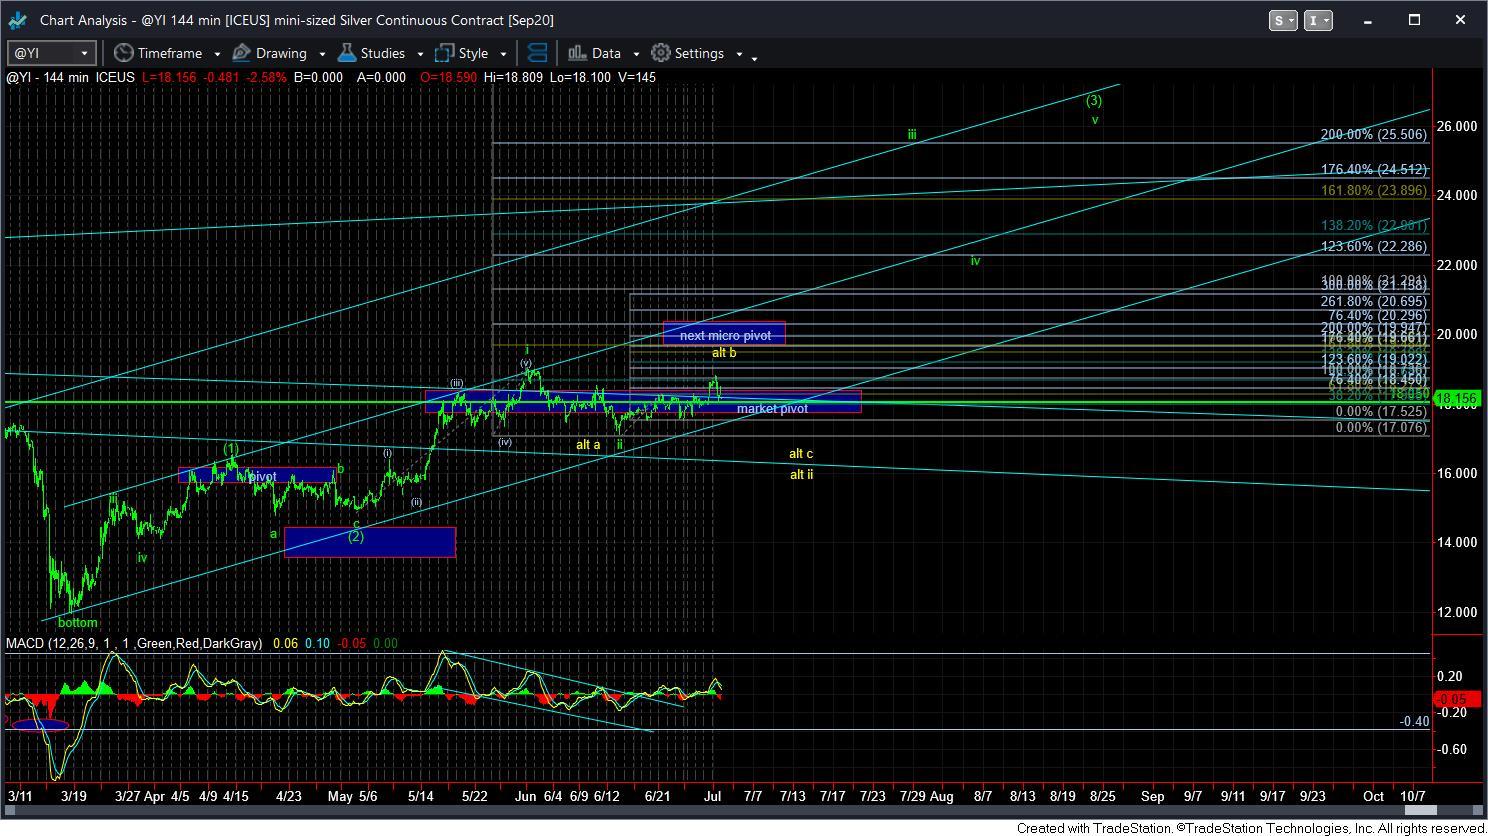
Silver is postured similarly to GLD at this time, where it still needs to push up towards the next micro pivot to fill in wave [i] of wave iii of [3]. However, if we break back below 17.50, then it would mean we have the expanded b-wave structure presented in yellow, and that wave ii of [3] has still not yet completed.
Overall, the main takeaway from all the charts when taken cumulatively is that I do not think a major break out and rally is yet imminent. At best, I think we are completing a 5 wave structure off the recent lows, which would still need a corrective pullback before we are likely ready to truly break out again. But, if we cannot complete that 5-wave rally in the near term, then it means that the current consolidation/pullback has not yet completed, as shown on the attached charts. Either way, I think it may still take a bit more time until we are ready for the next major break out in the metals charts.


