Further Downside Ahead for VXX
 By
By
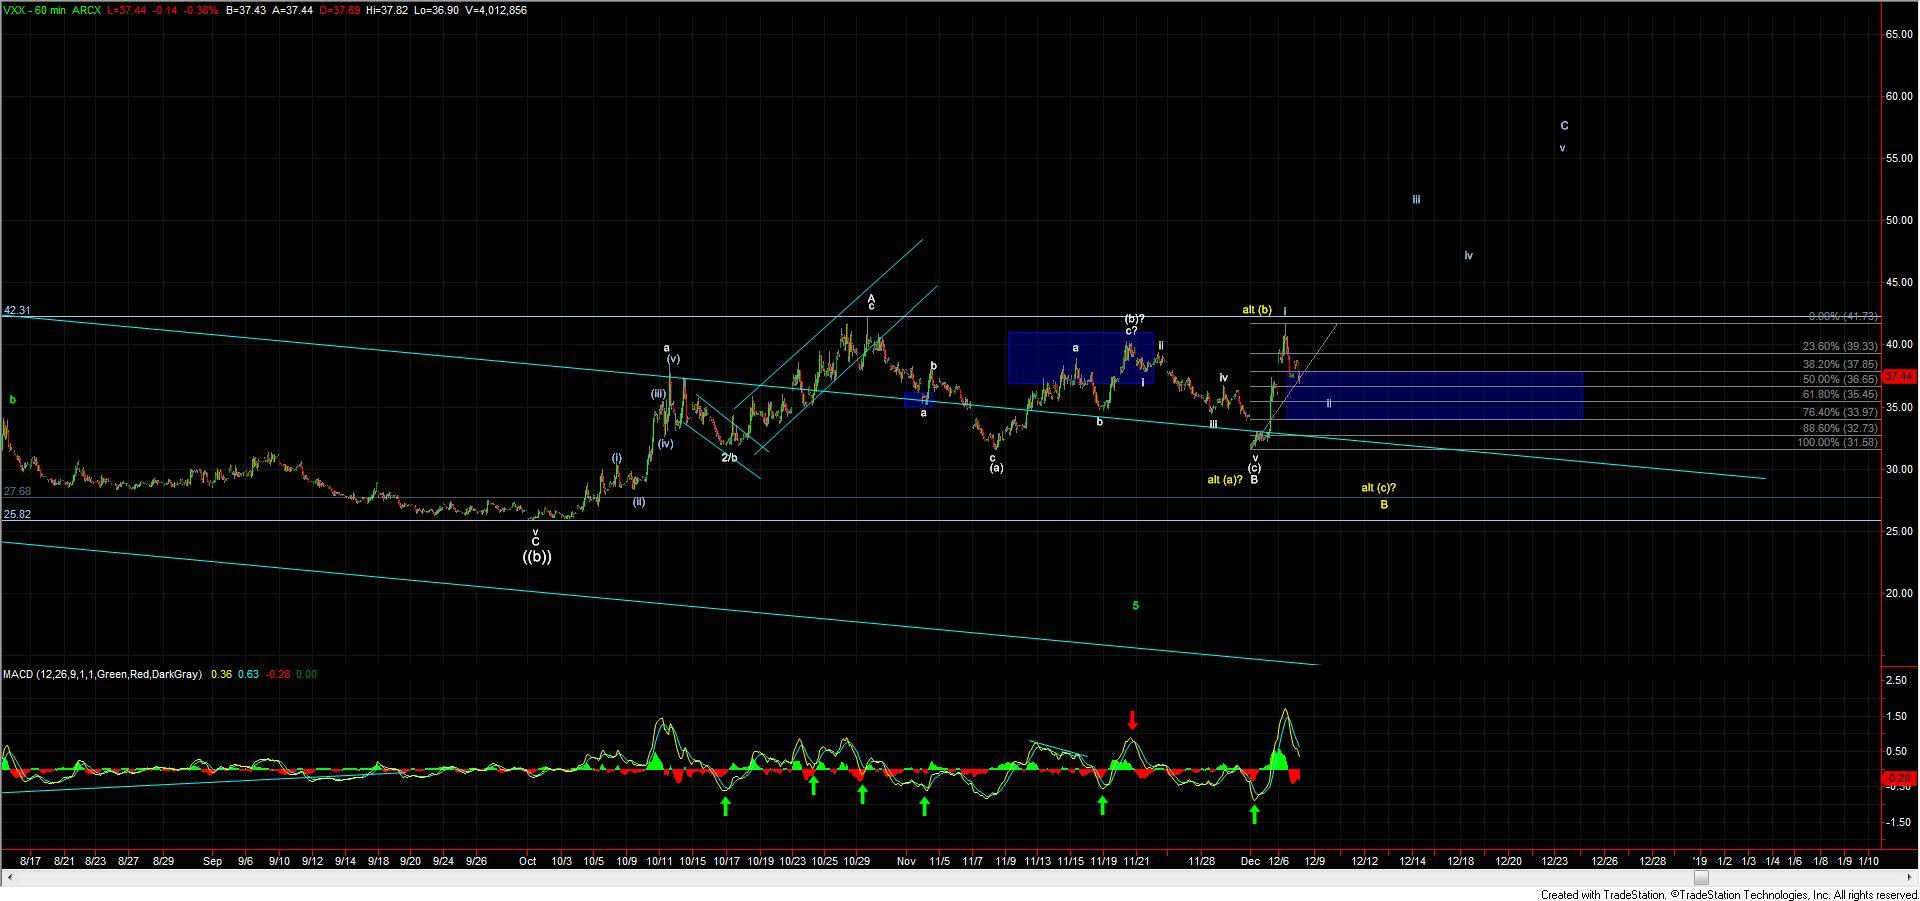
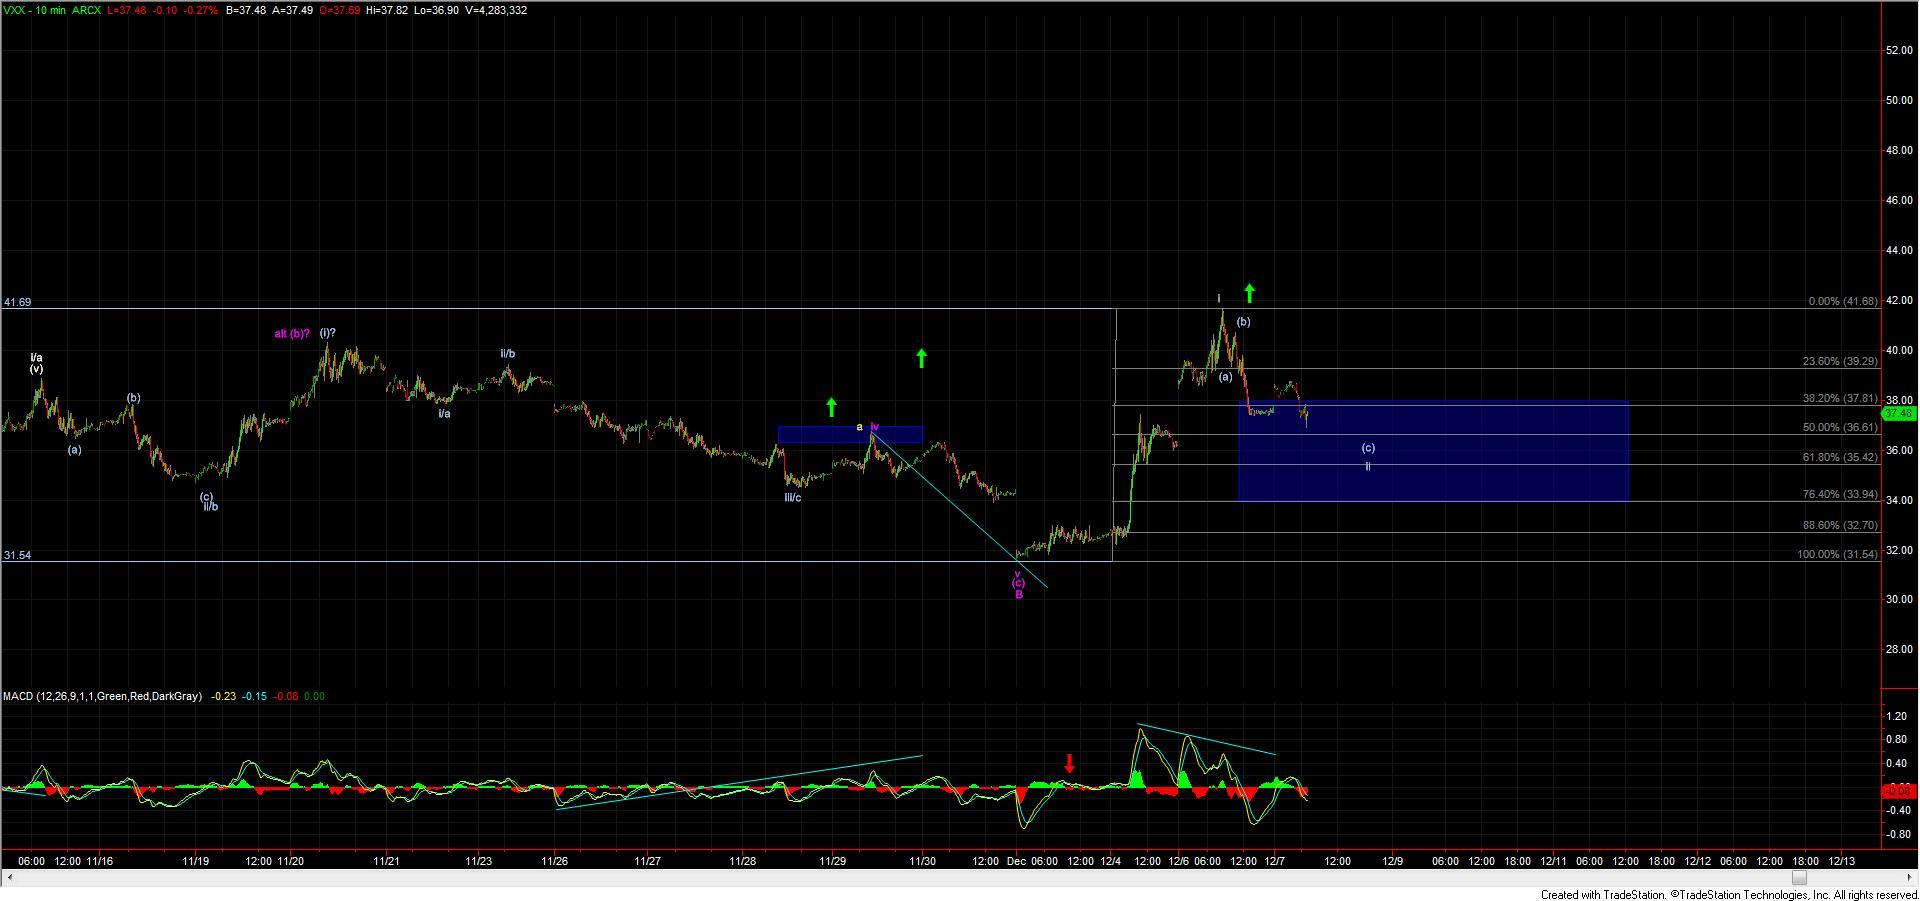
Overnight the iPath S&P 500 VIX ST Futures ETN (VXX) held resistance and it still looks like we are working on wave (iii)/(c) to the downside. We are now closing in on the 36.90 Fibonacci retracement level which represents the 161.8 extension of the initial move down off of the highs.
If that level breaks, the fibs below still come in at the 36.55 and then 36.00 levels with the gap fill coming in very near that 36.00 fib. If and when we make a local bottom for wave (iii)/(c), we then have upside resistance still at the 38.35-38.91 zone for a potential wave (iv).
If we can hold that zone and make one more low this would give us a potential five waves down off of the highs, which would suggest we still have further downside action yet to come in the weeks ahead. A move back through that zone would signal that this move down off of the highs is corrective in nature and that we should see higher levels back up over yesterday's high and potentially much higher sooner rather than later.
Bigger picture I am still favoring the white path on the chart at this point in time, but I would want to see the move down off of the highs form that corrective move lower, and a five wave move down off of the highs would certainly make things a bit more complicated for this white path.
So, for now, I will keep a close eye on this pattern and look to see if we can get a bounce off of one of the key fibs as shown on the 60-min chart. This would be an early warning sign that we may be forming a bottom in the wave ii per that white count.