Further Bullish Action - Market Analysis for Jan 24th, 2018
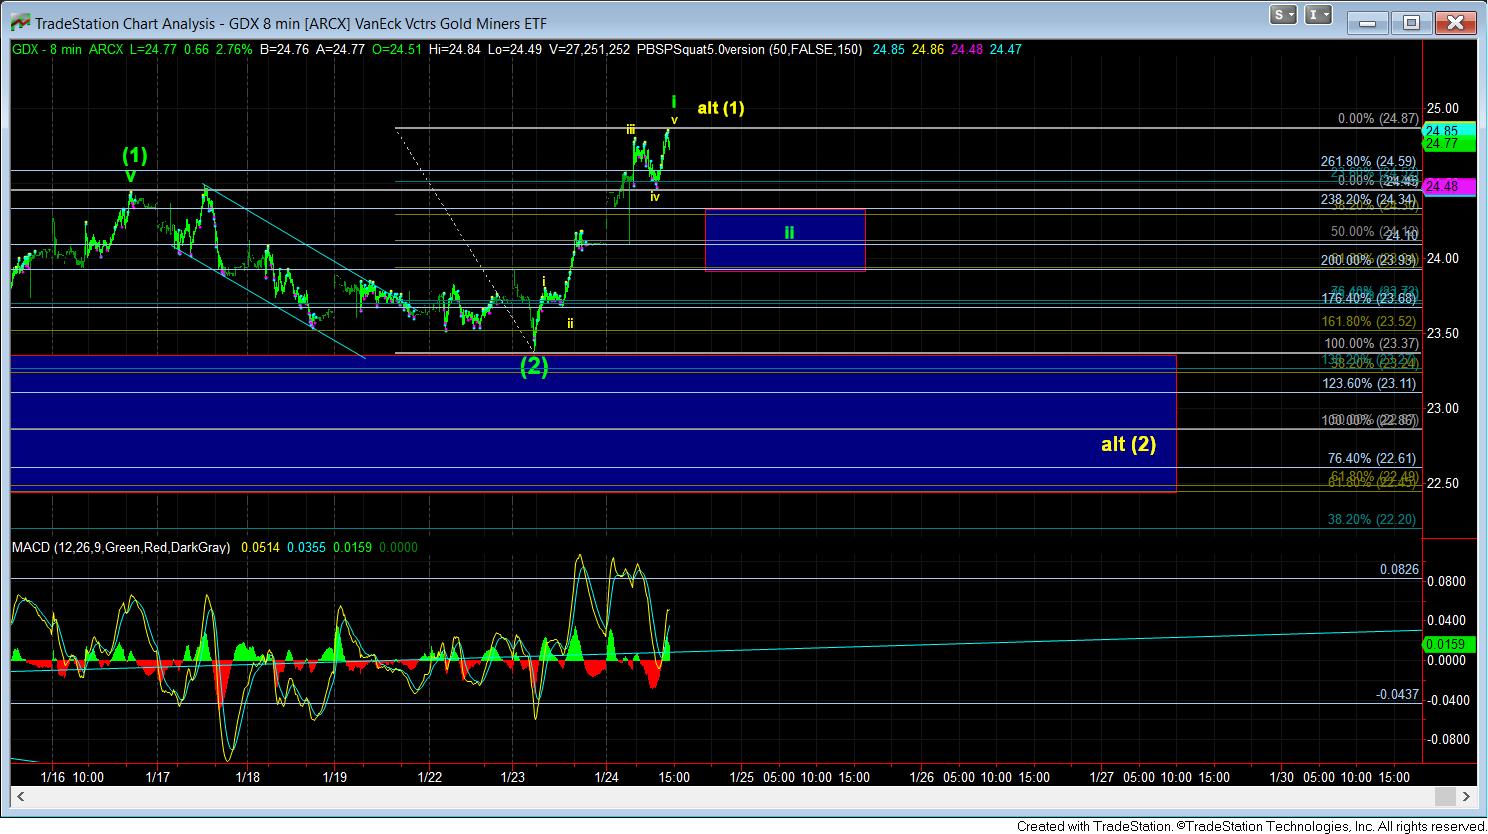
As I noted in the updates during the day yesterday, we experienced a micro 5 waves up off the upper support for wave (2). When that occurred, I put our members on notice with my intra-day updates, that wave (2) may be done in a high consolidation. Today, we got further confirmation of that potential with another 5 waves completed off yesterday’s low.
At this point in time, I have to view my count as ready to potentially break out. As you can see on the 8-minute GDX chart, as long as the next pullback holds over the upper blue box support between 23.90-24.30, and then breaks out strongly over the high for wave i – wherever it tops today – that is our initial signal that the heart of a 3rd wave higher is taking hold. That would be the parabolic rally for which we have been eagerly awaiting for quite some time.
Alternatively, it is “possible” that this 5 waves up today is really a more extended wave (1) off the December lows. So, if we break below the upper support noted on the GDX chart, it would suggest that this alternative is applicable. But, for now, I am using the more aggressive bullish posture as my primary count, with the market having to prove the larger degree wave (2) in the coming days.
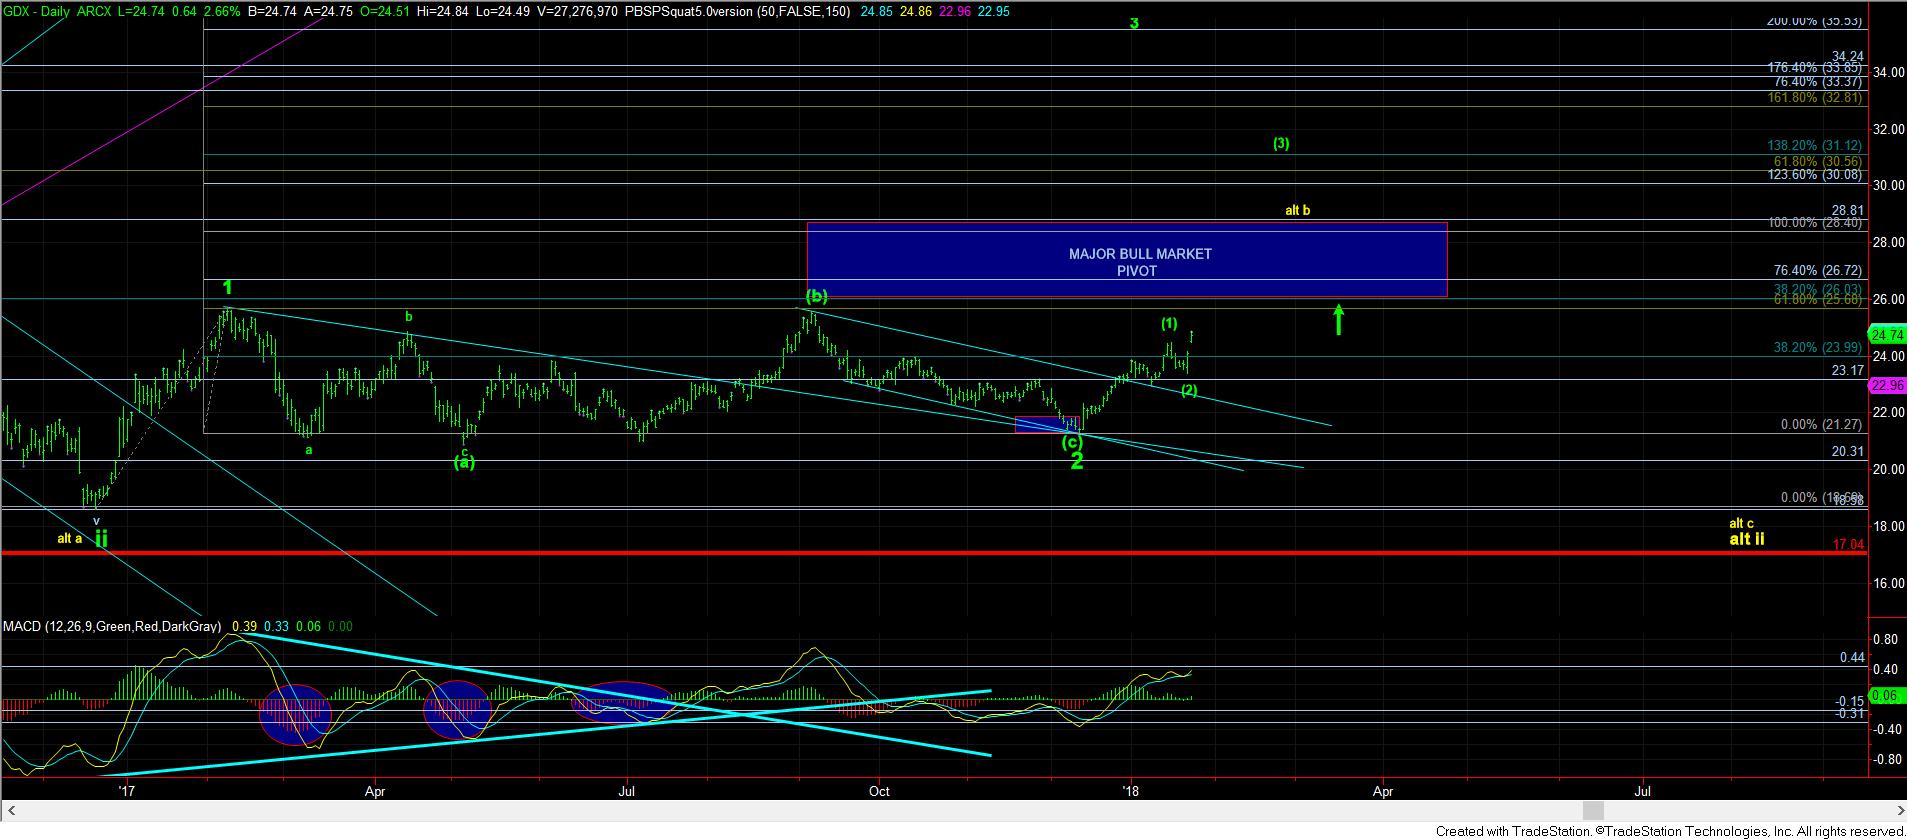
There is one more point I want to make about the larger degree wave counts. While it is certainly exciting to see another 3rd wave break out set up developing, I am going to have to at least present the other side of the coin. As you can see on the daily GDX chart, I have maintained that bull-market pivot on the chart for quite some time. The top of that pivot represents a 1.00 extension just below the 29 region. What this means is that once the market moves into this pivot zone, it will likely rally towards that 29 region. At that point, all stops should be placed just below this pivot zone. If the market is in true melt-up mode in the 3rd wave, we should not break back below this bull market pivot, or there is potential for a much more protracted wave ii. Again, this is simply an alternative count I have to point out if we are unable to exceed the 29 region on the break out, and I want you to at least have an exit strategy in mind just in case.
Got now, the market is certainly setting up to break out in the 3rd wave. While the more aggressive break out potential is now on the chart, the question is if we can hold the wave ii support box between 23.90-24.30, and then break out in a strong move directly targeting that 29 region next.
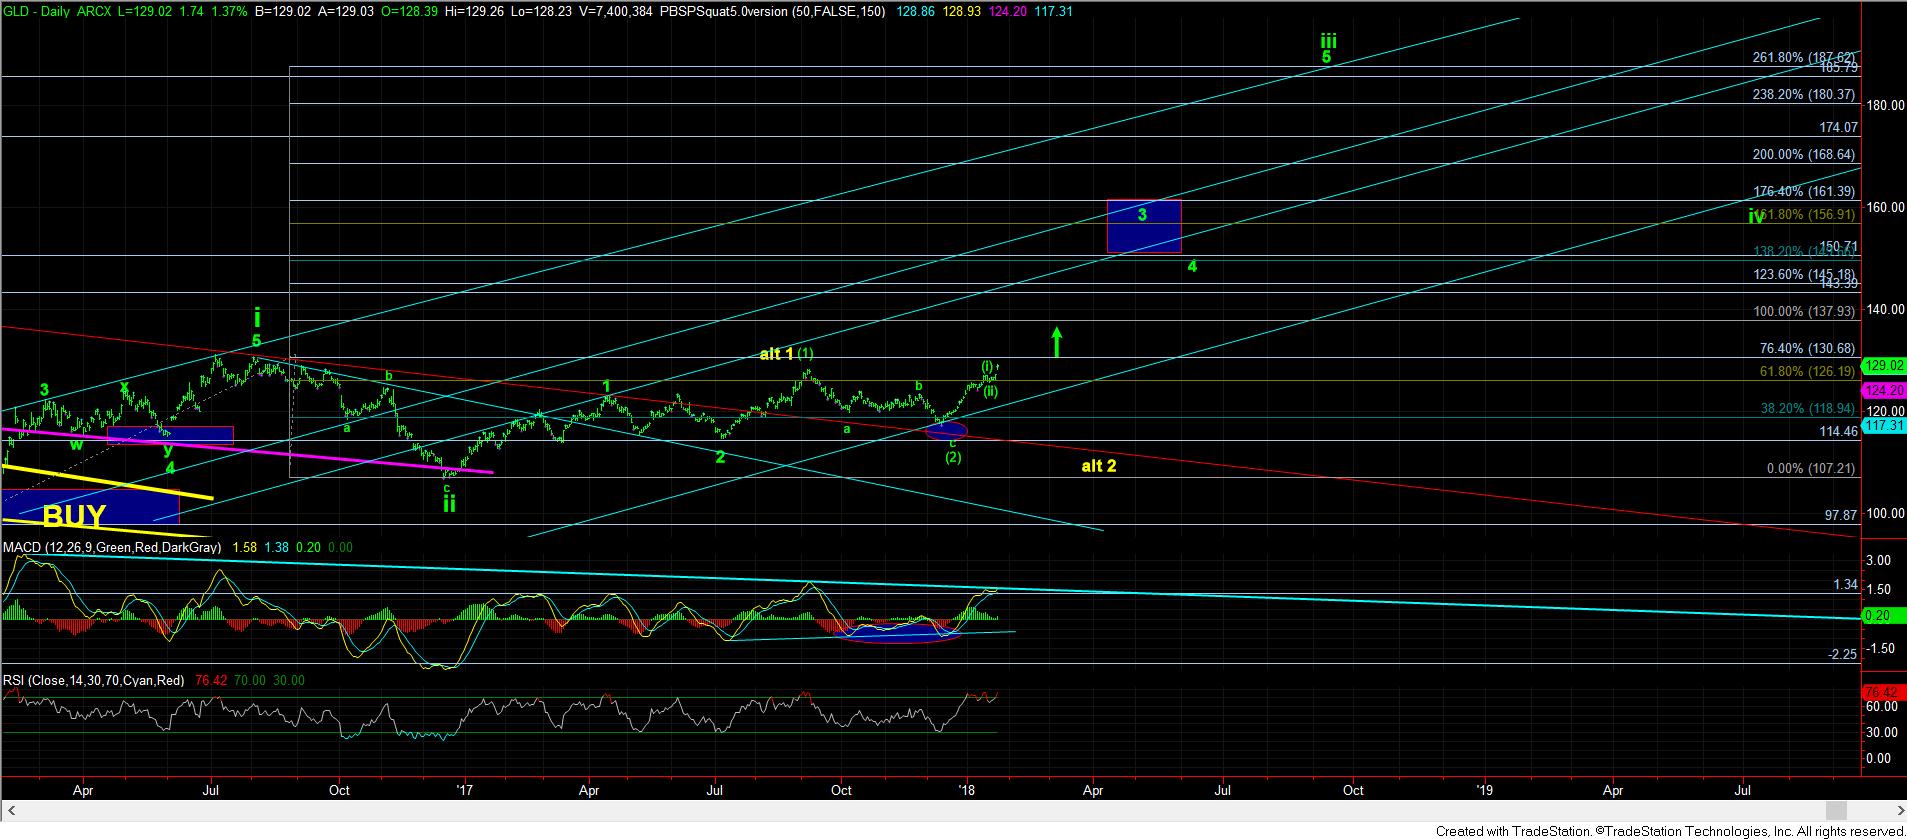
And, as you can also see, the GLD will have the same resistance 1.00 extension in the 138 region, but my primary expectation would be to see a strong move directly to the 150-60 region once we do break out.
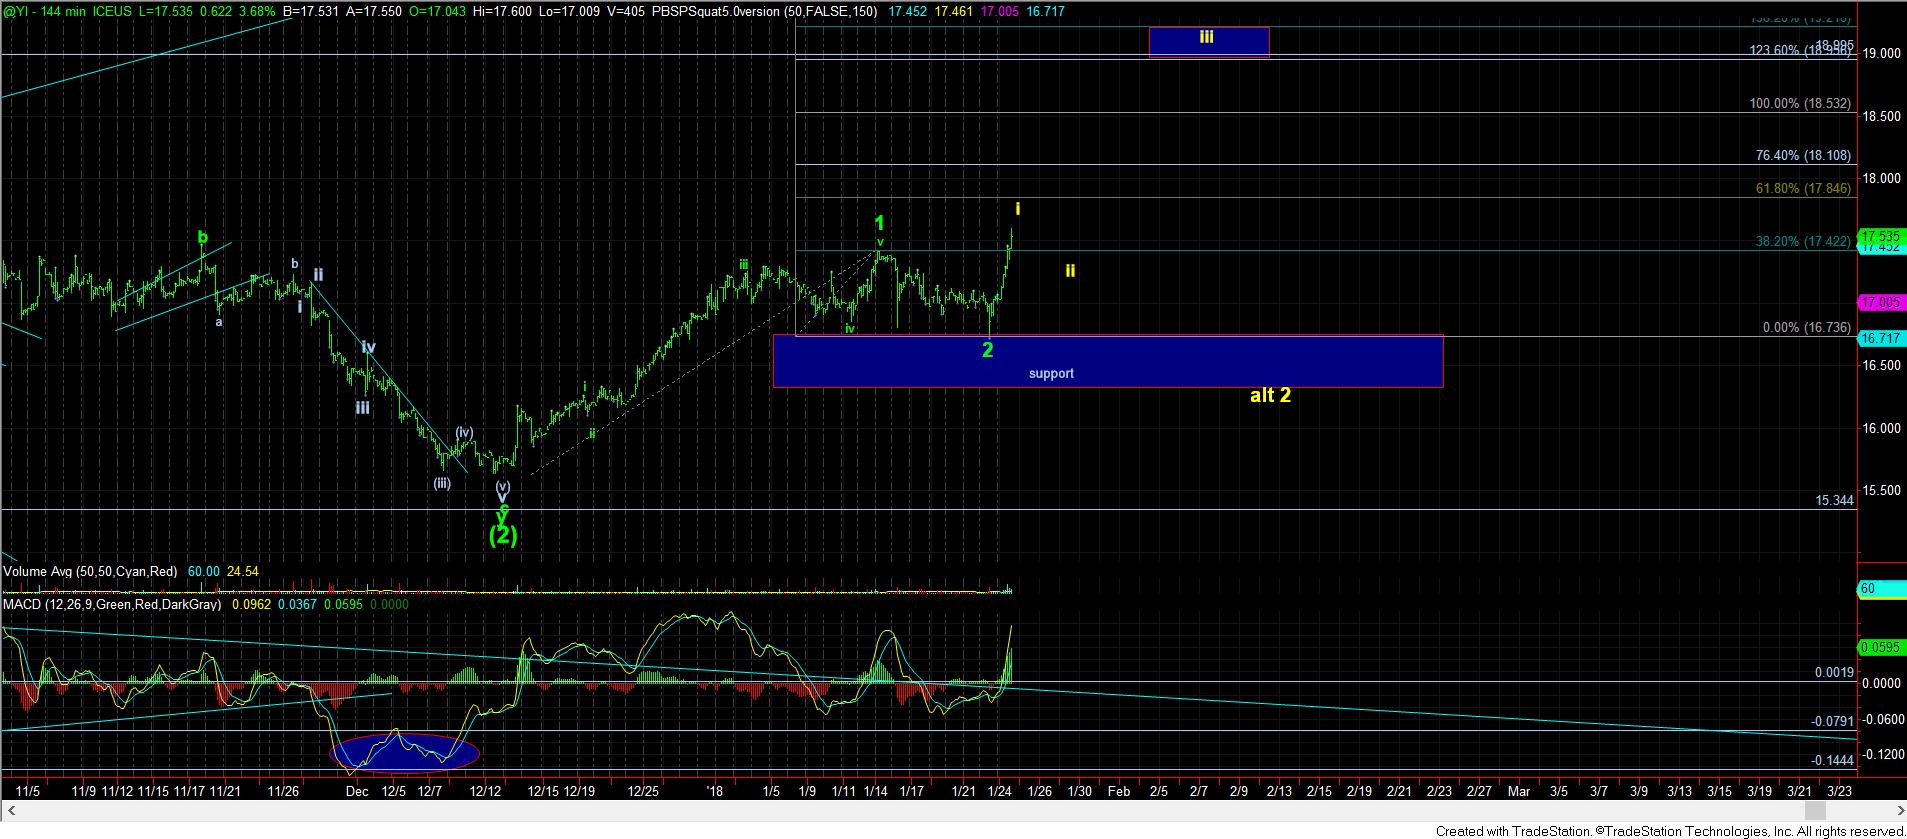
Lastly, I have also placed a wave iii of 3 minimal target for silver, as I would expect that wave degree to AT LEAST strike the region between the 1.236 and 1.382 extension as long as wave ii holds support.