Ford vs GM: Both Down To Their Last Puff?
 By
Levi
By
Levi
by Levi at Elliott Wave Trader; Produced with Avi Gilburt
We’re going to take a look at Ford (F) vs (GM), but not as a competition. Well, if we were going to look at it as a contest, it may be a race to see which stock forms a solid sell setup first. Also, we will briefly discuss (TSLA) via Lyn Alden’s comments and with Zac Mannes. You will find her perspective to be enlightening. Zac gives us the technicals to illuminate the path forward for all 3 stocks. Note in the middle section of this piece what will tell us that the next down leg is likely to commence in these tickers.
The Fundamental Outlook With Lyn Alden
“When it comes to any of the car companies, if I were interested in owning them (which I'm not really), I would pretty much just rely on technicals.”
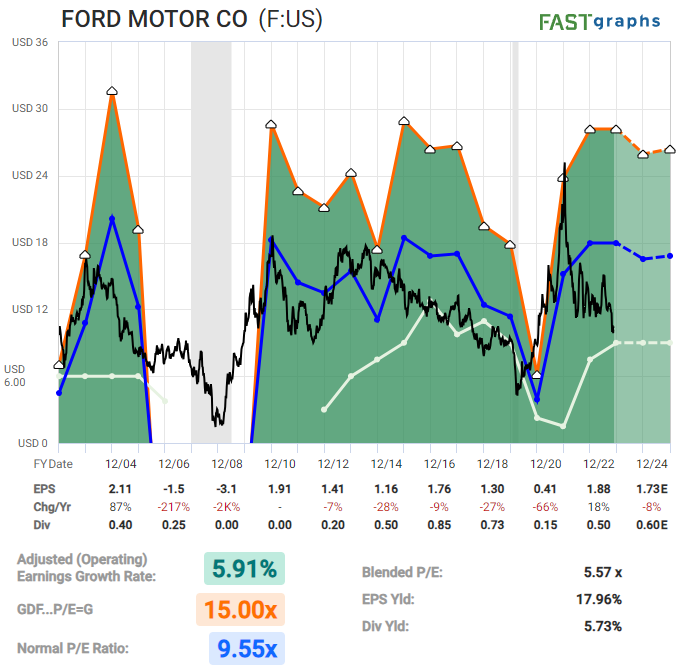
"Both Ford and GM are deep value stocks, but with no economic moat. They are what Warren Buffett would grossly refer to as "cigar butt" investments, meaning they likely have "one more puff" in them but are otherwise not the type of investment you want to own long term and allow for superior compounding. So, if their technicals start to turn positive, at these beaten-down valuations they are indeed highly tradeable, but I would use tight stops or invalidation points.
For Tesla, it's a bit different. They have growth, but very high valuations and weak profitability. They have increasing competition out of China. Full self driving and robotaxis and in general being a "software company" has historically always been a year away, like you can find video compilations of Musk referring to FSD being a year or two away for each of the past 5+ years. Nonetheless, the equity has done very well due to high valuations and forward expectations of the company's success. I don't expect very good sales from the Cybertruck, although their bread-and-butter EV car sales are likely to continue to do reasonably well.
So for Tesla, I would also rely mainly on technicals if I were interested in trading it long or short, and I consider there to be better long-term set-and-forget growth-oriented compounding opportunities out there.”
What’s The Current Setup For Each Chart?
Let’s initiate this section with a brief recognition of the limitations in the Buy/Hold/Sell rating system. It simply does not allow for the nuances inside of the structure of price. Human behavior is not linear in nature. It is fluid and dynamic. Plainly spoken, we can have a larger buy or sell setup and then have a short term setup in the opposite direction from specific levels inside the structure.
Please allow me to illustrate this with the (F) chart.
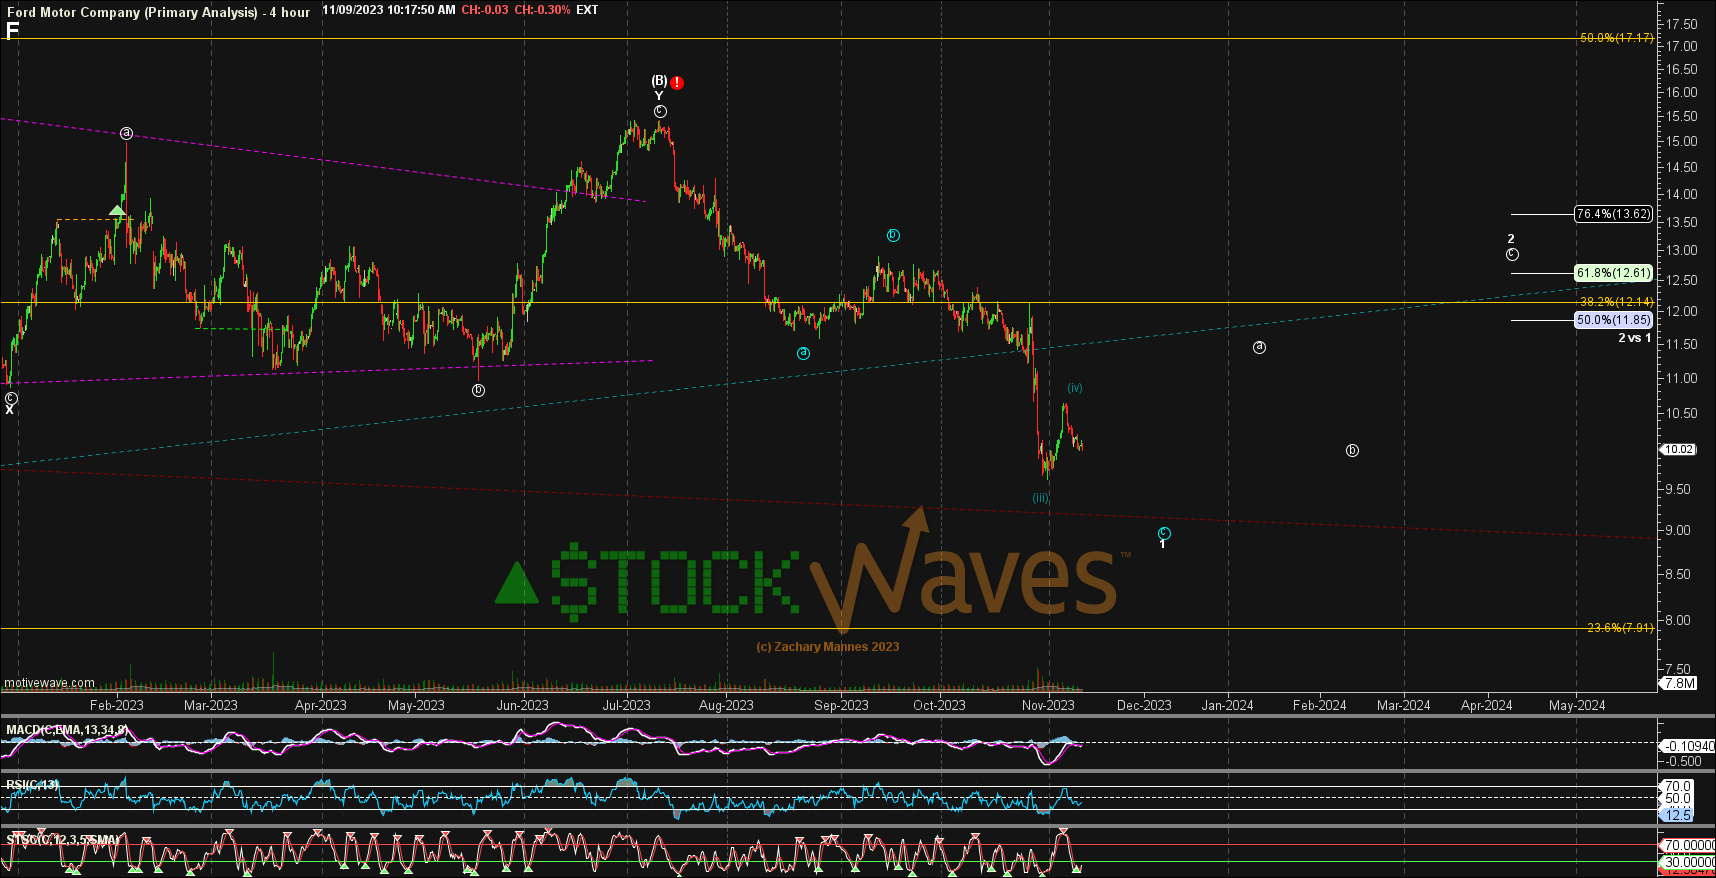
Zac Mannes has done such a nice job of painting this picture for us. Price is anticipated to complete a lower low in what is likely just wave 1 of a larger [C] wave down. This will then have us looking for a corrective bounce in wave 2 of [C]. The wave 2 bounce should be a three wave structure (an a-b-c) and will target somewhere in the 50% to 62% of the range that wave 1 traveled down from the [B] wave high struck in July of this year.
When wave 2 completes, this will be a classic short setup as a 3rd wave inside a larger [C] wave is a high-probability setup and also typically a powerful and even impetuous type of a move, in this case, down.
In the meantime though, we would be boxed into characterizing this as a ‘hold’ since there is likely a bit more down and then the corrective bounce up in wave 2 first.
OK, GM, your turn.
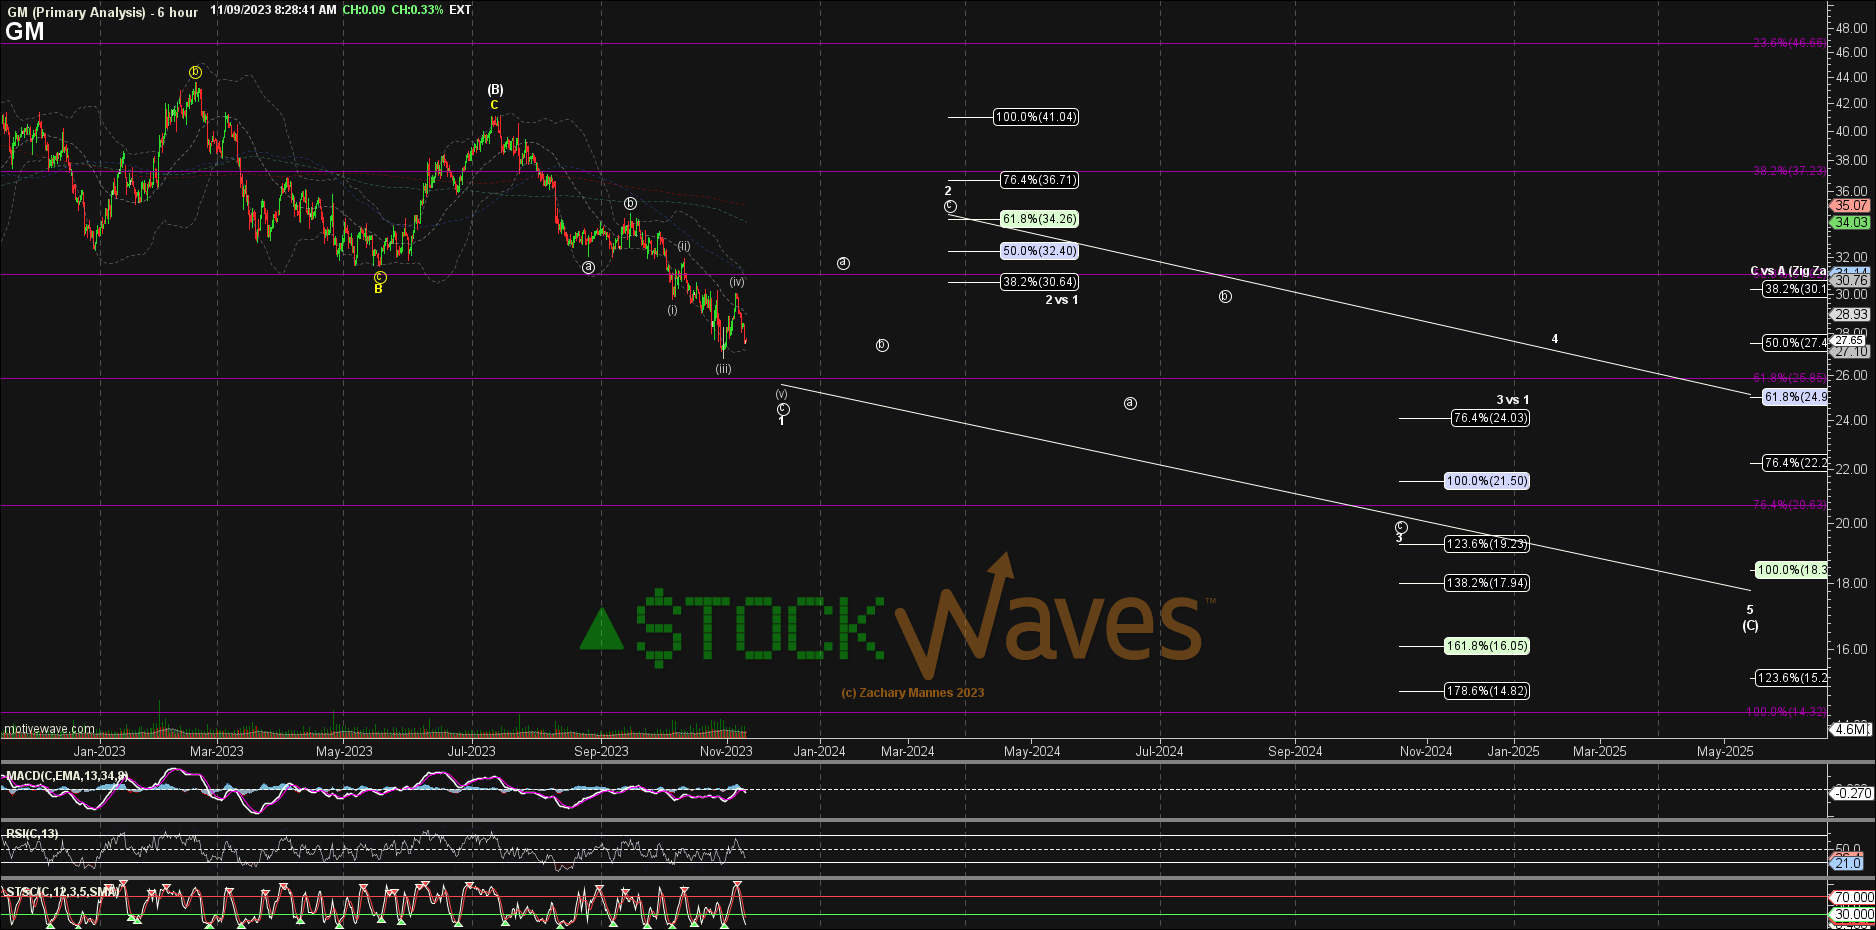 Note the similarities in the two structures between (F) and (GM). As is the case in the prior discussion above, price should be soon seeking a low in wave 1 of the larger [C] wave followed by the wave 2 corrective bounce.
So, as you likely have surmised, we would also place the obligatory ‘hold’ here on GM until the larger sell setup fills in.
Zac and I discussed TSLA the other day. We see the possibility for a larger move to the upside, even to as high as the $360 area. But, for that to play out, price is going to have to conquer the next resistance area just overhead.
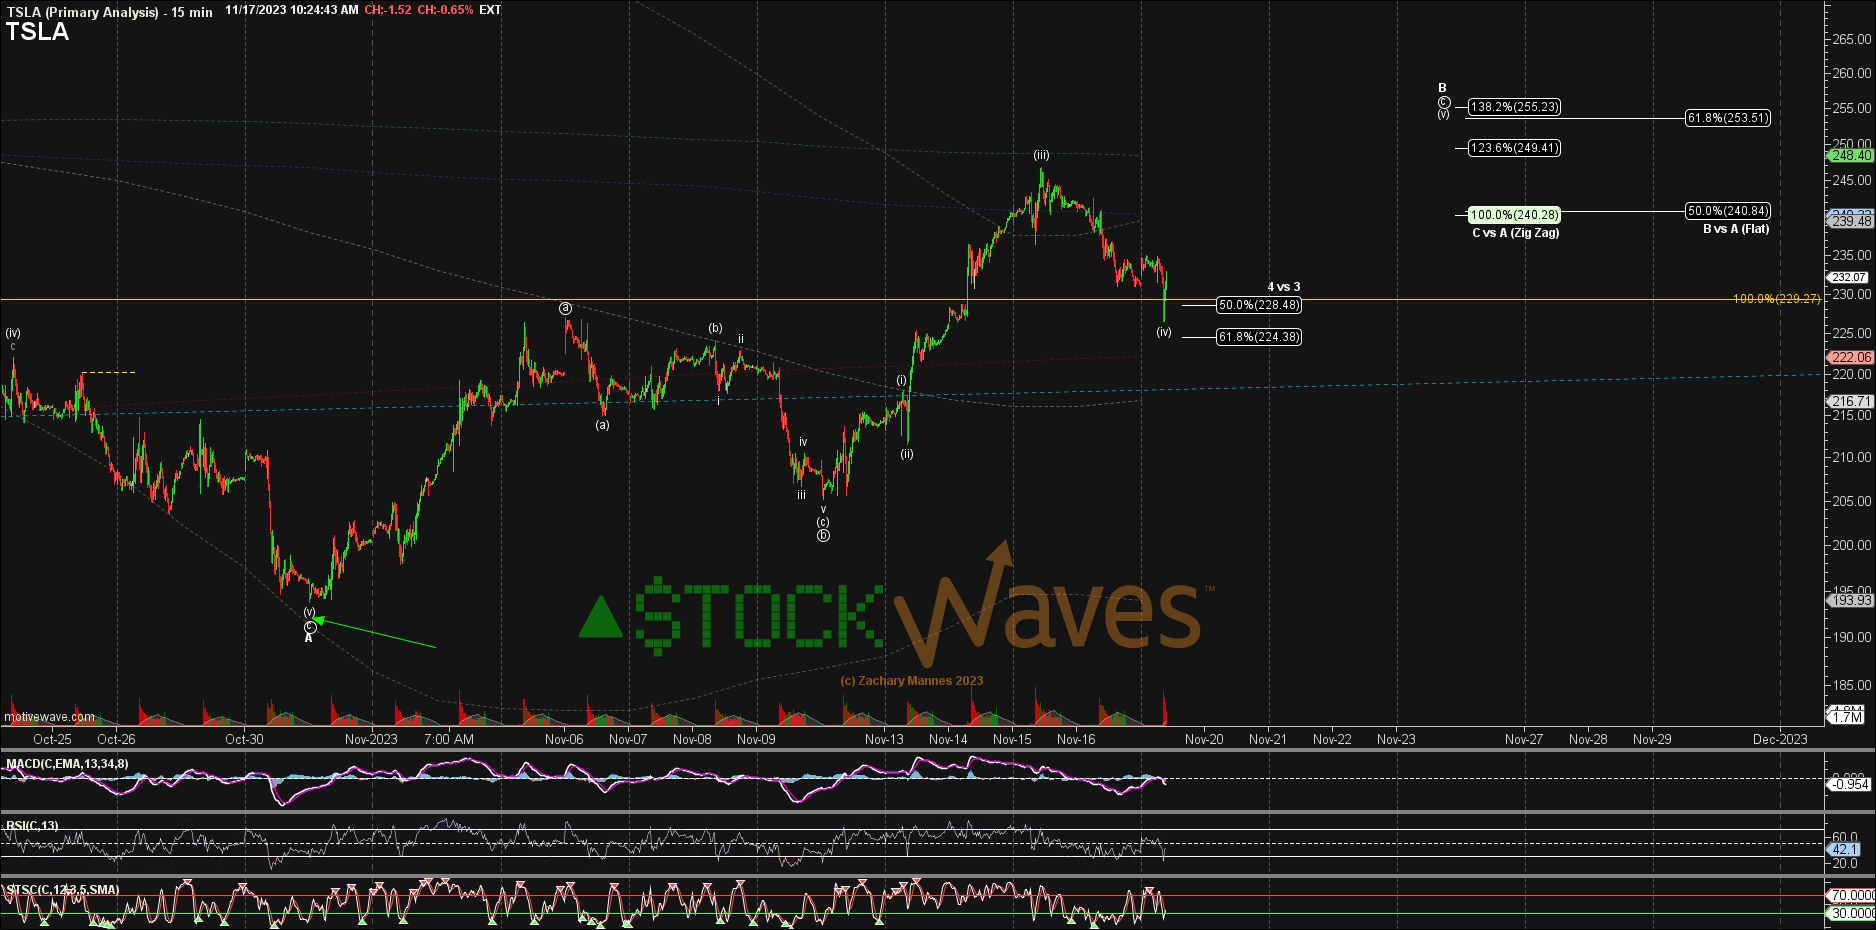
Here are part of Zac’s comments with a warning area to watch:
“Perhaps long here but with a strong caveat that $240 - $270 can easily be heavy resistance as the B wave in a wider/deeper [2]. And the WAY it gets into that region will be very telling and might have us trimming any longs and flipping short abruptly.”
Again, the current structure of price on the chart would necessitate a ‘hold’ rating on TSLA. This is not to say that we are not trading this stock ourselves. Even with a ‘hold’ rating, there are multiple opportunities both long and short depending on just how nimble one can be.
At this moment, we possibly anticipate another move higher in TSLA for as long as $226 holds. This is only a short term expectation and may change if that support does not contain price. And, it will be the structure of price that will give further clues as to what’s most likely next thereafter.
Risks: on each chart, price would have to take out the recent swing highs to defeat that larger downtrend that appears to have taken hold. For (F), the $15.50 level, for (GM), the $41 - $43 area, and for (TSLA), $270. These numbers are a bit brutish and simplistic, but they do define risk in the bigger picture.
Conclusion
Yes, there are nuances to the analysis. Once familiar with our methodology, our members discover a powerful ally on their side to provide guidance and risk management in their trading/investing.
We have an extensive Education library available at Elliott Wave Trader. As well, we want to teach others this methodology. Three times a week we have beginner and intermediate level videos where we show the exact way we count the waves and give in-depth analysis techniques. This methodology, if you give it the chance, will change the way you invest forever. More on that can be found here.
There are many ways to analyze and track stocks and the market they form. Some are more consistent than others. For us, this method has proved the most reliable and keeps us on the right side of the trade much more often than not. Nothing is perfect in this world, but for those looking to open their eyes to a new universe of trading and investing, why not consider studying this further? It may just be one of the most illuminating projects you undertake.
