Focus On GLD - Market Analysis for Aug 22nd, 2018
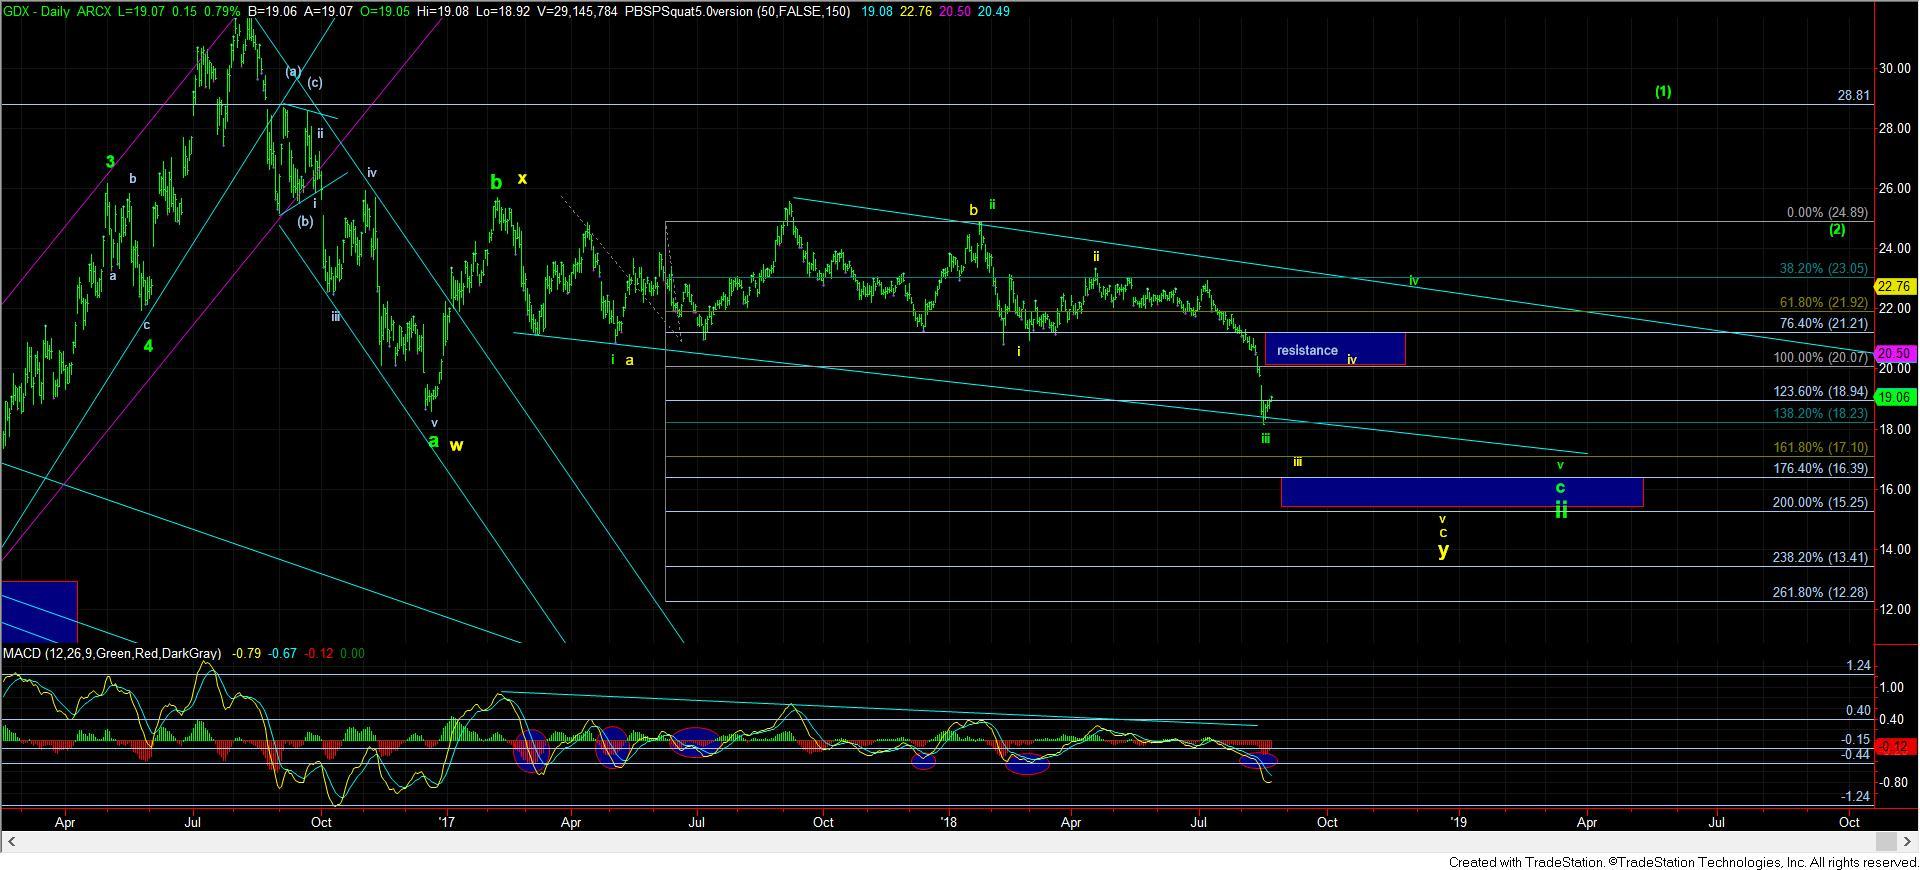
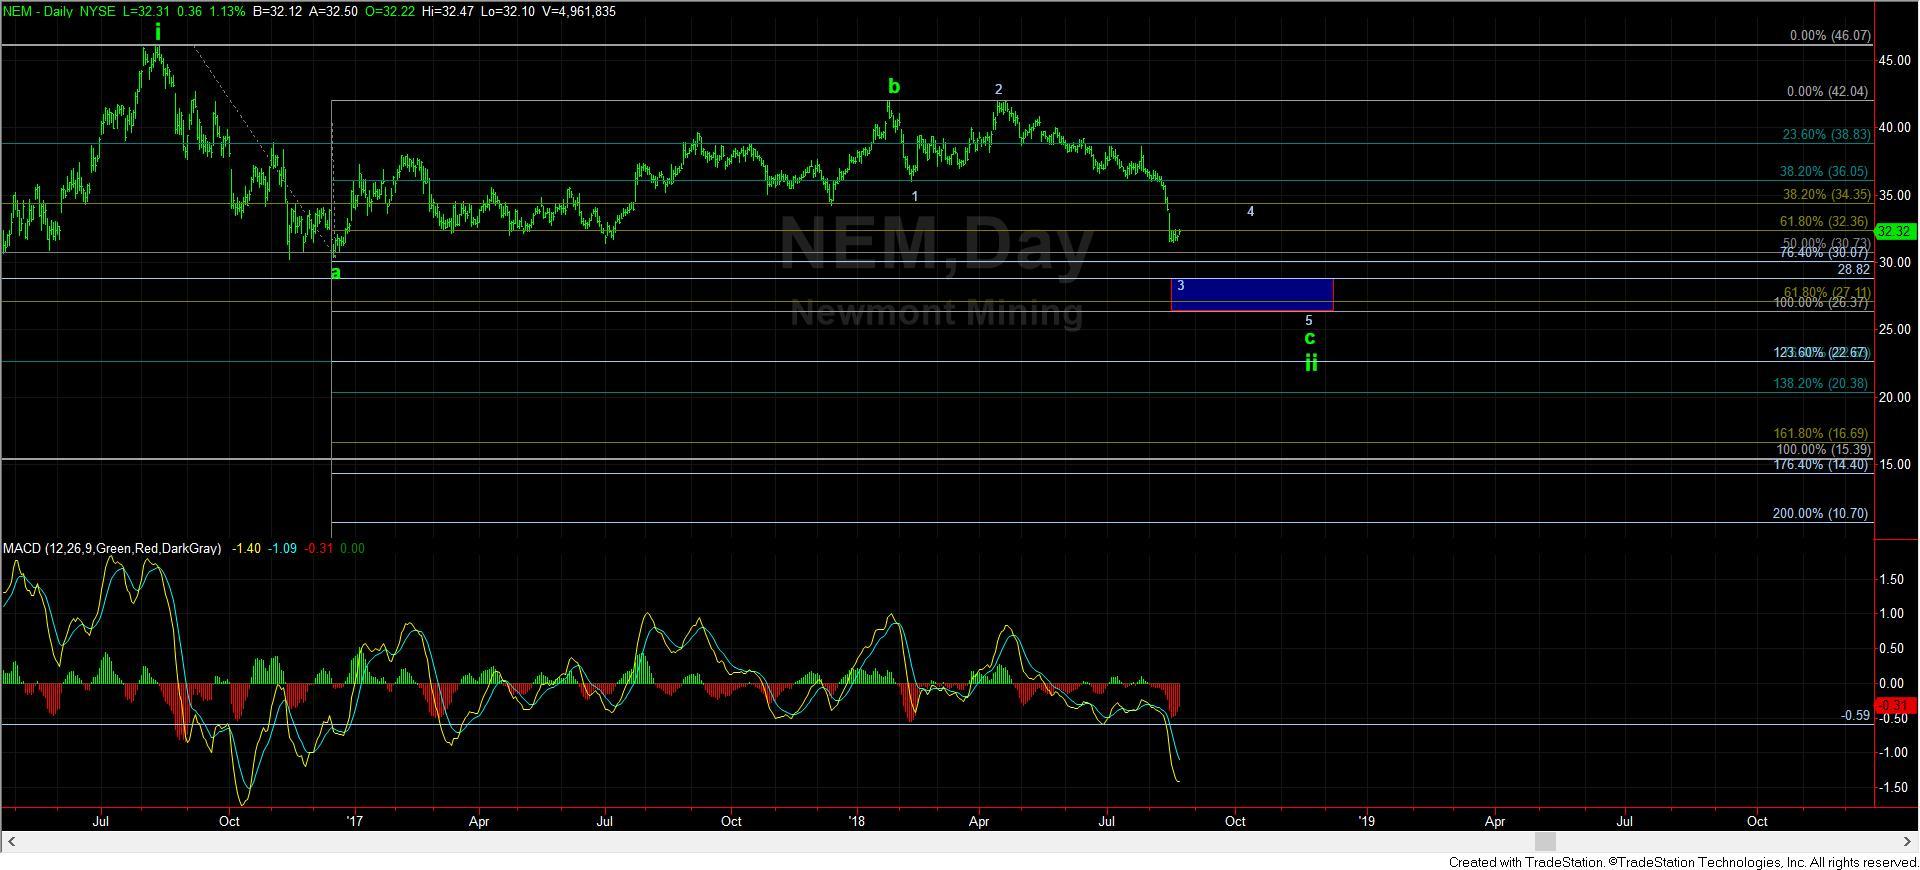
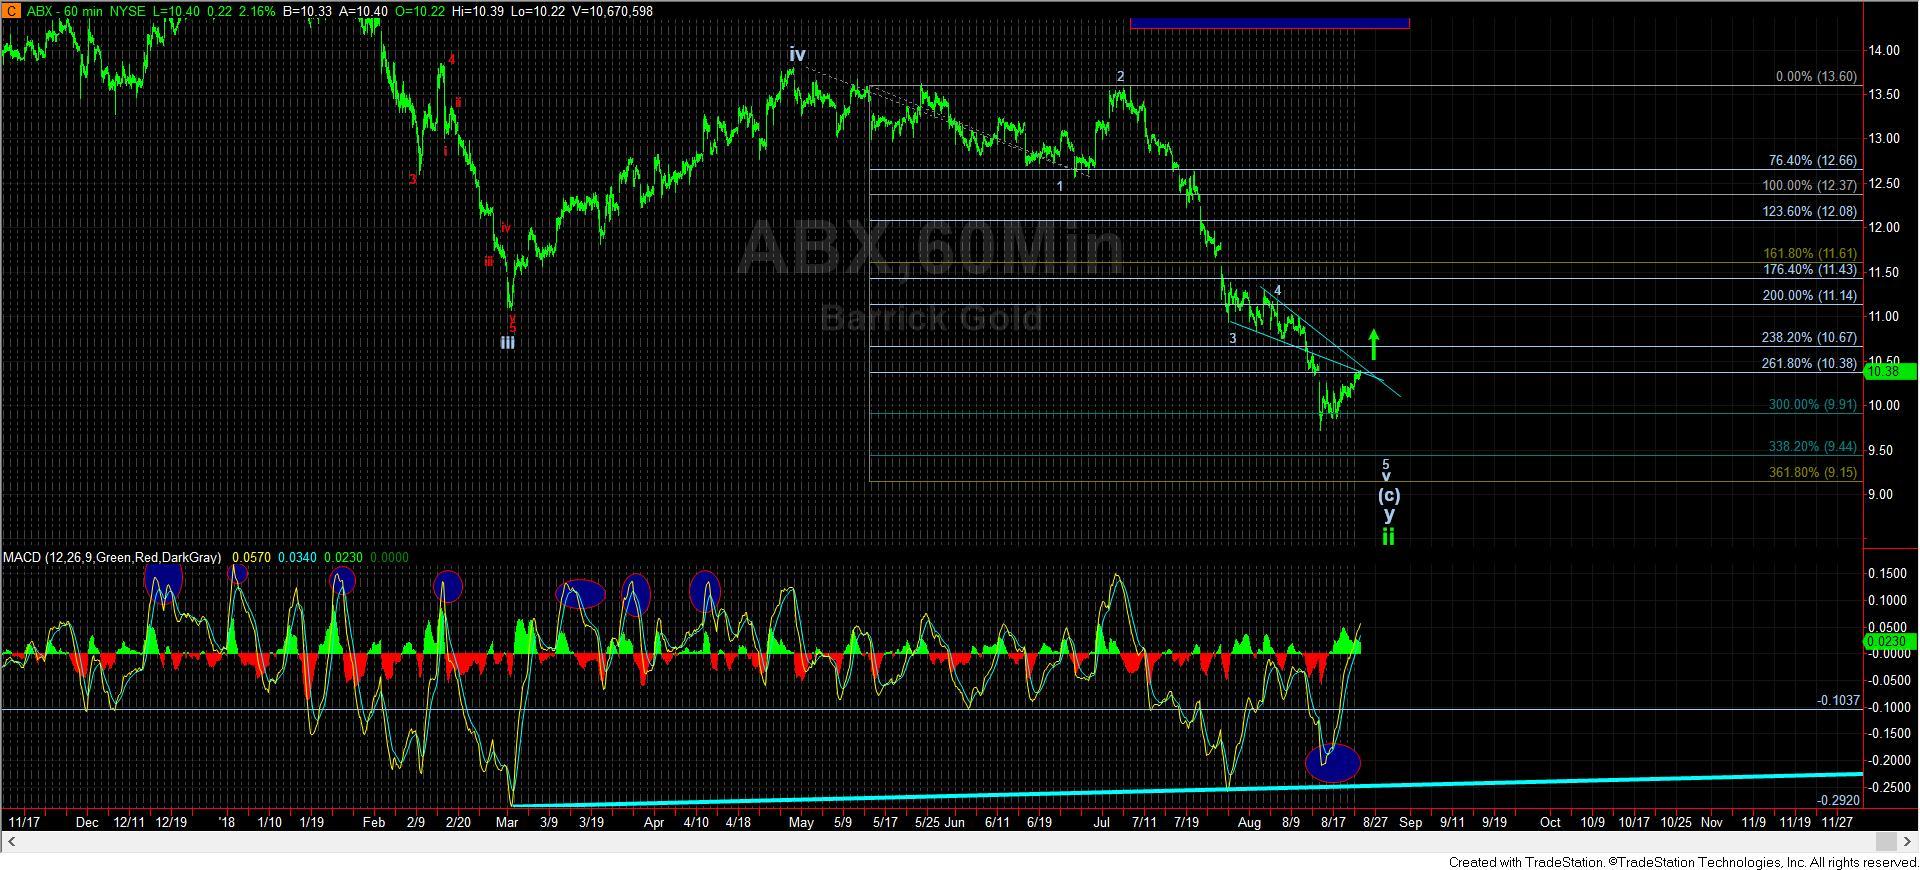
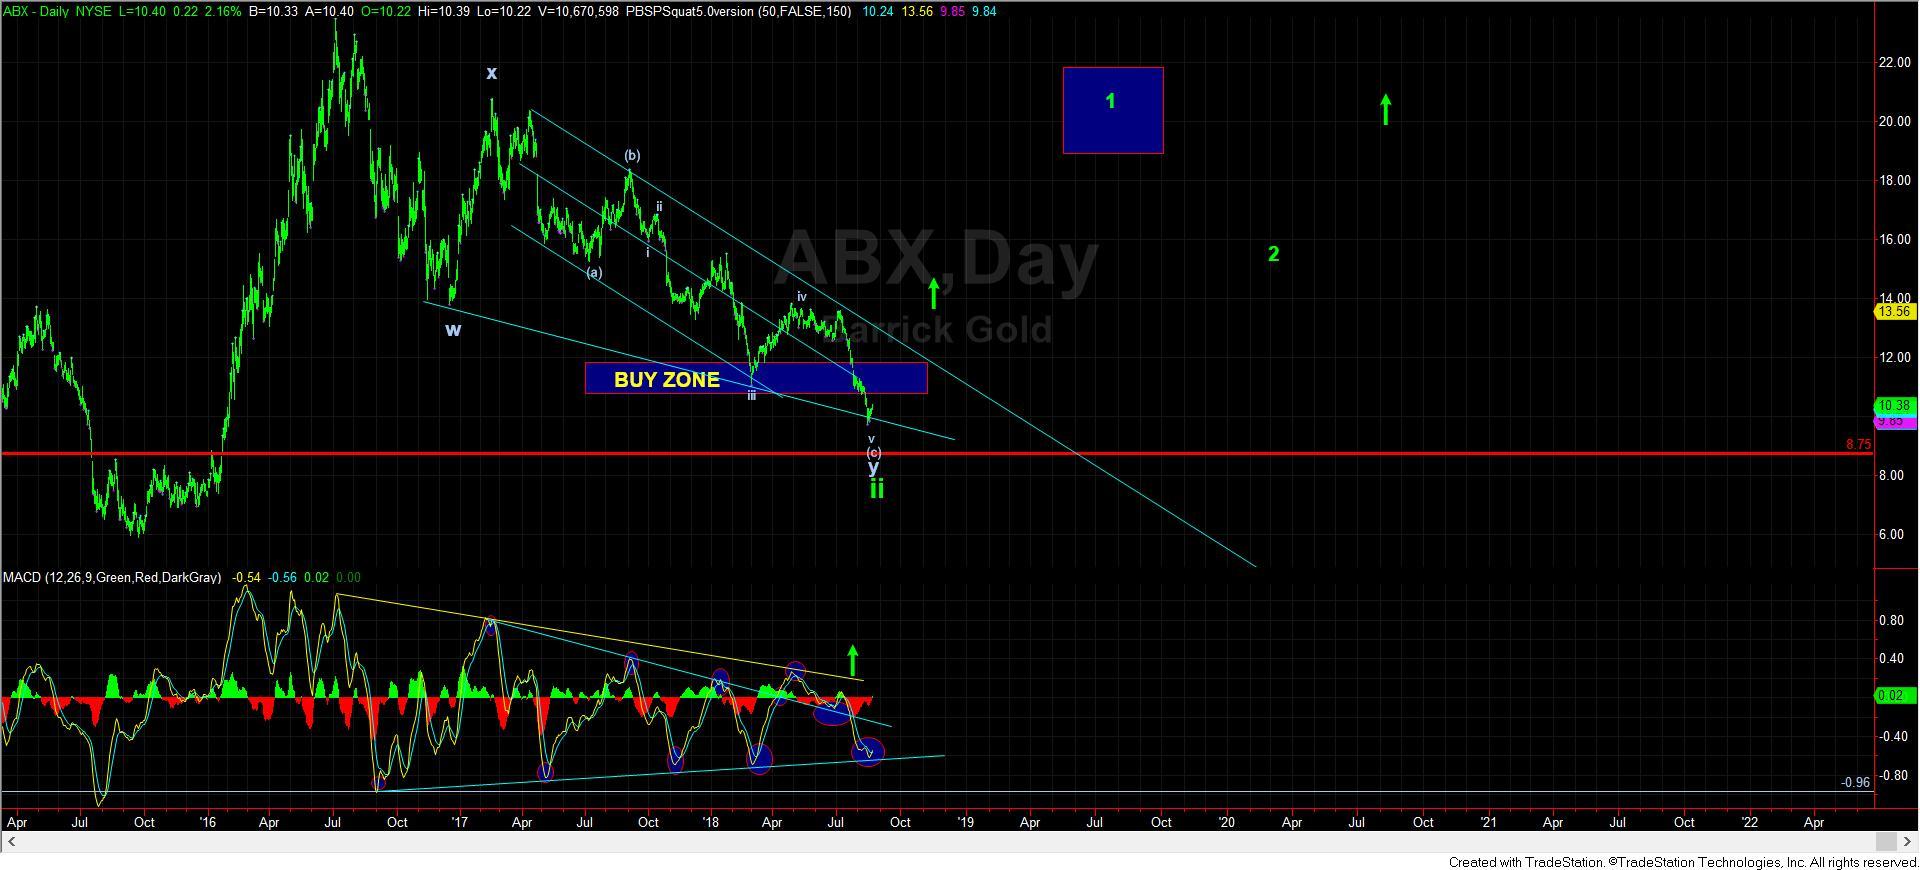
With the GDX and NEM seemingly only getting a corrective bounce, the more immediate pattern lower seems the more likely outcome at this time in those charts. Meaning, that this bounce is only a 4th wave in the 3rd wave down in this c-wave of wave ii. Should we see much more extensions higher, then I may revisit this expectation.
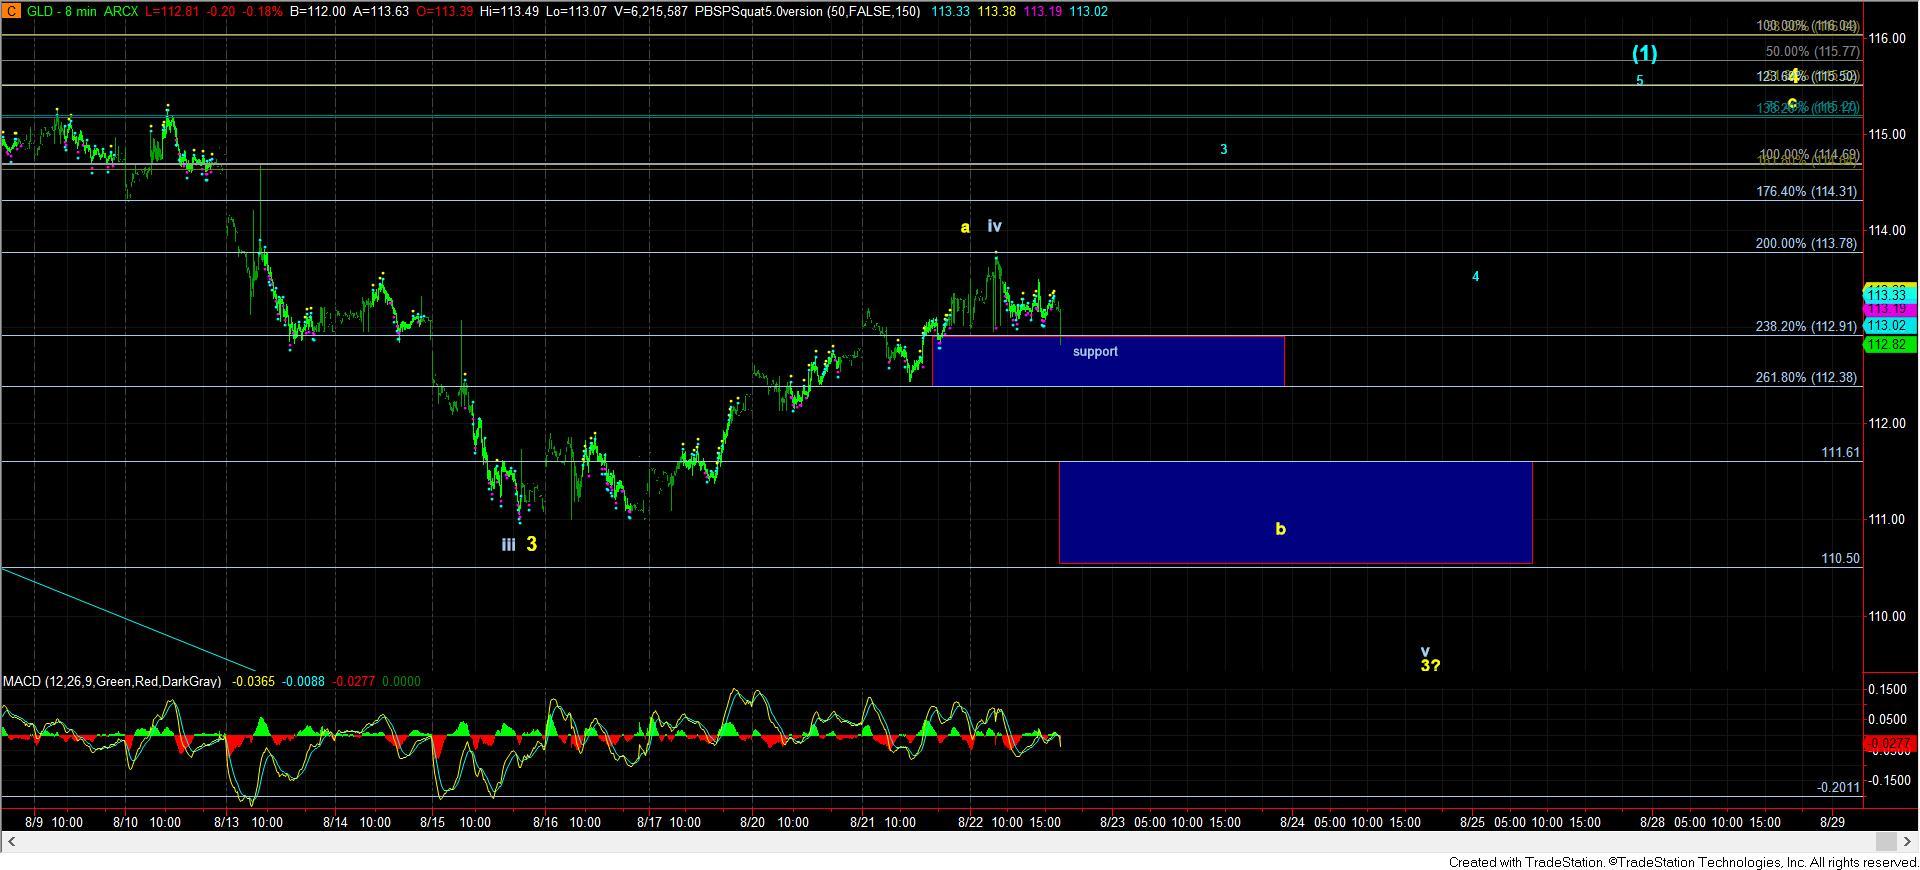
But, this brings me to the GLD, which seems to be caught in between the potential of its wave 3 having bottomed, and already being in wave 4, or if it still needs one more drop to complete its wave 3 in the c-wave of ii.
While I posted this in the morning, I think it is worth repeating. The question I have in the GLD is if we are still in wave 3 down (this being wave iv of that final 5th wave in wave 3), or if we have completed wave 3 already. Moreover, there is still some potential that we have fully bottomed, but that has to be proven to me, as I don’t see that as the most likely outcome at this point in time.
As you can see in the attached 8-minute chart of the GLD, we have enough waves in place to consider this rally as completed. The question is then what has it completed? Unfortunately, I will still need more clues before I can decipher exactly where we are in the GLD. So, let me tell you what I am looking for at this time.
As long as that upper support level over 112.30 is held, the market can continue higher and complete a 5 wave rally off the lows. That would suggest that the blue wave 2 has bottomed. At this time, I would say this is my least favorite or likely outcome.
Rather, if we have indeed topped out today, then an impulsive drop below 112.30 would suggest that we are heading lower in wave v, which means that wave 3 down has not yet completed.
Alternatively, should the drop below 112.30 be clearly corrective, then I expect we will hold the yellow b-wave support box, and begin a rally up towards the 115-116 region for the c-wave of wave 4. Ultimately, this will also lead to a lower low in the coming months before the GLD will have completed its c-wave of wave ii.
In summary, I still have no indications that the complex, as a whole, has bottomed. Rather, there are still paths to take us to a lower low, which are much clearer in miners such as NEM. However, while I am giving the GLD an opportunity to prove it may have bottomed, the main questions with which I am now looking for answers is if GLD has one more lower low (which means we are in yellow wave 4), or two (to complete waves 3, 4 and 5).
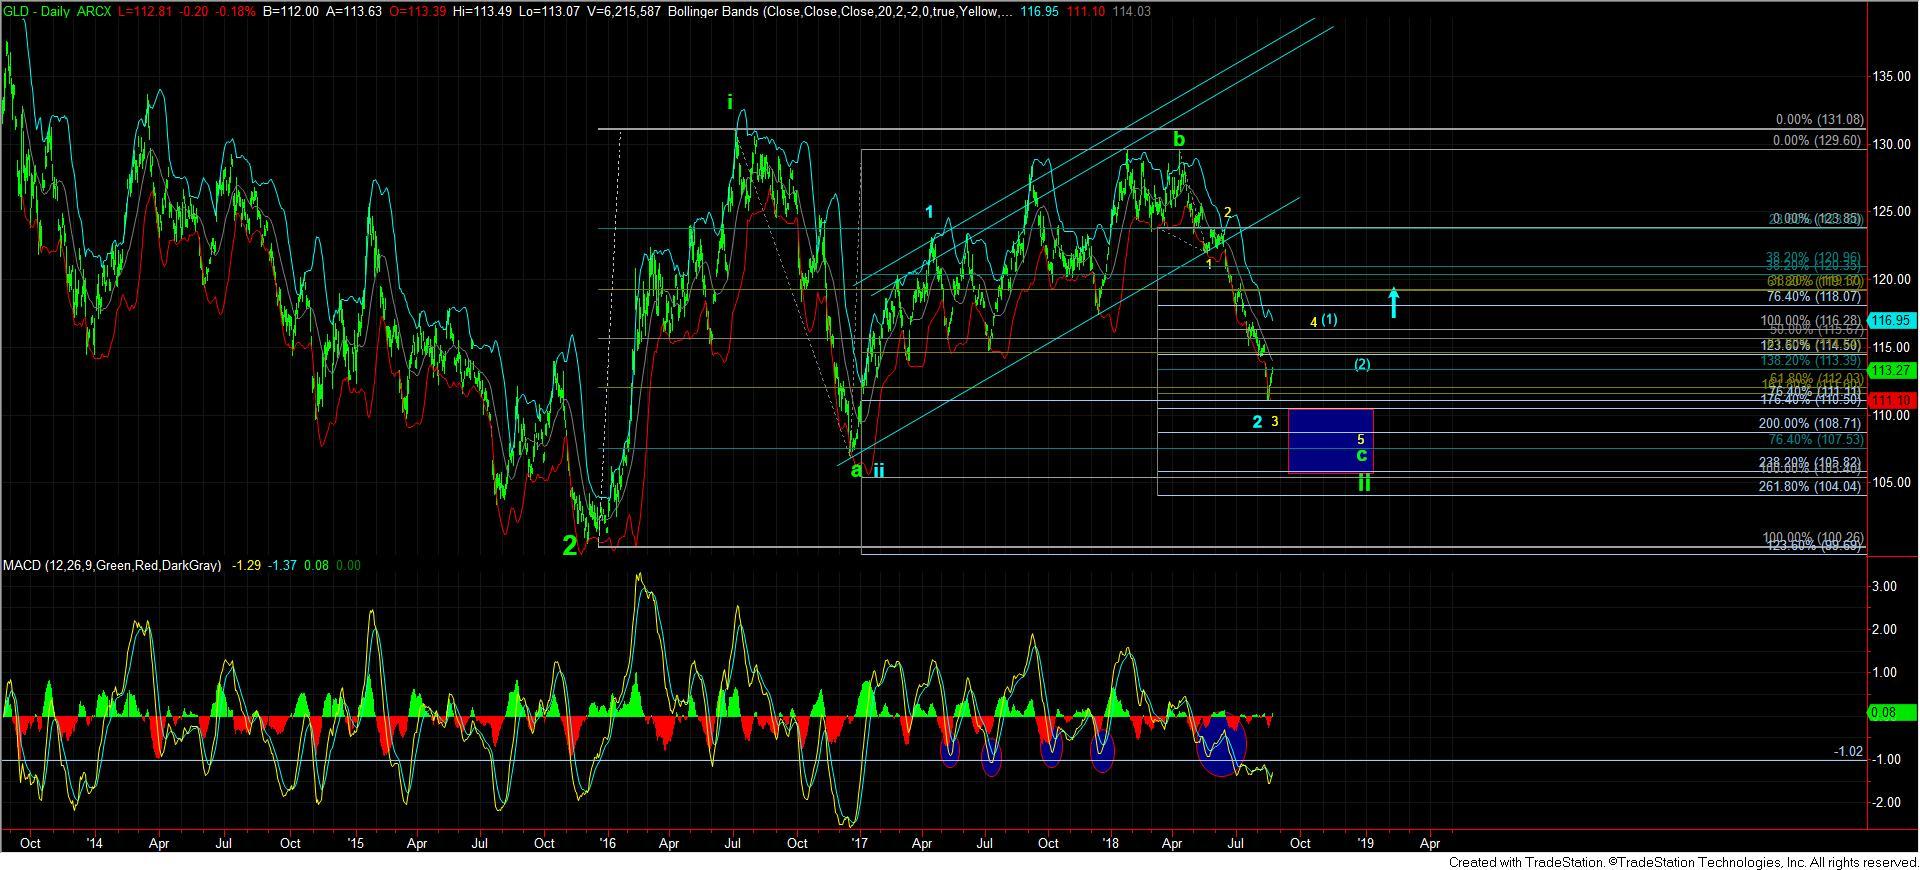
Should the market provide a clearer signal that a bottom has been struck I will certainly alert you to that potential. But, for now, I see it as the lesser likely outcome. Yet, please maintain focus on the larger degree structure on the daily chart in the GLD. This is still a bottoming pattern, and the next major rally should finally provide us with the type of action we experienced in early 2016, and potentially even much greater.
Lastly, while I know many have been very frustrated with the extend of this correction since the 2016 high, and believe me when I tell you that I am certainly within that group, please do not allow it to cloud your perspective about the potential being represented by this bottoming cycle developing in the complex.