Five Waves Down Is Significant - Let's Talk About It
 By
Levi
By
Levi
Five Waves Down Is Significant - Let's Talk About It (SPX)
This is why homework is so important. Time has to be taken to properly analyze the market from all angles. Invest the necessary efforts to even see where you can be wrong. And then, do it again. One of the most poignant truths that I have learned in my time thus far here at EWT is that markets are "fluid, dynamic, non-linear systems". Remember, this is coming from a recovering cycles/timing addict. However, once I was shown the true nature of the markets and then accepted and agreed with these precepts, it was a completely different vantage point.
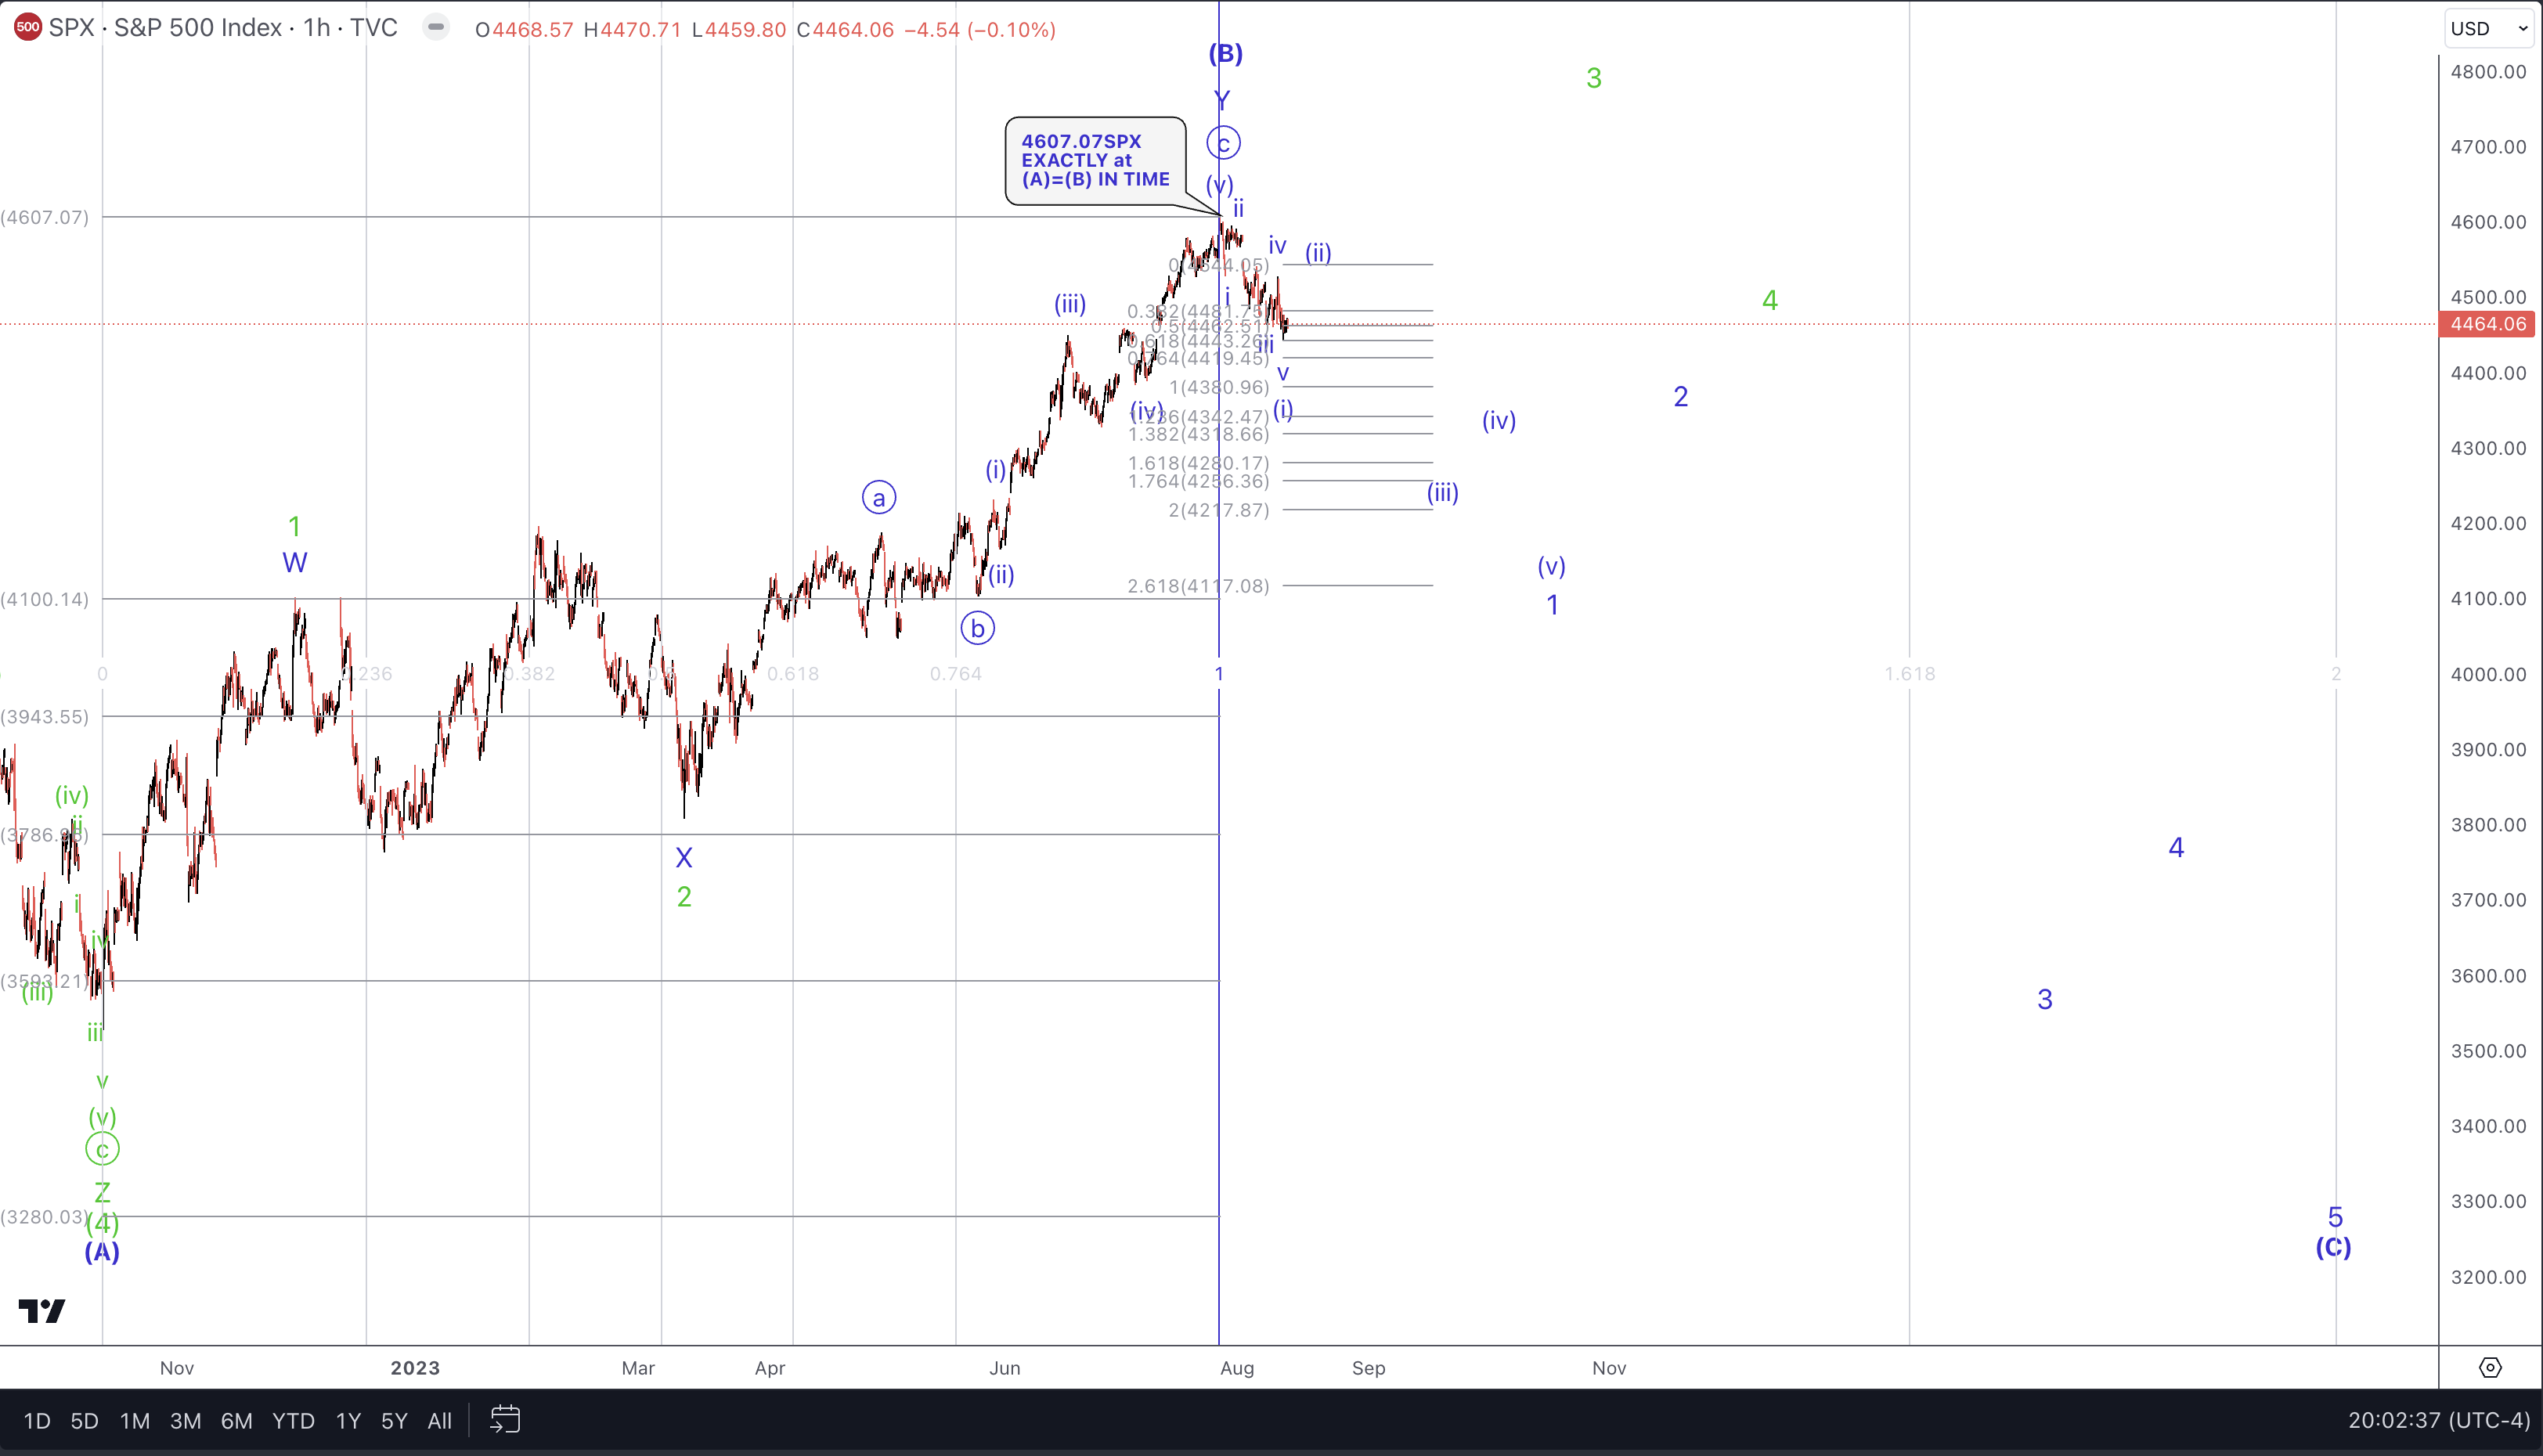
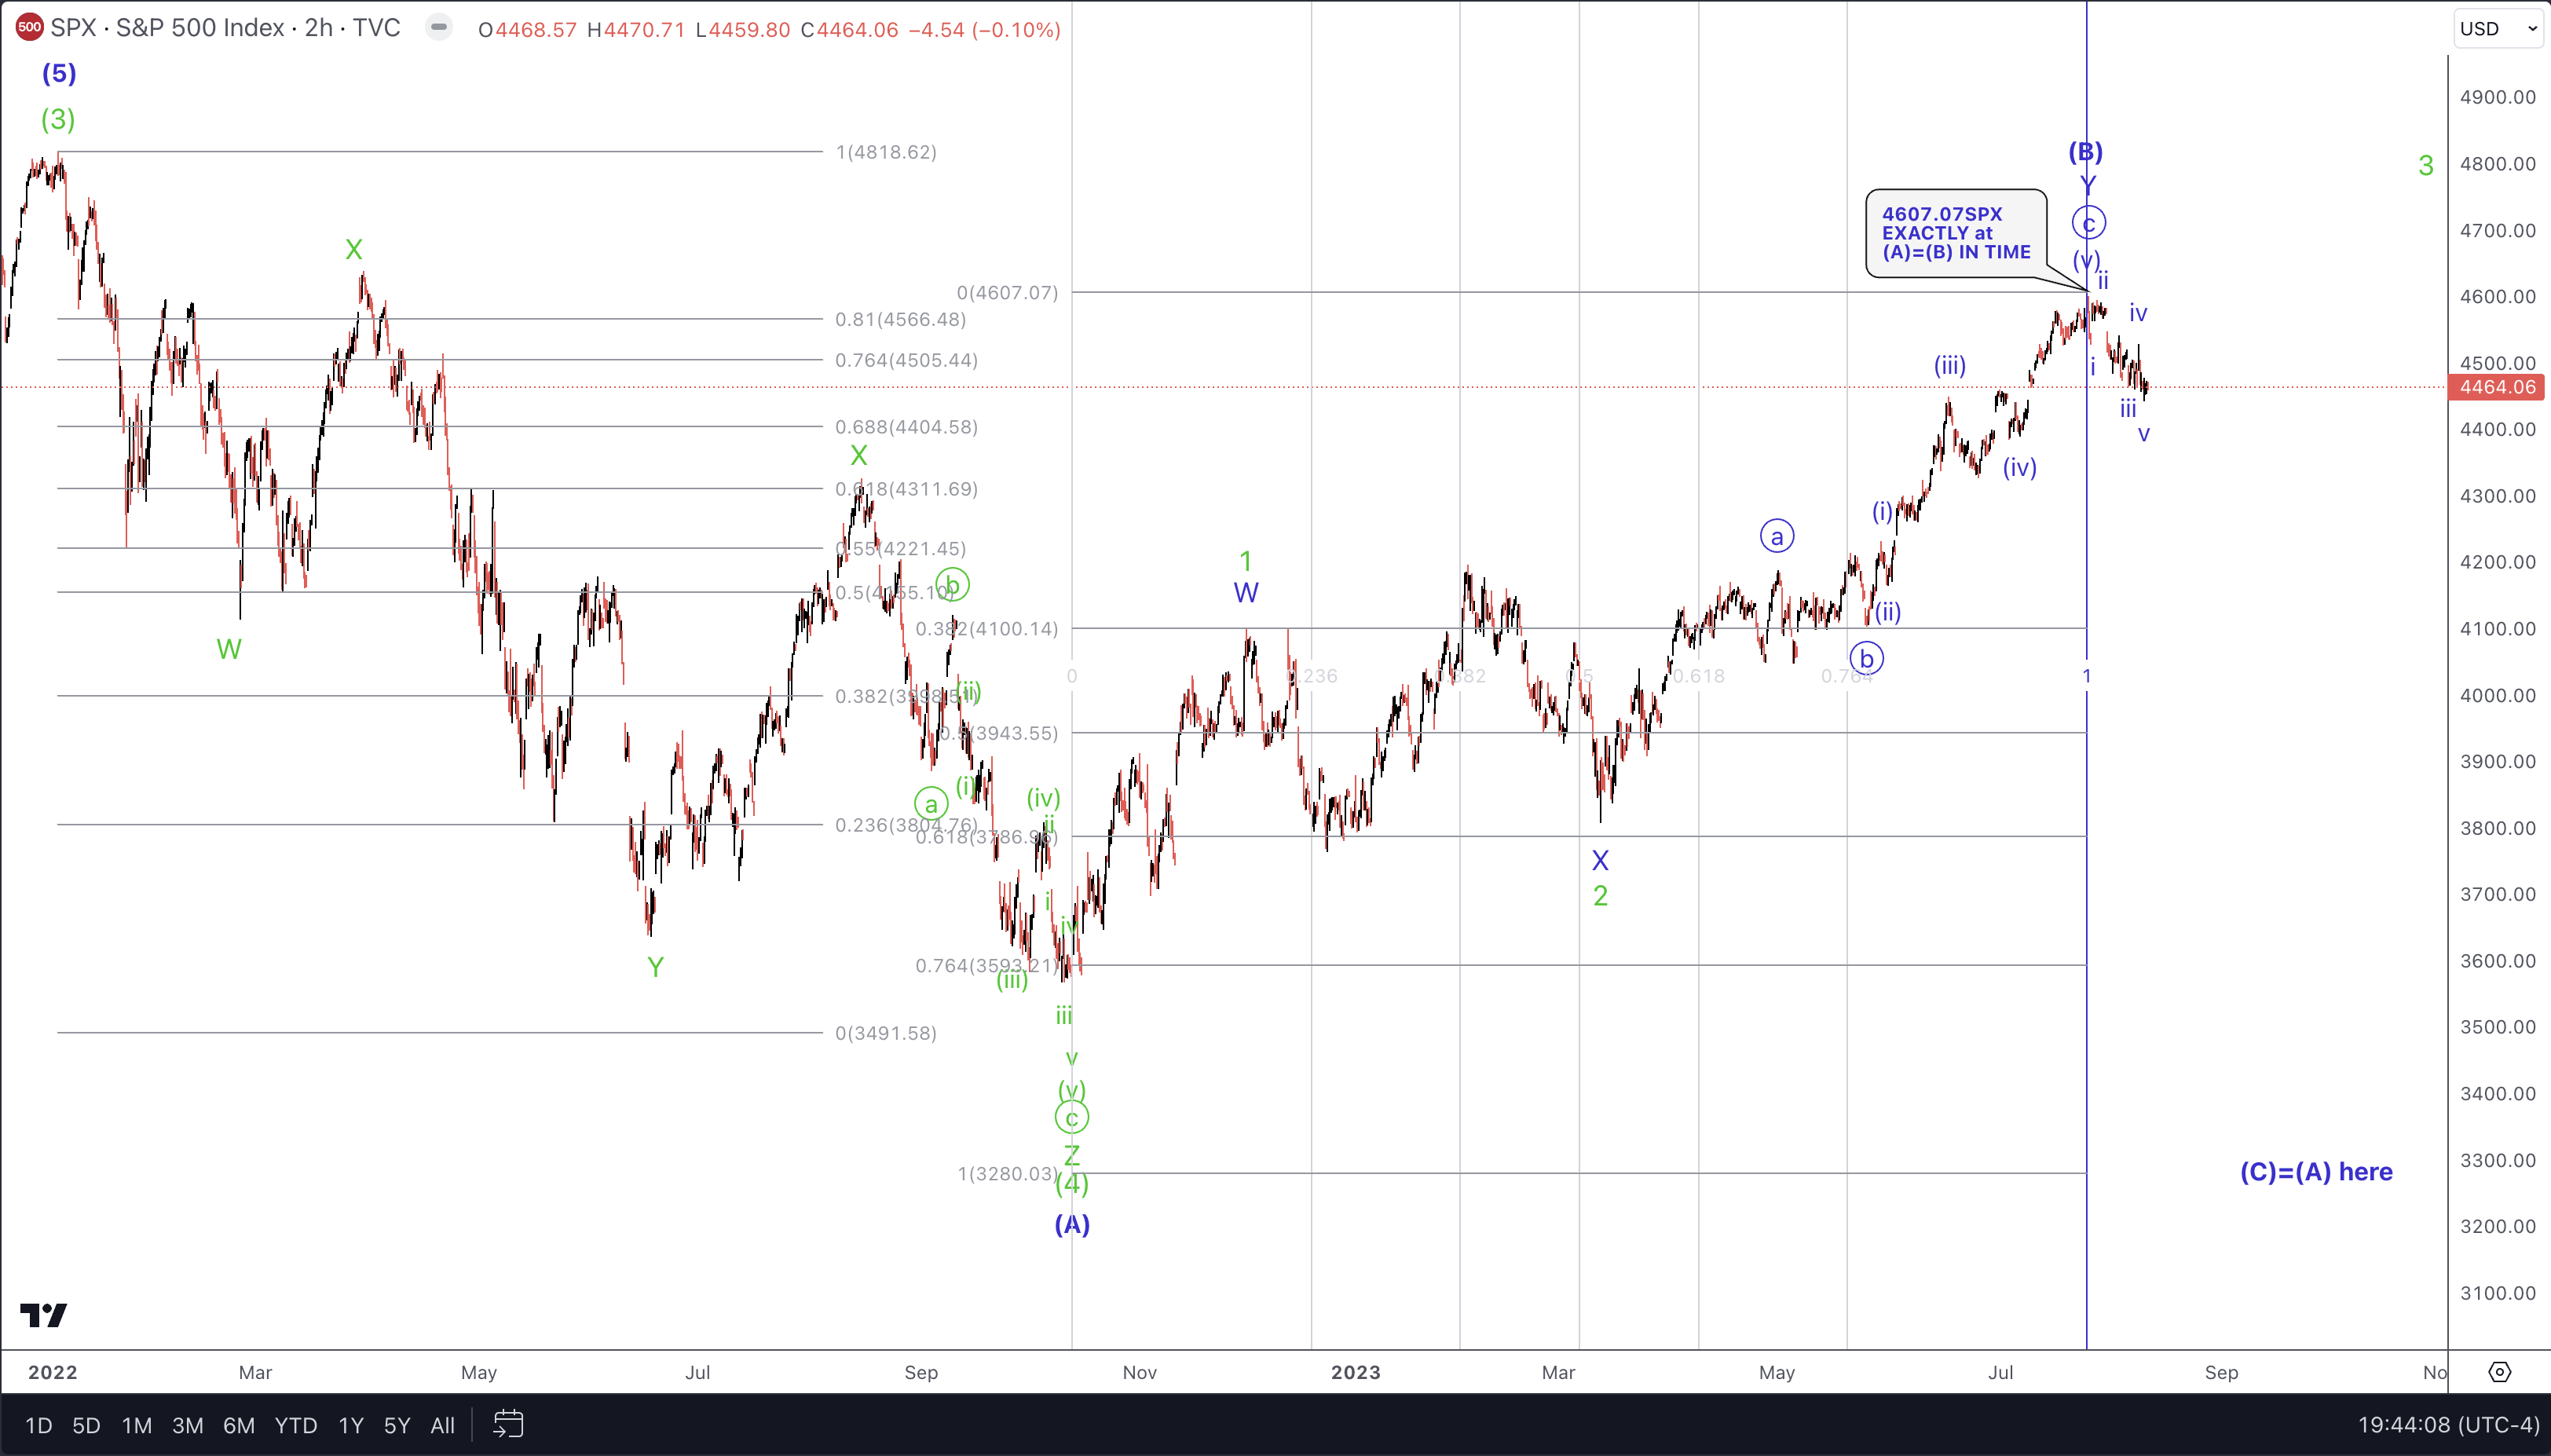
So, when the stream of the structure of price completes a specific formation, we must sit up straight and pay attention to it. The markets are speaking. Ultimately, the only thing that matters is price. Timing can be used as a tertiary tool in the box, but that's all that it is. It was not until today that I could clearly identify 5 waves down in the SPX cash chart. This is significant. Why?
Now, this next little portion may sound contradictory to what I just stated above, but bear (no pun intended) with me, please. Zooming out, if you project the time it took the Blue (A) wave to find a low from the 4818 high on 4JAN22, the (B) wave as shown at 4607 would be struck on at the open 27JUL23 should (B)=(A) in time. And yet, that is only one tertiary data point. (B) = (A) in Time to the exact hour. Guess when the high was struck?
What more do we have?
I do not hang my hopes on timing. Nor do I project cycles in half circles from here to there. Well, I used to. And, quite frankly, these cycles would at times catch some fantastic moves. They also meant nothing at other moments. So, how to know what to do? Follow Price. It's the only thing that matters.
Well, IF the Blue (B) wave has indeed topped, it has done so in quite a strange manner. Normally we will see 'B' waves up to the .618 or the .764 retrace of (A). If the Blue count is true, this Blue (B) even went above the .81 retrace - strange! But, we have 5 waves down and exactly from the 1.00 in time to the hour. Now we have two data points and one of them (price) is significant. The (C) wave should be 5 waves down. As well, the subwave structure should point us to perhaps the (C)=(A) in price. Indeed, we have that potential. More data points continue to accumulate.
Read this closely, please - I am not yet of the mind that we are headed to 3280SPX. But we view the markets from a probabilistic viewpoint. So, if you gave me the mandate to illustrate the most probable path right now, today, at this moment, I would be obliged to show the Blue one. Why? Because (B)=(A) in Time and we have 5 waves down from (B).
The bulls can easily defeat this probability. How? Simply reclaim 4607. Will this happen? I don't know. However, if we get a corrective bounce to perhaps the 4545 area, it would be a short opportunity with risk at that prior high of 4607 and a potential downside of -300 points to start.
The bullish option would be for a corrective bounce and then another 5 wave decline that holds the 4275 - 4394 area. I am staying fluid in my thoughts and will adjust according to what the markets give us. This is not to flip-flop nor present sensationalistic material. But I see a clear downside setup in place. Yes, it can be overcome. Will it?
When the facts change, I change my mind. What do you do - sir? (Keynes)