FCX: A Cyclical Setup That May Reward the Nimble
 By
Levi
By
Levi
Freeport-McMoRan is inherently a highly cyclical beast — it’s simply the nature of this market sector. And right now, we have what appears to be a slight conundrum. That doesn’t leave us in the lurch. We have tools that provide the dynamic utility needed to navigate this environment and help guide our decision-making process. Let’s first see the terrain via Lyn Alden’s most recent commentary. Then we’ll explore what human behavioral patterns are telling us through the structure of price on the chart.
“FCX has a neutral-to-bullish fundamental setup.
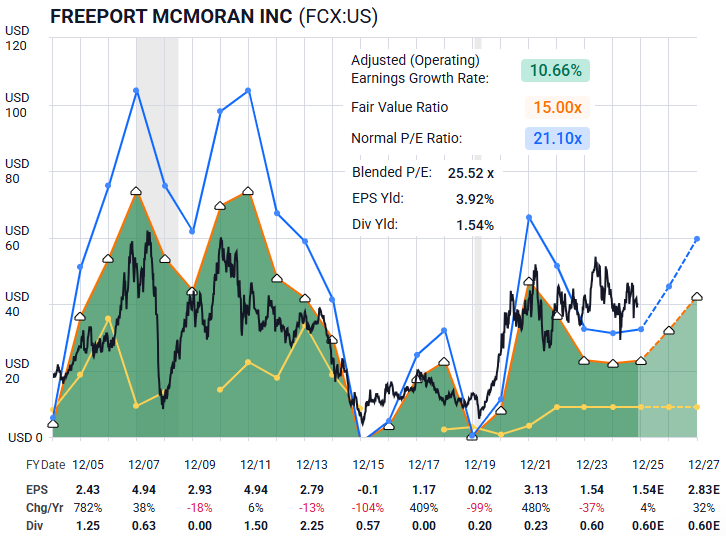
Of course, since it faces jurisdictional risk and commodity price risk, and its credit rating is barely investment grade, which gives it a pretty speculative element. I'd pay close attention to technical indicators on this one since the fundamental drivers can change rather swiftly. Overall though, the fundamentals do look reasonably supportive.” — Lyn Alden
Let’s heed Lyn’s leanings here and look closely at what sentiment is saying. First, the potential “fly in the ointment” — the price of copper. We must maintain an open mind because the Copper chart and the FCX chart are not exactly in lockstep at this moment in time. Take a look below at Zac’s latest view on Dr. Copper.
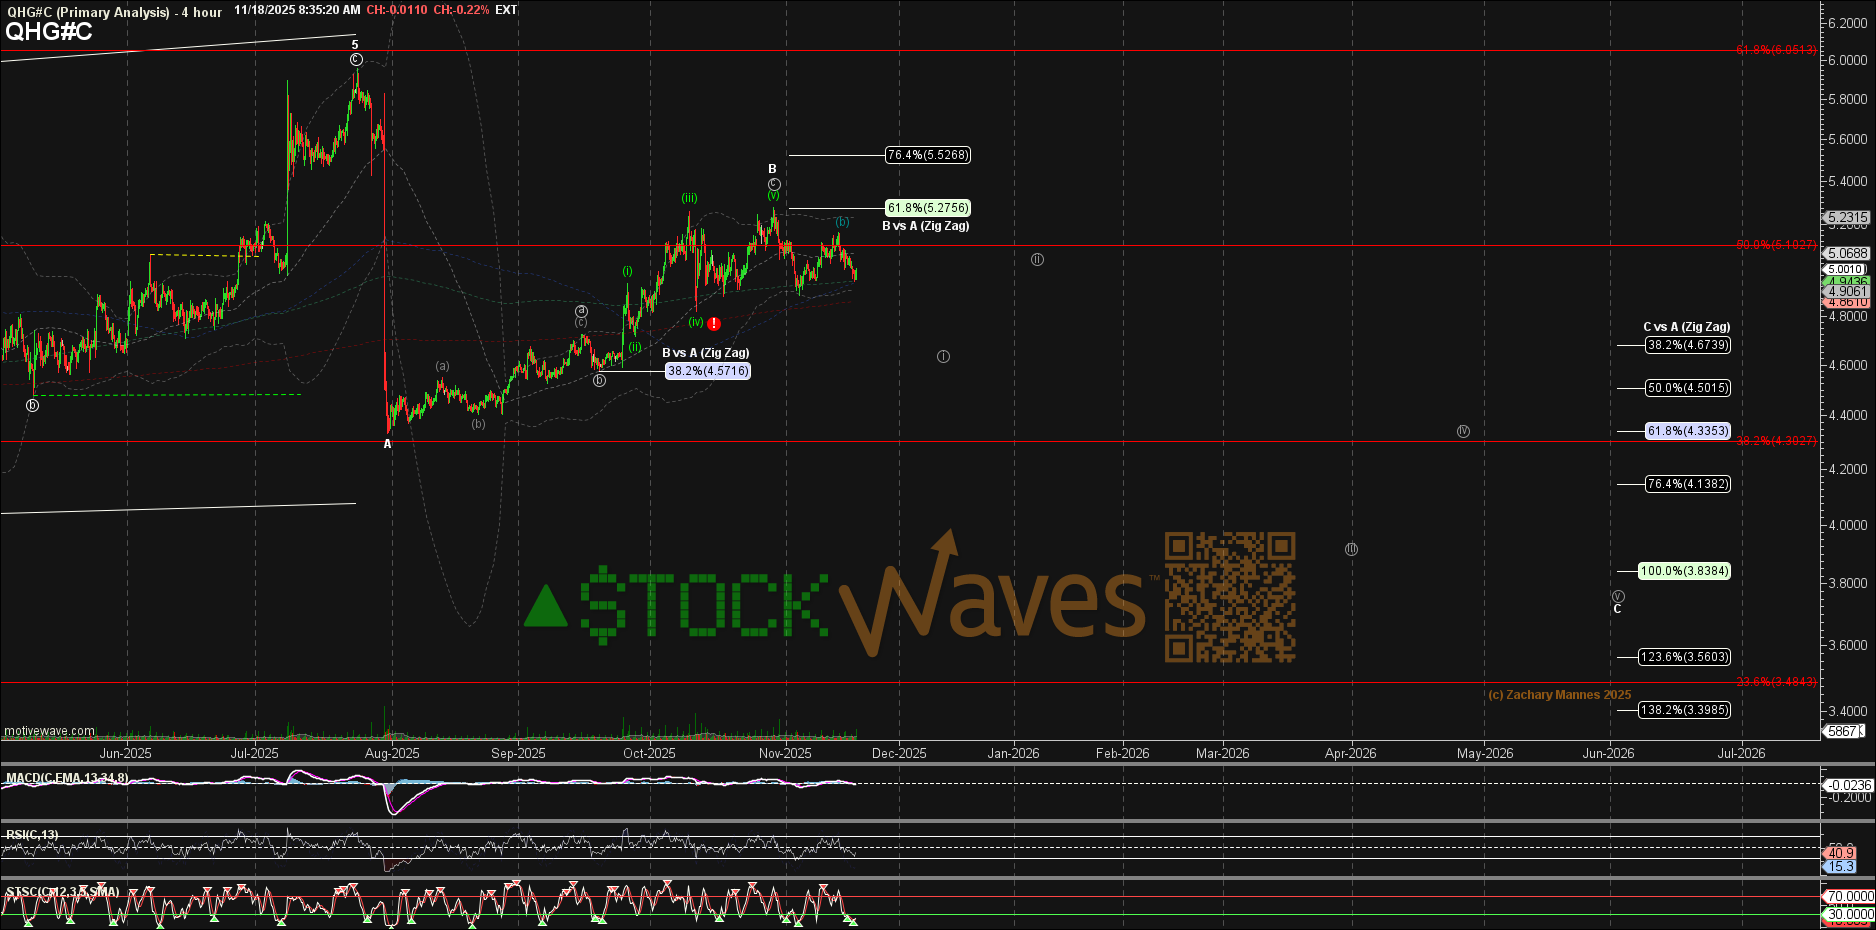
This is important because copper remains the dominant revenue driver for Freeport. Note Zac’s comments regarding this chart:
“I am also a little concerned with the current bearish potential of HG.F, but since the possible C-wave down there is looking like a diagonal, it could chop around well into Q1 before even breaking the July low.” — Zac Mannes
Might this buy some time for the FCX chart to play out in a bullish fashion? Rather than venturing guesses, let’s cleanly determine our risk-versus-reward via the structure of price.
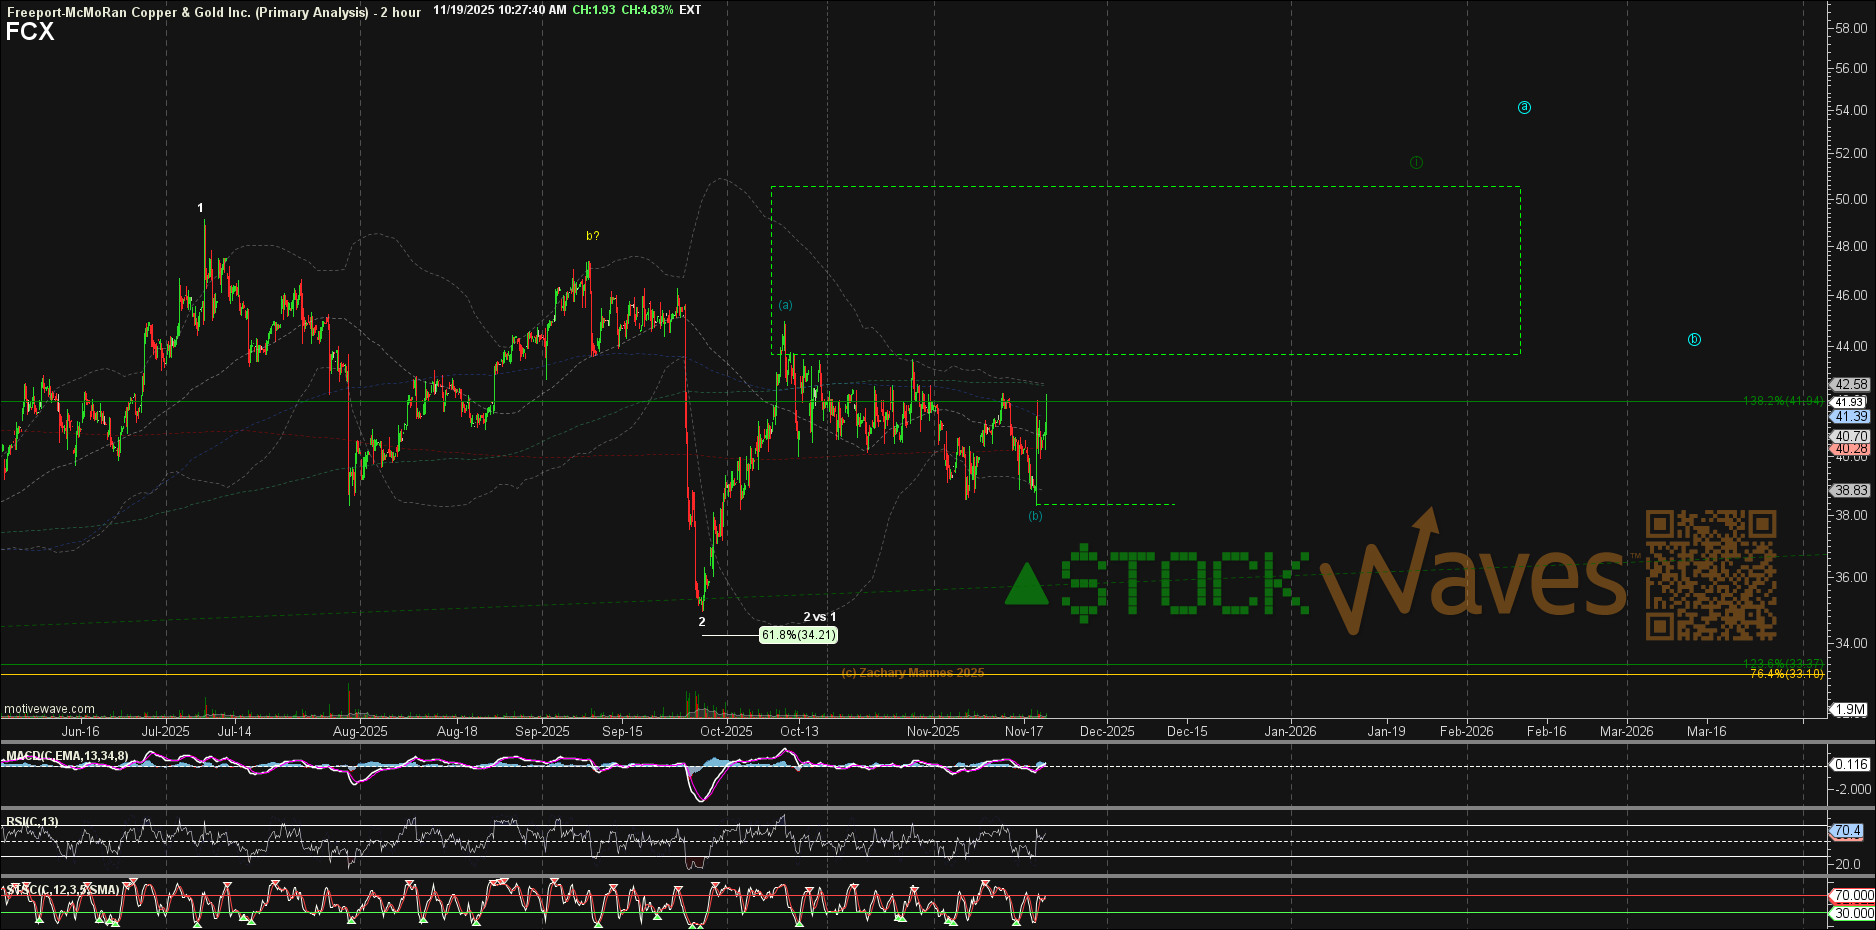
The standout support — the must-hold — is the recent low at $35. If that low breaks, the setup busts. Simple as that. But that also gives us clearly defined risk.
What about the upside?
If we are beginning a wave 3 higher, then typical targets for a 1-2 setup sit in the 1.236–1.382 extension zone, and potentially the 1.618. That projects to $60+ from current levels.
Now, quite openly: where will the push come from to motivate the stock up ~50% from current levels? Does the Copper chart morph into something more bullish? Is there an unseen catalyst ahead? We simply don’t know — and the reality is, we can’t. Fortunately, we don’t have to.
We define our risk at the $35 low. Confirmation of the upside pathway strengthens with a move above the $43–$44 region. From there, if the initial move plays out, support likely moves up accordingly.
FCX may indeed reward the nimble here. Just keep in mind that setups are not certainties — projections are not prophecies. But highly probable setups tend to play out more often than not — and this one qualifies.
Now the question is: will it follow through?
